Disease dynamics in a stochastic network game: a little empathy goes a long way in averting outbreaks
- PMID: 28290504
- PMCID: PMC5349521
- DOI: 10.1038/srep44122
Disease dynamics in a stochastic network game: a little empathy goes a long way in averting outbreaks
Abstract
Individuals change their behavior during an epidemic in response to whether they and/or those they interact with are healthy or sick. Healthy individuals may utilize protective measures to avoid contracting a disease. Sick individuals may utilize preemptive measures to avoid spreading a disease. Yet, in practice both protective and preemptive changes in behavior come with costs. This paper proposes a stochastic network disease game model that captures the self-interests of individuals during the spread of a susceptible-infected-susceptible disease. In this model, individuals strategically modify their behavior based on current disease conditions. These reactions influence disease spread. We show that there is a critical level of concern, i.e., empathy, by the sick individuals above which disease is eradicated rapidly. Furthermore, we find that risk averse behavior by the healthy individuals cannot eradicate the disease without the preemptive measures of the sick individuals. Empathy is more effective than risk-aversion because when infectious individuals change behavior, they reduce all of their potential infections, whereas when healthy individuals change behavior, they reduce only a small portion of potential infections. This imbalance in the role played by the response of the infected versus the susceptible individuals on disease eradication affords critical policy insights.
Conflict of interest statement
The authors declare no competing financial interests.
Figures

 . Given the state of the disease and contact network at time t, individuals decide to take preemptive measures or not at time t+ which determines the state of each individual at time t + 1 according to the Markov chain dynamics in (7). If ai = 1, individual i does not take any preemptive measures. If ai = 0, i self-isolates reducing any risk of disease contraction or spread to zero. A healthy individual can only contract the disease from an interaction with a neighbor if and only if the individual’s neighbor is infected and neither of the two self-isolates. These interactions are marked by a red dot in the middle figure. We enumerate each pair of state and action in (b).


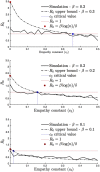
 for top, middle, and bottom figures, respectively. The dotted dashed lines are the R0 upper bound value (2) with respect to the c2 value on x-axis. For c2 = 0, we have the red circled points corresponding to the R0 upper bound when there is no behavior response by the initial sick individual. Note that all the red circled points indicate R0 > 1. From (3), the critical values of c2 that make R0 < 1 equal to 0.02, 0.16, and 0.36 for
  , respectively. These points are marked in blue. R0 upper bound increases linear in β according to (2). We simulate R0 values as follows. We generate a scale-free network with γ = 2 according to the preferential attachment algorithm. For each β and c2 value pair, we consider 100 realizations with randomly selecting patient zero and counting the number of individuals infected by patient zero until patient zero heals. Each point in the solid lines corresponds to the average of the total count values in 100 initializations. We observe that the simulated average R0 is less than one above the critical c2 value in (3).
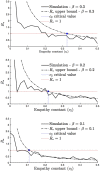
 for top, middle, and bottom figures, respectively. The dotted dashed lines are the
  bound value in (5) with respect to the c2 value on the x-axis. The critical values of c2 in (6) that make
  are 0.11, 0.22 and 0.33 respectively for
  . These points are marked in blue. We simulate
  values identical to the way we simulate R0 values in Fig. 4 except that we select the initial sick individual according to distribution Q(k). We observe the simulated
  values are less than one for all c2 values above the critical value in (6). In comparison the critical c2 values for R0 in (3)–see Fig. 4–do not accurately predict the values of c2 above which
  .
.
 is equal to 2.65, 5.3, and 8, respectively. That is,
  for all the figures. The critical values of the empathy constant,
  that make R0 < 1 for
  calculated using (6) are marked with white dotted dashed lines. The critical values of the empathy constant,
  , that make
  for
for  calculated using (6) are accurate in determining fast eradication for any value of c1 (marked with red solid lines).
Similar articles
-
Human prophylaxis-driven cooperative spreading between information and epidemics in duplex networks.Chaos. 2025 Mar 1;35(3):033152. doi: 10.1063/5.0254726. Chaos. 2025. PMID: 40126897
-
Epidemic spread dynamics in multilayer networks: Probing the impact of information outbreaks and reception games.Chaos. 2025 Mar 1;35(3):033118. doi: 10.1063/5.0236359. Chaos. 2025. PMID: 40048480
-
Spontaneous social distancing in response to a simulated epidemic: a virtual experiment.BMC Public Health. 2015 Sep 28;15:973. doi: 10.1186/s12889-015-2336-7. BMC Public Health. 2015. PMID: 26415861 Free PMC article.
-
Strategy to suppress epidemic explosion in heterogeneous metapopulation networks.Phys Rev E Stat Nonlin Soft Matter Phys. 2012 Sep;86(3 Pt 2):036114. doi: 10.1103/PhysRevE.86.036114. Epub 2012 Sep 24. Phys Rev E Stat Nonlin Soft Matter Phys. 2012. PMID: 23030987
-
Social influence and spread dynamics in social networks.Front Comput Sci (Berl). 2012;6(5):611-620. doi: 10.1007/s11704-012-1176-1. Epub 2012 Sep 19. Front Comput Sci (Berl). 2012. PMID: 32288945 Free PMC article. Review.
Cited by
-
The benefits of peer transparency in safe workplace operation post pandemic lockdown.J R Soc Interface. 2021 Jan;18(174):20200617. doi: 10.1098/rsif.2020.0617. Epub 2021 Jan 27. J R Soc Interface. 2021. PMID: 33501885 Free PMC article.
-
Modeling the impact of hospitalization-induced behavioral changes on the spread of COVID-19 in New York City.Infect Dis Model. 2025 May 27;10(4):1055-1092. doi: 10.1016/j.idm.2025.05.001. eCollection 2025 Dec. Infect Dis Model. 2025. PMID: 40547859 Free PMC article.
-
The impact of threshold decision mechanisms of collective behavior on disease spread.Proc Natl Acad Sci U S A. 2023 May 9;120(19):e2221479120. doi: 10.1073/pnas.2221479120. Epub 2023 May 1. Proc Natl Acad Sci U S A. 2023. PMID: 37126702 Free PMC article.
-
Dynamic Games of Social Distancing During an Epidemic: Analysis of Asymmetric Solutions.Dyn Games Appl. 2022;12(1):214-236. doi: 10.1007/s13235-021-00403-1. Epub 2021 Oct 11. Dyn Games Appl. 2022. PMID: 34659872 Free PMC article.
-
Awareness-driven behavior changes can shift the shape of epidemics away from peaks and toward plateaus, shoulders, and oscillations.Proc Natl Acad Sci U S A. 2020 Dec 22;117(51):32764-32771. doi: 10.1073/pnas.2009911117. Epub 2020 Dec 1. Proc Natl Acad Sci U S A. 2020. PMID: 33262277 Free PMC article.
References
-
- Pang X. et al.. Evaluation of control measures implemented in the severe acute respiratory syndrome outbreak in Beijing, 2003. JAMA 290, 3215–3221 (2003). - PubMed
-
- Hethcote H. W. & Yorke J. A. Gonorrhea transmission dynamics and control (Springer Lecture Notes in Biomathematics, 1984).
Publication types
MeSH terms
LinkOut - more resources
Full Text Sources
Other Literature Sources
Molecular Biology Databases

