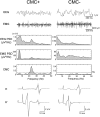
Inhibitory interneuron circuits at cortical and spinal levels are associated with individual differences in corticomuscular coherence during isometric voluntary contraction
- PMID: 28290507
- PMCID: PMC5349562
- DOI: 10.1038/srep44417
Inhibitory interneuron circuits at cortical and spinal levels are associated with individual differences in corticomuscular coherence during isometric voluntary contraction
Abstract
Corticomuscular coherence (CMC) is an oscillatory synchronization of 15-35 Hz (β-band) between electroencephalogram (EEG) of the sensorimotor cortex and electromyogram of contracting muscles. Although we reported that the magnitude of CMC varies among individuals, the physiological mechanisms underlying this variation are still unclear. Here, we aimed to investigate the associations between CMC and intracortical inhibition (ICI) in the primary motor cortex (M1)/recurrent inhibition (RI) in the spinal cord, which probably affect oscillatory neural activities. Firstly, we quantified ICI from changes in motor-evoked potentials induced by paired-pulse transcranial magnetic stimulation in M1 during tonic isometric voluntary contraction of the first dorsal interosseous. ICI showed a significant, negative correlation with the strength of EEG β-oscillation, but not with the magnitude of CMC across individuals. Next, we quantified RI from changes in H-reflexes induced by paired-pulse electrical nerve stimulation to the posterior tibial nerve during isometric contraction of the soleus muscle. We observed a significant, positive correlation between RI and peak CMC across individuals. These results suggest that the local inhibitory interneuron networks in cortical and spinal levels are associated with the oscillatory activity in corticospinal loop.
Conflict of interest statement
The authors declare no competing financial interests.
Figures


Similar articles
-
Electrical stimulation of the common peroneal nerve and its effects on the relationship between corticomuscular coherence and motor control in healthy adults.BMC Neurosci. 2021 Oct 13;22(1):61. doi: 10.1186/s12868-021-00665-w. BMC Neurosci. 2021. PMID: 34645385 Free PMC article.
-
Specific modulation of corticomuscular coherence during submaximal voluntary isometric, shortening and lengthening contractions.Sci Rep. 2021 Mar 18;11(1):6322. doi: 10.1038/s41598-021-85851-w. Sci Rep. 2021. PMID: 33737659 Free PMC article.
-
Between-subject variance in the magnitude of corticomuscular coherence during tonic isometric contraction of the tibialis anterior muscle in healthy young adults.J Neurophysiol. 2011 Sep;106(3):1379-88. doi: 10.1152/jn.00193.2011. Epub 2011 Jun 8. J Neurophysiol. 2011. PMID: 21653712
-
Corticomuscular and intermuscular frequency analysis.Suppl Clin Neurophysiol. 2004;57:570-6. doi: 10.1016/s1567-424x(09)70396-4. Suppl Clin Neurophysiol. 2004. PMID: 16106658 Review. No abstract available.
-
Corticomuscular coherence: a review.J Clin Neurophysiol. 1999 Nov;16(6):501-11. doi: 10.1097/00004691-199911000-00002. J Clin Neurophysiol. 1999. PMID: 10600018 Review.
Cited by
-
Age-specific modulation of intermuscular beta coherence during gait before and after experimentally induced fatigue.Sci Rep. 2020 Sep 28;10(1):15854. doi: 10.1038/s41598-020-72839-1. Sci Rep. 2020. PMID: 32985547 Free PMC article.
-
Electrophysiological Approaches to Understanding Brain-Muscle Interactions During Gait: A Systematic Review.Bioengineering (Basel). 2025 Apr 29;12(5):471. doi: 10.3390/bioengineering12050471. Bioengineering (Basel). 2025. PMID: 40428090 Free PMC article. Review.
-
Combined effect of contraction type and intensity on corticomuscular coherence during isokinetic plantar flexions.Eur J Appl Physiol. 2023 Mar;123(3):609-621. doi: 10.1007/s00421-022-05087-y. Epub 2022 Nov 9. Eur J Appl Physiol. 2023. PMID: 36352055
-
Increased central common drive to ankle plantar flexor and dorsiflexor muscles during visually guided gait.Physiol Rep. 2018 Feb;6(3):e13598. doi: 10.14814/phy2.13598. Physiol Rep. 2018. PMID: 29405634 Free PMC article.
-
Combined Use of EMG and EEG Techniques for Neuromotor Assessment in Rehabilitative Applications: A Systematic Review.Sensors (Basel). 2021 Oct 22;21(21):7014. doi: 10.3390/s21217014. Sensors (Basel). 2021. PMID: 34770320 Free PMC article.
References
-
- Kilner J. M., Fisher R. J. & Lemon R. N. Coupling of oscillatory activity between muscles is strikingly reduced in a deafferented subject compared with normal controls. J. Neurophysiol. 92, 790–796 (2004). - PubMed
-
- Mima T., Steger J., Schulman A. E., Gerloff C. & Hallett M. Electroencephalographic measurement of motor cortex control of muscle activity in humans. Clin. Neurophysiol. 111, 326–337 (2000). - PubMed
-
- Ohara S. et al.. Electrocorticogram-electromyogram coherence during isometric contraction of hand muscle in human. Clin. Neurophysiol. 111, 2014–2024 (2000). - PubMed
Publication types
MeSH terms
LinkOut - more resources
Full Text Sources
Other Literature Sources

