. 2017 Mar 14:7:44482.
doi: 10.1038/srep44482.

Nutritional control of IL-23/Th17-mediated autoimmune disease through HO-1/STAT3 activation

Affiliations

Nutritional control of IL-23/Th17-mediated autoimmune disease through HO-1/STAT3 activation

Jürgen Brück et al. Sci Rep. .

Abstract

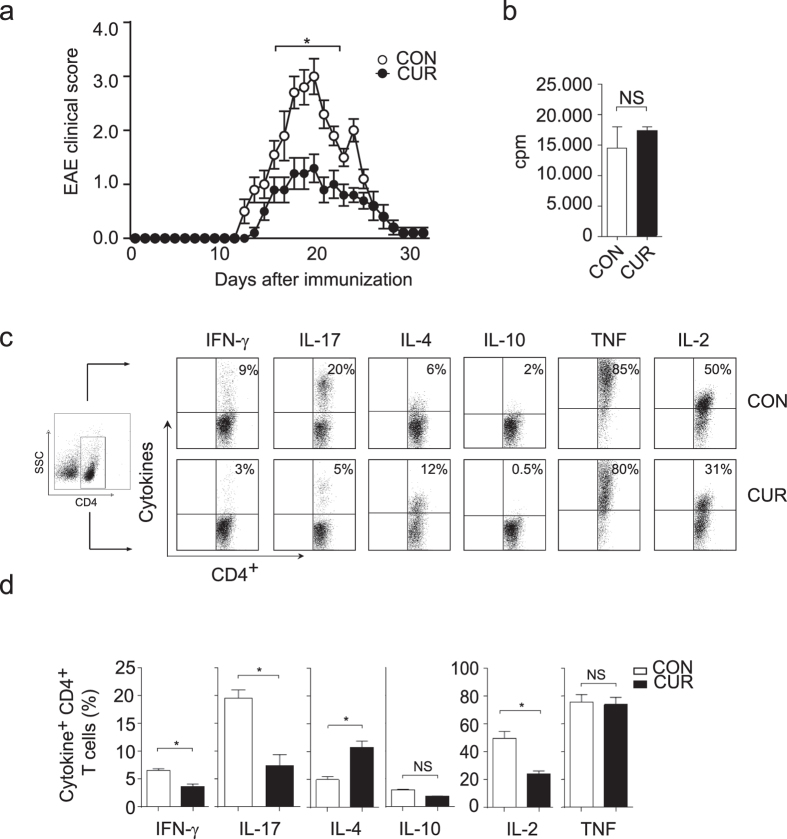
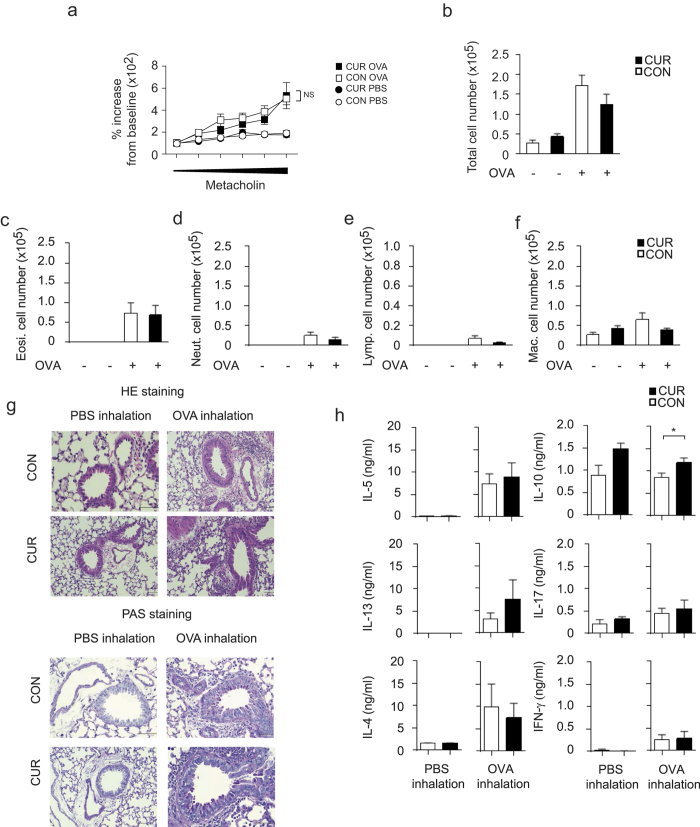
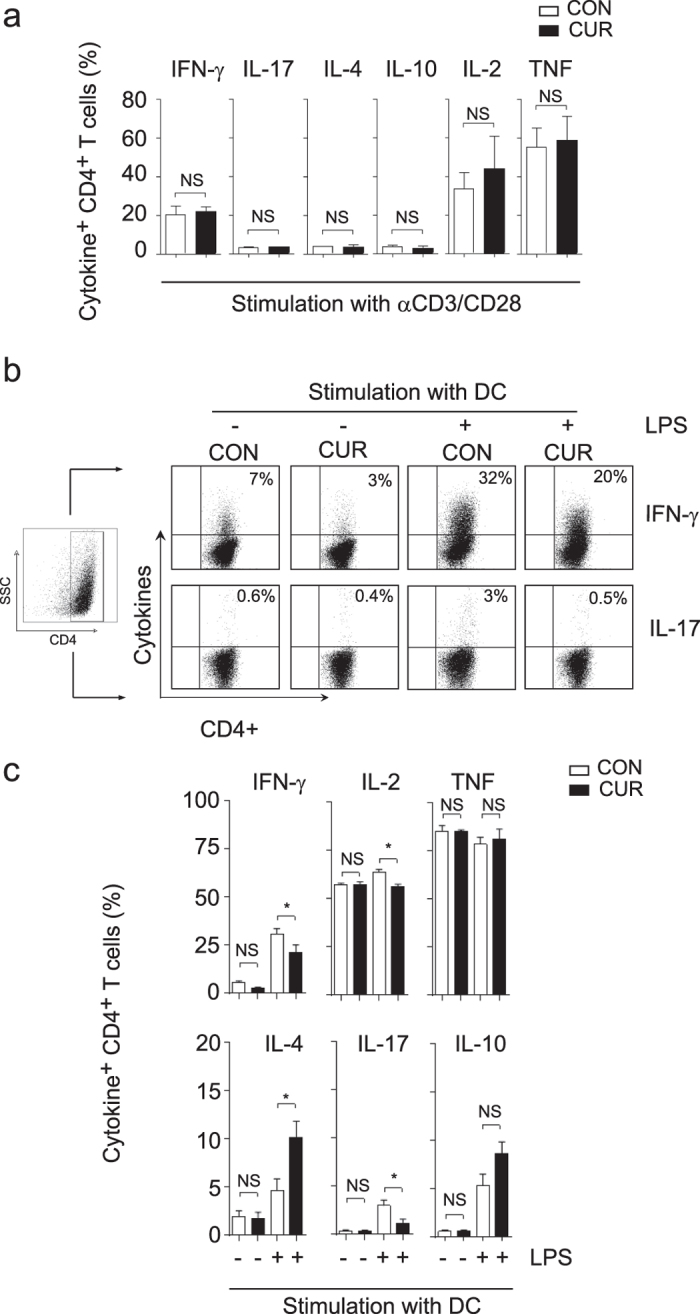
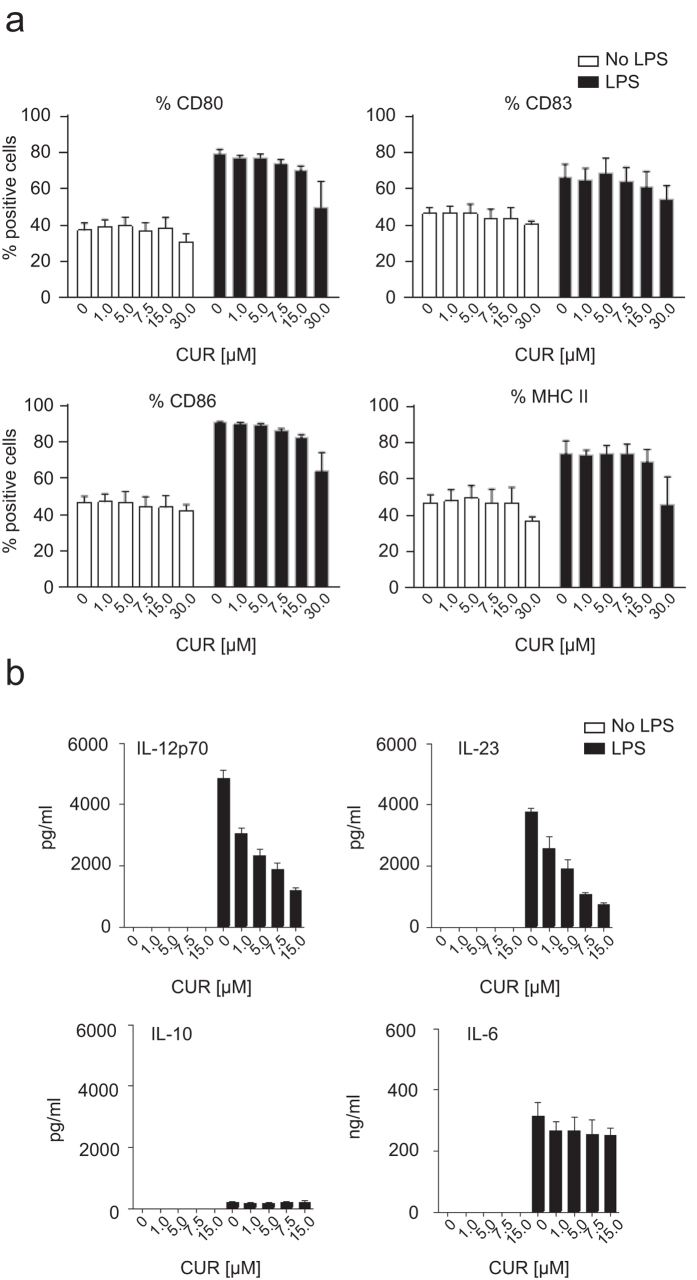
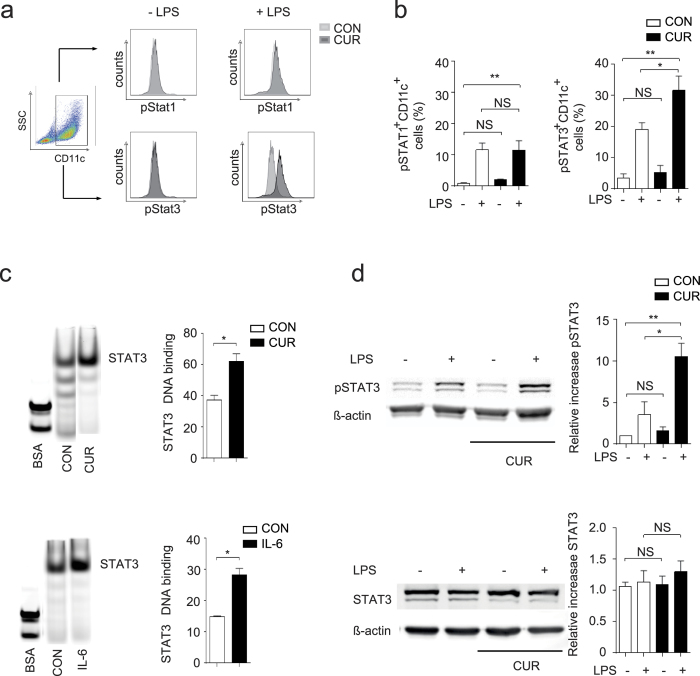
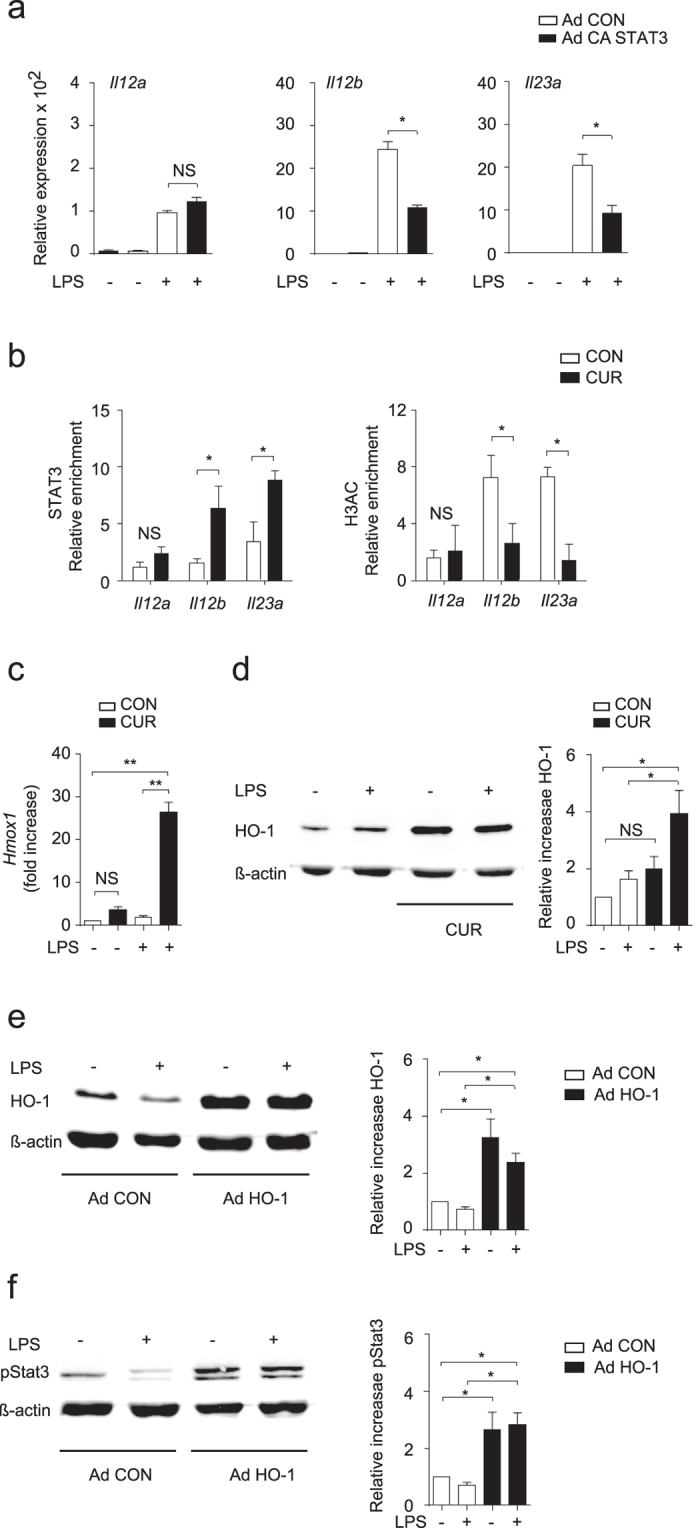
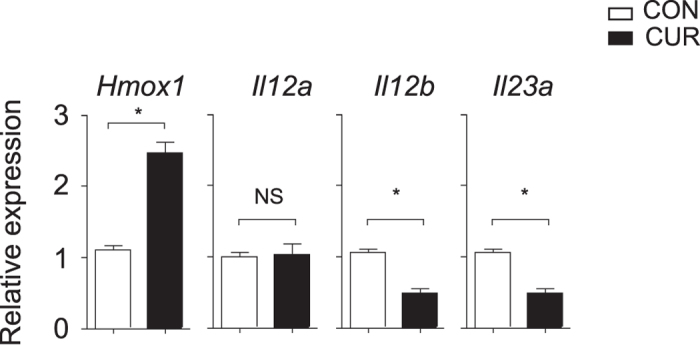
The nutritional curcumin (CUR) is beneficial in cell-mediated autoimmune diseases. The molecular mechanisms underlying this food-mediated silencing of inflammatory immune responses are poorly understood. By investigating antigen-specific immune responses we found that dietary CUR impairs the differentiation of Th1/Th17 cells in vivo during encephalomyelitis and instead promoted Th2 cells. In contrast, feeding CUR had no inhibitory effect on ovalbumin-induced airway inflammation. Mechanistically, we found that CUR induces an anti-inflammatory phenotype in dendritic cells (DC) with enhanced STAT3 phosphorylation and suppressed expression of Il12b and Il23a. On the molecular level CUR readily induced NRF2-sensitive heme oxygenase 1 (HO-1) mRNA and protein in LPS-activated DC. HO-1 enhanced STAT3 phosphorylation, which enriched to Il12b and Il23a loci and negatively regulated their transcription. These findings demonstrate the underlying mechanism through which a nutritional can interfere with the immune response. CUR silences IL-23/Th17-mediated pathology by enhancing HO-1/STAT3 interaction in DC.


Conflict of interest statement

The authors declare no competing financial interests.

Figures

Figure 1
Figure 1. CUR protects mice from severe encephalomyelitis and inhibits IL-17 and IFN-γ production in vivo.
(a) Mice were fed with 2% CUR or control diet (CON), immunized for EAE and followed for disease symptoms. The results show mean EAE score ± SEM from 2 independent experiments with n = 16 mice (*P < 0.05 day 16 to 22; Wilcoxon test). (b) Mice were fed with CUR as in (a) and immunized for EAE. On day 7 after immunization, CD4+ T cells were purified from draining lymph nodes and co-cultured with DC and PLP peptide. T cell proliferation was assessed by [3H] thymidine incorporation. NS: not significant, Mann-Whitney test. (c,d) Mice were treated as in (a). On day seven after immunization draining lymph nodes were isolated to analyze intracellular cytokine production in PMA/ionomycin-stimulated CD4+ T cells. First, a FSC/SSC plot was made and all lymph node cells were gated. The CD4+ T cell population was gated by a SSC/CD4 (left panel) plot and then analyzed for CD4+ T cell-specific cytokine expression. Dot plots from single mice are depicted in (c), pooled data from control mice (CON; n = 5) and CUR-treated mice (CUR; n = 5) are shown in (d). Bars represent the mean ± SEM (*P < 0.05, Mann-Whitney test).
Figure 2
Figure 2. Oral administration of CUR showed little effects on OVA-induced allergic airway inflammation.
(a) AHR was assessed as lung resistance. Mean values (5 to 6 mice per group) are shown with SEM (square symbols represent OVA challenge, circles represent PBS challenge) (bf) The cell number of total mononuclear cells (b), eosinophils (c), neutrophils (d), lymphocytes (e), and macrophages (f) in the BAL fluid are shown. Mean values with SEM (5 to 6 mice per group) are shown. (g) Antigen-induced leukocyte infiltration into the lungs was evaluated by H&E staining (upper panel). Mucus production induced by OVA was examined by histological analysis (PAS staining) (lower panel). (h) The concentration of the indicated cytokines in the BAL fluid were measured by cytometric bead array. Mean values with SEM (5 to 6 mice per group) are shown. (a–f), no significant differences were found between CUR/OVA and CON/OVA; h, *P < 0.05, Mann-Whitney test).
Figure 3
Figure 3. CUR alters the polarization of activated T cells in the presence of DC.
(a) Isolated CD4+ T cells were activated with plate bound anti-CD3 and anti-CD28 Ab and cultivated with DMSO (CON) or curcumin in DMSO (CUR). Cytokine expression was determined after stimulation with PMA/ionomycin by intracellular staining and flow cytometry. Data show mean ± SEM of 4 independent experiments, NS: not significant, Mann-Whitney test. (b and c) DC were treated with DMSO (CON) or curcumin in DMSO (CUR) for 2 hours, loaded with OVA peptide, left untreated or activated with LPS and used for stimulation of OT II CD4+ T cells. On day 7, cells were stimulated with PMA/ionomycin, stained for CD4 and intracellular cytokine production. First, a FSC/SSC plot was made and all leukocytes were gated. The CD4+ T cell population was gated by a SSC/CD4 plot (left panel) and then analyzed for CD4+ T cell-specific cytokine expression. Dot plots from single experiments are depicted in (b), pooled data are shown in (c). Bars represent mean ± SEM of three independent experiments (*P < 0.05; One Way ANOVA, Tukey’s post-hoc test).
Figure 4
Figure 4. Curcumin affects the DC phenotype without interfering with cell maturation or viability and inhibits IL-12 and suppresses IL-23 production in vitro.
(a) DC were treated with DMSO (CON) or increasing doses of curcumin in DMSO (CUR; 1 to 30 μM) for 2 hours before resting in medium alone or activating with LPS. After 18 hours cells were stained for the expression of CD80, CD83, CD86 and MHC II. Flow cytometry data are depicted as mean ± SEM of 3 independent experiments. (b) DC were treated and activated with LPS. Supernatant was collected after 18 hours and analysed for IL-12p70, IL-23, IL-10 and IL-6 secretion by ELISA. The results show mean ± SEM of three biological replicates and represent one out of three independent experiments with similar results.
Figure 5
Figure 5. CUR enhances STAT3 phosphorylation in activated DC.
(a,b) DC were treated with DMSO (CON) or curcumin (CUR) in DMSO (7.5 μM) for 2 hours before activation with LPS for 1 hour. STAT1 and STAT3 phosphorylation was determined by intracellular staining and flow cytometry. First, a FSC/SSC plot was made and all DC were gated. The CD11c+ DC population was gated by a SSC/CD11c plot (left panel) and then analyzed for CD11c+ DC-specific STAT phosphorylation. Histogram plots from single experiments are depicted in (a), pooled data are shown in (b). Bars represent mean ± SEM of three independent experiments (*P < 0.05, **P < 0.01). (c) EMSA analysis with STAT3 promotor oligonucleotides. DC were treated as in (a) or with recombinant IL-6 in medium or medium alone (CON) and then activated with LPS. Nuclei were extracted and mixed with flourochrome labelled STAT3 EMSA probes. Complexes were separated on a TAE-gel and the band intensity was quantified with an OdysseySA Infrared Imaging System. One representative EMSA (left panel) and pooled data from 3 independent experiments (right panel) are shown (mean ± SEM, *P < 0.05; Mann-Whitney test). The samples were run on the same gel, the lanes of interest were cut and re-ordered. (d) DC were treated with DMSO (CON) or CUR in DMSO (CUR) as in (a) before activation with LPS. Expression of pSTAT3 (upper panel) and total STAT3 protein (lower panel) was analyzed by Western blotting. One representative immunoblot and pooled data from 3 independent experiments are shown. The samples for STAT3/β-actin or pSTAT3/β-actin were run on the same gels and the blot images were cropped based on the molecular weight (79/86 kDa for STAT3/pSTAT3 and 43 kDa for β-actin). Bars represent mean ± SEM of three independent experiments (*P < 0.05, **P < 0.01; One Way ANOVA, Tukey’s post-hoc test). The complete EMSA (c) and Western blot (d) figures can be found as Supplementary Figs S7 to S10.
Figure 6
Figure 6. CUR inhibits LPS induced Il23a promotor activity.
(a) Luciferase reporter activity was measured in RAW 264.7 macrophages after 2 hours of incubation or with DMSO (CON) or CUR in DMSO (CUR) and subsequent incubation in the absence or presence of LPS. In addition Luciferase reporter activity was measured in RAW 264.7 macrophages after 1 hour of incubation with recombinant IL-6 (50 ng/ml) or PBS (CON) and subsequent incubation in the absence or presence of LPS. The results show mean ± SEM of quadruplicates. Three independent experiments showed similar results (*P < 0.01; One Way ANOVA, Tukey’s post-hoc test). (b) IL-6 suppresses Il23a and Il12b expression in DC after LPS activation. DC were incubated with PBS (CON) or IL-6 (50 ng/ml) and activated with LPS for 1 hour. Expression of the indicated genes was determined by quantitative RT-PCR. The results show mean ± SEM of 4 independent experiments. Data were normalized to ß-actin and expression before LPS activation was set as 1.0 (*P < 0.05; One Way ANOVA, Tukey’s post-hoc test). (c) Treatment of DC with CUR inhibits IL-12 and suppresses IL-23 production in vitro. DC were incubated with DMSO (CON) or increasing doses of CUR (1 to 30 μM) in DMSO (CUR) for 2 hours and activated with LPS for 1 hour. Expression of the indicated genes was determined by quantitative RT-PCR. The results show mean ± SEM of 4 independent experiments. Data were normalized to ß-actin and expression before LPS activation was set as 1.0.
Figure 7
Figure 7. Overexpression of CA STAT3 selectively inhibits Il12b and Il23a but not Il12a expression.
(a) DCs were infected with control adenovirus (Ad CON) or CA STAT3 (Ad CA STAT3) containing adenovirus and stimulated with LPS for 1 hour. Il12a, Il12b and Il23a mRNA expression was analyzed by quantitative RT-PCR. Data were normalized to ß-actin and expression before LPS activation was set as 1.0. The results show mean ± SEM of 3 independent experiments (*P < 0.01; One Way ANOVA, Tukey’s post-hoc test). (b) ChIP analysis of DC treated with DMSO (CON) or CUR and stimulated with LPS, followed by crosslinking and immunoprecipitation with antibody to STAT3 (left panel) or acetylated histone H3 (H3Ac, right panel). Bound DNA was amplified by quantitative PCR for primer sites in Il12a, Il12b and Il23a promoter regions. Bars represent mean ± SEM of 3 independent experiments (*P < 0.05; One Way ANOVA, Tukey’s post-hoc test). (c) HO-1 is induced by CUR in DC in vitro. DC were treated with DMSO (CON) or CUR in DMSO (CUR) before activation with LPS for 1. Expression of Hmox1 mRNA was determined by quantitative RT-PCR (c) and HO-1 protein was analyzed by Western blotting (d). The results in (c,d) show mean ± SEM of three independent experiments (*P < 0.05, **P < 0.01; One Way ANOVA, Tukey’s post-hoc test), the blot shown in (d) is representative for three independent experiments with similar results. Actin expression served as control. (e,f) Overexpression of HO-1 increased STAT3 phosphorylation in DC. DCs were infected with control adenovirus (Ad CON) or HO-1 containing Ad HO-1 and stimulated with LPS for 1 h. Overexpression of HO-1 protein was analysed by Western blotting (e). The expression of phosphorylated STAT3 (pSTAT3) in DC treated as in (e) was analysed by Western blotting (f). One representative immunoblot and pooled data from 4 independent experiments are shown (mean ± SEM *P < 0.05; One Way ANOVA, Tukey’s post-hoc test). The Western blot samples for HO-1/β-actin or pSTAT3/β-actin were run on the same gels and the blot images were cropped based on the molecular weight (32 kDa for HO-1, 79/86 kDa for pSTAT3 and 43 kDa for β-actin). The complete Western blot figures (df) can be found as Supplementary Figs S11 to S13.
Figure 8
Figure 8. CUR induces Hmox1 and suppresses Il12b and Il23a expression in vivo.
Mice were fed with CUR or a control diet (CON) and immunized for EAE. On day three after immunization draining lymph nodes were isolated and expression of Hmox1, Il12a, Il12b and Il23a was determined by quantitative RT-PCR. Bars represent mean ± SEM of control mice (n = 5) and CUR-fed mice (n = 5). Data were normalized to ß-actin (*P < 0.05, NS: not significant, Mann-Whitney test).

References

    1. De Rosa V. et al.. Nutritional control of immunity: Balancing the metabolic requirements with an appropriate immune function. Semin Immunol 27, 300–309 (2015). - PubMed
    1. Furusawa Y. et al.. Commensal microbe-derived butyrate induces the differentiation of colonic regulatory T cells. Nature 504, 446–450 (2013). - PubMed
    1. Trompette A. et al.. Gut microbiota metabolism of dietary fiber influences allergic airway disease and hematopoiesis. Nat Med 20, 159–166 (2014). - PubMed
    1. Tortorella S. M., Royce S. G., Licciardi P. V. & Karagiannis T. C. Dietary Sulforaphane in Cancer Chemoprevention: The Role of Epigenetic Regulation and HDAC Inhibition. Antioxid Redox Signal 22, 1382–1424 (2015). - PMC - PubMed
    1. Geisel J. et al.. Sulforaphane protects from T cell-mediated autoimmune disease by inhibition of IL-23 and IL-12 in dendritic cells. J Immunol 192, 3530–3539 (2014). - PubMed

Publication types

MeSH terms