. 2017 Mar 14:7:44495.
doi: 10.1038/srep44495.

In situ self-assembly of gold nanoparticles on hydrophilic and hydrophobic substrates for influenza virus-sensing platform

Affiliations

In situ self-assembly of gold nanoparticles on hydrophilic and hydrophobic substrates for influenza virus-sensing platform

Syed Rahin Ahmed et al. Sci Rep. .

Abstract

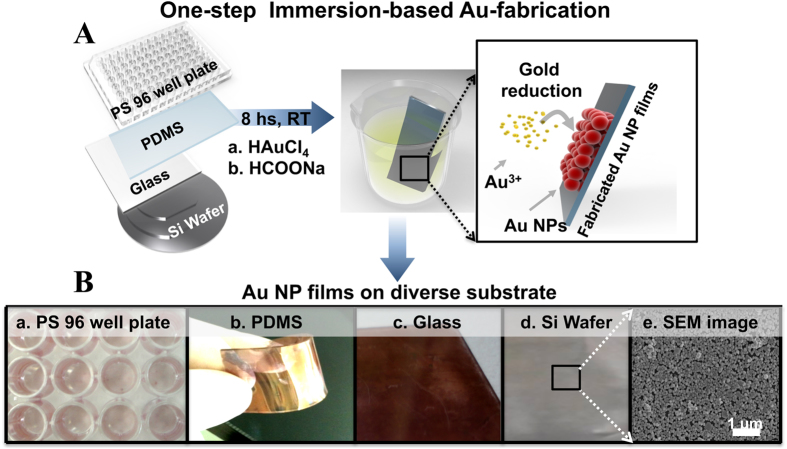
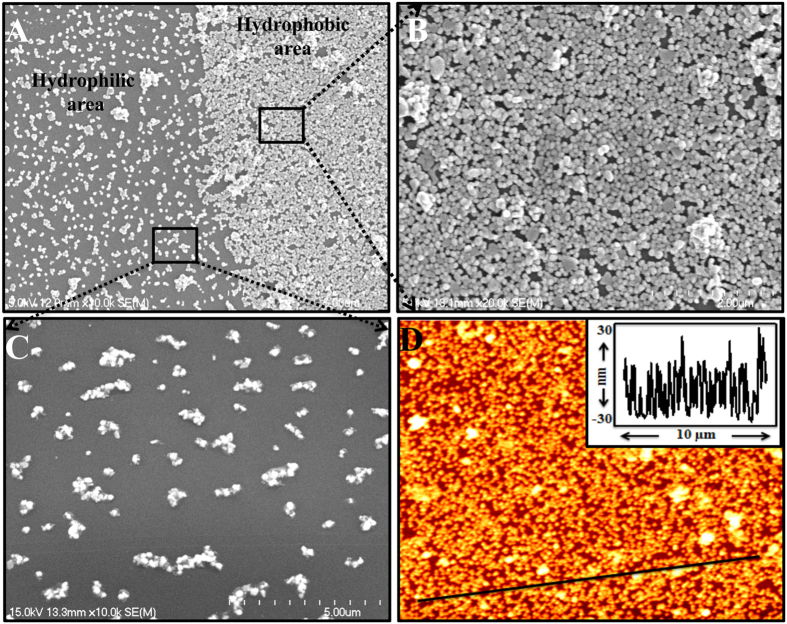
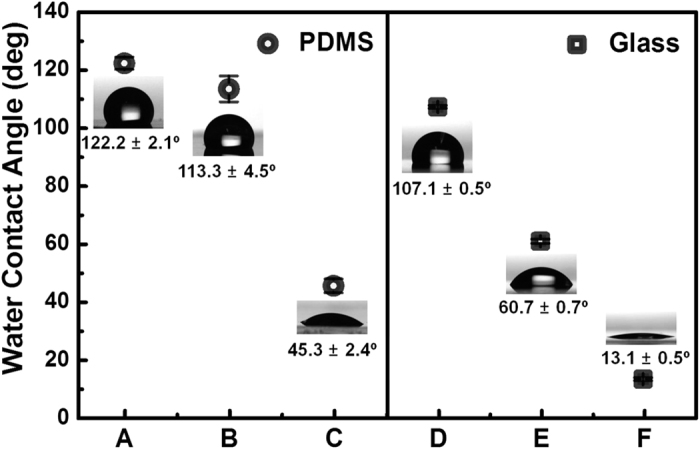
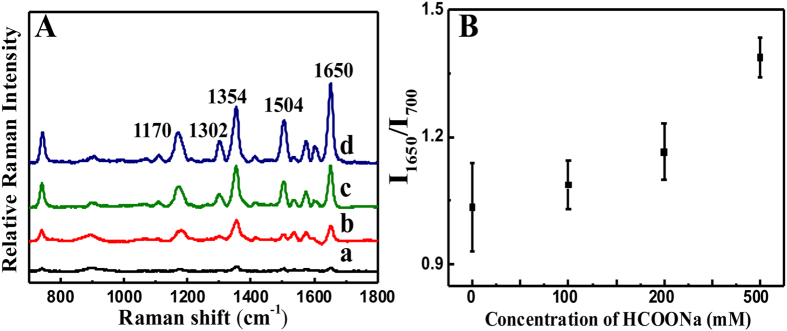
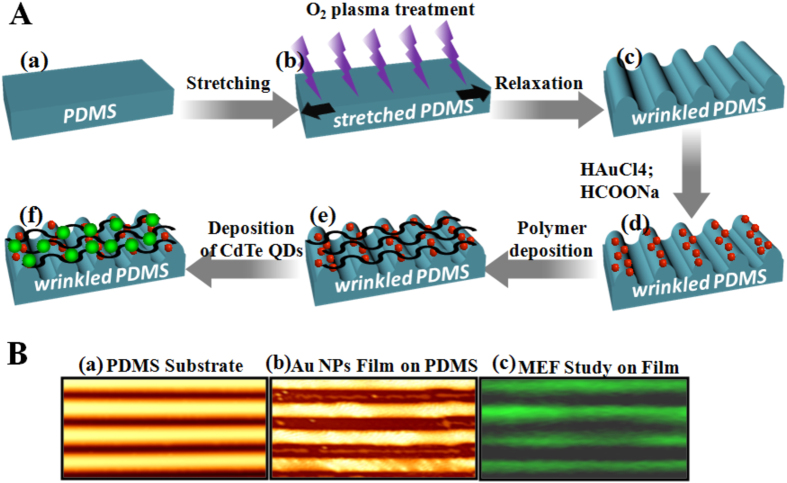
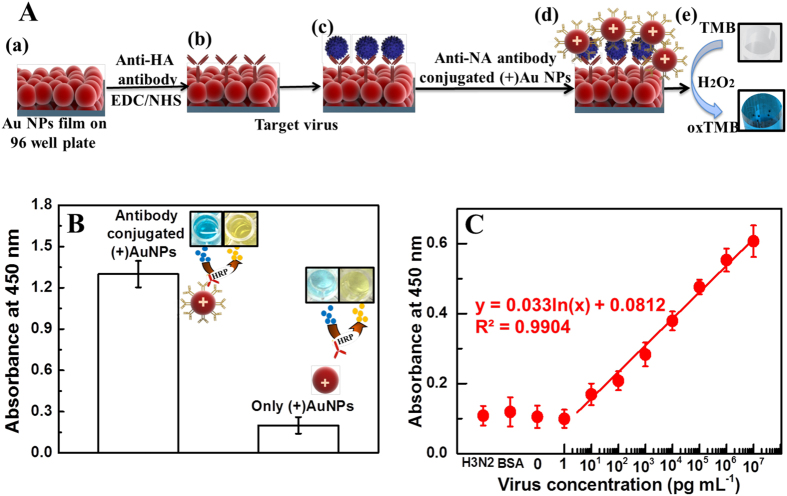
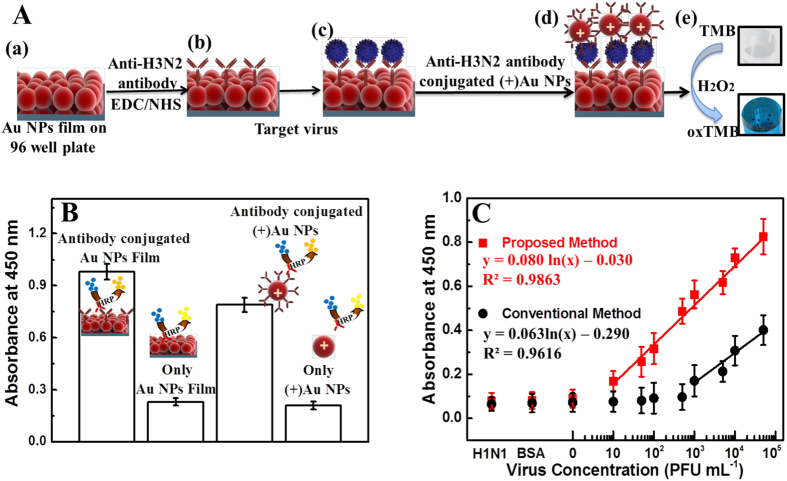
Nanomaterials without chemical linkers or physical interactions that reside on a two-dimensional surface are attractive because of their electronic, optical and catalytic properties. An in situ method has been developed to fabricate gold nanoparticle (Au NP) films on different substrates, regardless of whether they are hydrophilic or hydrophobic surfaces, including glass, 96-well polystyrene plates, and polydimethylsiloxane (PDMS). A mixture of sodium formate (HCOONa) and chloroauric acid (HAuCl4) solution was used to prepare Au NP films at room temperature. An experimental study of the mechanism revealed that film formation is dependent on surface wettability and inter particle attraction. The as-fabricated Au NP films were further applied to the colorimetric detection of influenza virus. The response to the commercial target, New Caledonia/H1N1/1999 influenza virus, was linear in the range from 10 pg/ml to 10 μg/ml and limit of detection was 50.5 pg/ml. In the presence of clinically isolated influenza A virus (H3N2), the optical density of developed color was dependent on the virus concentration (10-50,000 PFU/ml). The limit of detection of this study was 24.3 PFU/ml, a limit 116 times lower than that of conventional ELISA (2824.3 PFU/ml). The sensitivity was also 500 times greater than that of commercial immunochromatography kits.


Conflict of interest statement

The authors declare no competing financial interests.

Figures

Figure 1
Figure 1. Presentation of the single-step, immersion-based fabrication of Au NP films on diverse substrates.
(A) Procedure for the fabrication of the Au NP films. (B) Photographic images of Au NP films deposited on 96-well polystyrene plate (a), PDMS (b), glass (c), silicon wafers (d) and SEM image of densely packed Au NPs on silicon substrate (e).
Figure 2
Figure 2. Microscopic study of the films.
(AC) SEM images of Au nanoparticles (NPs) deposited onto the surface of unmodified and modified PDMS substrates. (D) AFM image of Au NPs deposited onto the hydrophobic PDMS substrate (the inset shows the depth profile along the line).
Figure 3
Figure 3. Mechanistic study of Au NP deposition onto a substrate.
Static water contact angle (θst) values were measured on PDMS and glass with different treatments. Insets: digital images of water droplets (10 μL in volume) placed onto each substrate.
Figure 4
Figure 4. Surface-enhanced Raman scattering of Au NP films deposited onto the PDMS substrate.
(A) SERS profiles of Au nanoparticle films deposited onto PDMS surfaces with (a) 0 mM, (b) 100 mM, (c) 200 mM and (d) 500 mM HCOONa. (B) The calibration curve of the Raman intensity versus HCOONa concentration. Error bars in (B) denote standard deviation (n = 3).
Figure 5
Figure 5. Metal-enhanced fluorescence study on Au NP film.
(A) Schematic presentation of wrinkled PDMS substrate preparation (a–c), Au NP film fabrication on it (d) and CdTe QDs deposition using layer-by-layer method (e,f). (B) AFM image of bare wrinkled PDMS substrate (a), Au NP film formation on wrinkled PDMS substrate (b) and fluorescence microscopy image of Au NP film/QDs hybrid structure (c).
Figure 6
Figure 6. Detection of influenza virus A (New Caledonia/20/1999) (H1N1) on films.
(A) Schematic of virus detection: (a) Au NP films on a 96-well polystyrene plate; (b) anti-HA antibody immobilization on Au NPs through EDC/NHS chemistry. (c) After the NPs were washed three times, the target virus was added and incubated for 30 min at room temperature. (d) The anti-NA antibody-conjugated (+)Au NPs bound the virus through an antibody-antigen reaction, and the unbound (+)Au NPs were washed out. (e) TMB-H2O2 was added, and rapid color changes were observed because of the oxidation of peroxidase substrate TMB (oxTMB). (B) ELISA results of anti-NA antibody binding to the (+)Au NPs through electrostatic interactions. (C) The calibration curve of the absorbance corresponding to the concentration of the influenza virus A (New Caledonia/20/1999) (H1N1). BSA was used as a negative control; H3N2 donates influenza virus A/Yokohama/110/2009 (H3N2) that was used to check specificity of the system. Error bars in (B) and (C) denote standard deviation (n = 3).
Figure 7
Figure 7. Detection of influenza virus A/Yokohama/110/2009 (H3N2) on films.
(A) Schematic of virus detection: (a) Au NP films on a 96-well polystyrene plate; (b) anti-H3N2 antibody immobilization on Au NPs through EDC/NHS chemistry. (c) After the NPs were washed three times, the target virus was added and incubated for 30 min at room temperature. (d) The anti-H3N2 antibody-conjugated (+)Au NPs bound the virus through an antibody-antigen reaction, and the unbound (+)Au NPs were washed out. (e) TMB-H2O2 was added, and rapid color changes were monitored. (B) ELISA results of binding confirmation of anti-H3N2 antibody binding to the Au NP film and (+)Au NPs. (C) The calibration curve of the absorbance corresponding to the concentration of the influenza virus A/Yokohama/110/2009 (H3N2). BSA was used as a negative control; H1N1 donotes influenza virus A (New Caledonia/20/1999) (H1N1) that was used to check specificity of the system. Squares (red line) and circles (black like) denote proposed and conventional ELISA sensing results, respectively. Error bars in (B) and (C) denote standard deviation (n = 3).

References

    1. Ahmed et al.. Metal enhanced fluorescence on nanoporous gold leaf-based assay platform for virus detection. Biosens Bioelectron 58, 33–39 (2014). - PubMed
    1. Ahmed et al.. Photoluminescence enhancement of quantum dots on Ag nanoneedles. Nanoscale Res Lett 7, 438 (2012). - PMC - PubMed
    1. Chuan F. G., Sun T., Cao F., Liu Q. & Ren Z. Metallic nanostructures for light trapping in energy-harvesting devices. Light Sci Appl 3, e161 (2014).
    1. Atwater H. A. & Polman A. Plasmonics for improved photovoltaic devices. Nat Mater 9, 205–213 (2010). - PubMed
    1. Green M. A., Emery K., Hishikawa Y., Warta W. & Dunlop E. D. Solar cell efficiency tables (version 39). Prog Photovolt: Res Appl 20, 12–20 (2012).

Publication types

MeSH terms