. 2017 Mar 14:7:44502.
doi: 10.1038/srep44502.

Mapping cell surface adhesion by rotation tracking and adhesion footprinting

Affiliations

Mapping cell surface adhesion by rotation tracking and adhesion footprinting

Isaac T S Li et al. Sci Rep. .

Abstract

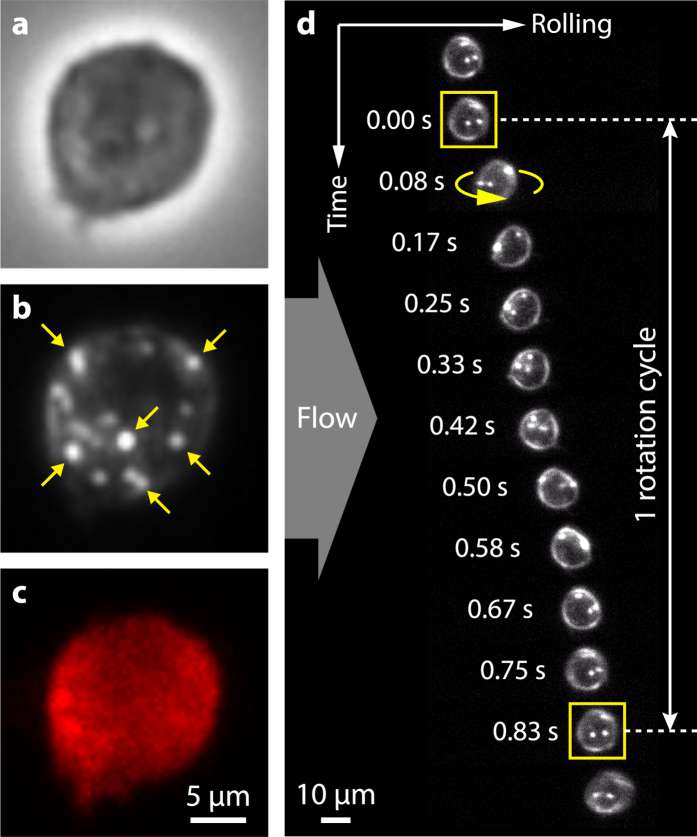
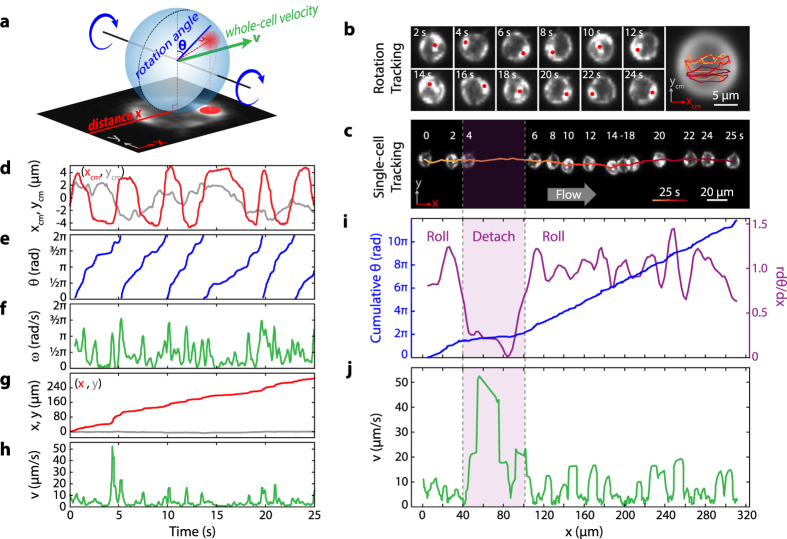
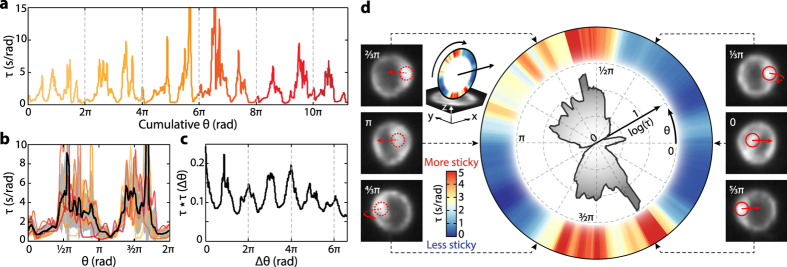
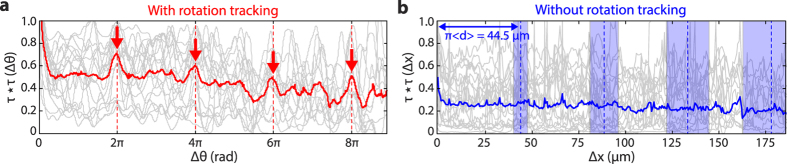
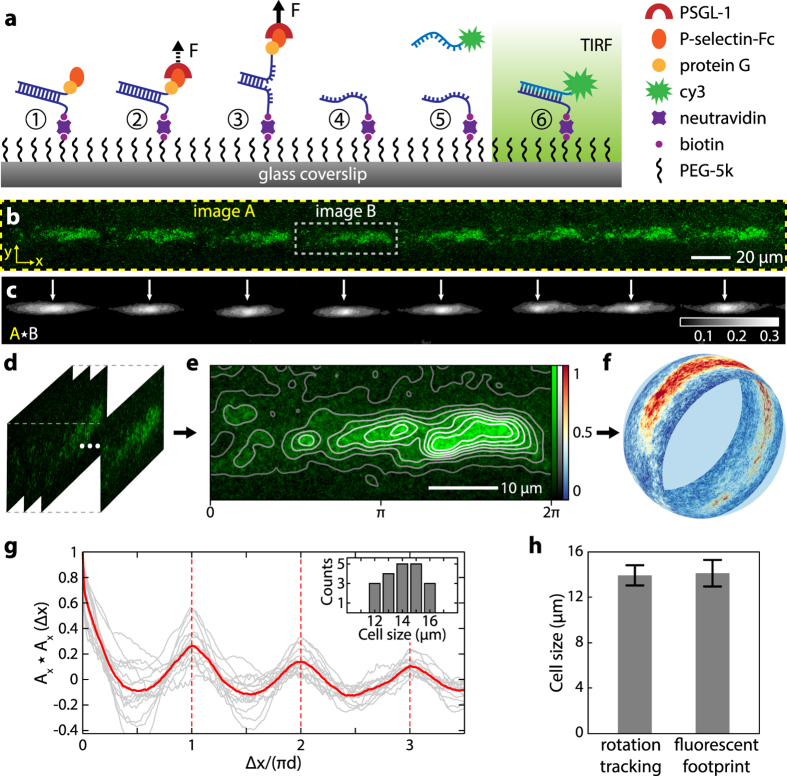
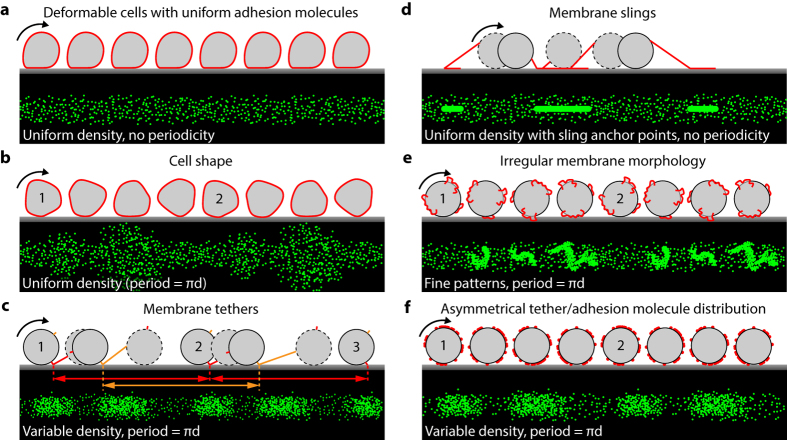
Rolling adhesion, in which cells passively roll along surfaces under shear flow, is a critical process involved in inflammatory responses and cancer metastasis. Surface adhesion properties regulated by adhesion receptors and membrane tethers are critical in understanding cell rolling behavior. Locally, adhesion molecules are distributed at the tips of membrane tethers. However, how functional adhesion properties are globally distributed on the individual cell's surface is unknown. Here, we developed a label-free technique to determine the spatial distribution of adhesive properties on rolling cell surfaces. Using dark-field imaging and particle tracking, we extract the rotational motion of individual rolling cells. The rotational information allows us to construct an adhesion map along the contact circumference of a single cell. To complement this approach, we also developed a fluorescent adhesion footprint assay to record the molecular adhesion events from cell rolling. Applying the combination of the two methods on human promyelocytic leukemia cells, our results surprisingly reveal that adhesion is non-uniformly distributed in patches on the cell surfaces. Our label-free adhesion mapping methods are applicable to the variety of cell types that undergo rolling adhesion and provide a quantitative picture of cell surface adhesion at the functional and molecular level.


Conflict of interest statement

The authors declare no competing financial interests.

Figures

Figure 1
Figure 1. Dark-field microscopy reveals intracellular markers for rotation tracking.
Images of the same cell at 60x magnification by: (a) phase-contrast imaging, (b) dark-field microscopy, with arrows indicating intracellular granules, (c) Cy5 fluorescence imaging of DiD-labeled membranes. (d) Snapshots of a representative rolling cell with time stamps (~0.08 s interval) on a P-selectin coated surface at 25x magnification with flow direction pointing to the right. The rolling cell is under a constant shear stress of 1.2 Pa. Two bright spots inside the cell serve as visual reference markers to track the cell rotation. Initially, the two visible spots are at the bottom surface of the cell. As the cell rolls in the direction of the arrow, the spots rotate to the top surface and back to the bottom again. Two yellow boxes mark ~1 rotation cycle of the cell with the spots returning to the same position.
Figure 2
Figure 2. Single cell translation and rotation tracking.
The rolling cell is under a constant shear stress of 0.12 Pa. (a) Schematic of a rolling cell with bright spot (red) with its projected 2D image on the x-y plane. x is defined along the flow direction. (b) Rotation tracking of a single cell. One (or more) spots from isolated cell images at different time points are identified (red circles) and analyzed to form a single trajectory in the frame of reference of the cell xcm-ycm (right panel). Time is represented by the orange-to-red color gradient. (c) Whole-cell tracking with snapshots of the same cell at 2-s intervals in the lab reference frame x-y. Time is represented by the same color gradient as in (b). (d) Trajectories of the x and y positions of the single spot from (b) in the cell reference frame xcm-ycm. (e) Reconstructed rotation angle θ of the cell. (f) Angular velocity ω as calculated from θ. (g) Trajectories of the x and y positions of the cell centroid from (c). (h) Whole-cell rolling velocity v as a function of time calculated from (g). (i) Cumulative angle θ, the normalized slope rdθ/dx (values around 1 indicate the cell is maintaining traction, values ≤0.5 indicate transient detachment) as functions of rolling distance x corresponding to the images in (c). (j) Cell velocity v as a function of rolling distance. The purple band from 25–63 s indicates the period where the cell transiently detached from the surface and freely floated in the flow before it was recaptured and started rolling again.
Figure 3
Figure 3. Single cell surface adhesion map from rotation tracking of the same cell as Fig. 2.
(a) Dwell time τ as a function of cumulative angle θ of a single cell. Each color corresponds to one 2π rotation period. (b) Dwell time τ from (a) plotted vs. overlapping 2π periods. Same color code as in (a). The black solid line is the average dwell time over the 2π period, and the gray shaded area is the standard deviation. (c) Normalized autocorrelation of τ(θ) in (a). (d) Polar representation of the average dwell time in (b). τ(θ) is represented in two ways: as a line plot on a log scale (black line & shaded gray area), and as a linear color map, with red and blue showing stronger and weaker adhesion, respectively (lower inset). Upper inset illustrates the rolling direction of the polar plot. Six cell images display the average cell image at the particular rotation angle denoted by the dashed black arrows. The bright spot position for this cell is marked by the red circles (solid when the spot is located on the top cell surface, dotted when on the bottom surface) and the rolling direction by the red arrow. There is no correlation between the spot position and adhesion strength. See Supp. Figure S5 for a gallery of cell adhesion map disks.
Figure 4
Figure 4. Asymmetric adhesion across HL-60 population.
(a) Normalized autocorrelations of the dwell time τ(θ) measured as a function of rotation angle θ for many individual cells (N = 30; gray) and their average (red). The average autocorrelation displays peaks at 2nπ (n = 1, 2, 3, 4; red dotted lines and arrows), indicating periodicity in adhesion. (b) Normalized autocorrelations of the dwell time τ(x) measured as a function of position x for the same population of cells (gray) and their average (blue). Without rotation tracking, the autocorrelation fails to display peaks at distances corresponding to multiples of the average circumference π<d>, where <d> is the average cell diameter (blue dotted lines; blue shades indicate the standard deviation due to cell size variations. Both the average and standard deviation are obtained from the average cell diameter, as shown in Fig. 5).
Figure 5
Figure 5. Adhesion asymmetry in rolling cells revealed by molecular adhesion footprinting.
(a) Schematic of the molecular adhesion footprint assay. A surface is coated with P-selectin-functionalised DNA molecular sensors (Step 1). Adhesion of PSGL-1 and application of force (Step 2) unzips the DNA sensor (Step 3), leaving single-stranded (ss)DNA at the adhesion site on the surface (Step 4). Complementary Cy3-labeled DNA flowed into the chamber (Step 5) hybridizes with unzipped sensors (Step 6), marking their location for fluorescence imaging. (b) Representative molecular adhesion footprint of a rolling cell (image A) by Cy3-fluorescence imaging of the surface under TIRF illumination. Cell rolling was performed under a calculated shear stress of 0.12 Pa. (c) Normalized 2D cross-correlation of image A with its subset image (image B). Color map displays the numerical value of the cross-correlation. Arrows indicate the horizontal positions of the local cross-correlation maxima and reveal the periodicity in the adhesion footprint. (d) Images cropped from image A, with width corresponding to the period from the cross-correlation in (c) and centered about the positions of the local cross-correlation maxima. (e) Average of the fluorescence images from (d) over a single-period (0–2π) and a linear contours plot of fluorescence intensity from background (value = 0) to maximum (value = 1). (f) Map of the 2D molecular adhesion footprint from (e) onto the surface of a sphere, representing the contact circumference of the cell. Color scales linearly with fluorescence intensity in (e). (g) Normalized autocorrelations of the fluorescence footprint along the x axis for individual cell tracks (N = 20; gray), and their average (red). The x axis is normalized by the individual cell circumference (πd). Inset shows the histogram of cell diameter. (h) Average cell diameter from video rotation tracking (14.1 ± 1.0 μm) and fluorescent footprint (14.2 ± 1.2 μm) agree with each other.
Figure 6
Figure 6. Cartoon illustrations of fluorescent footprint patterns due to isolated cell shape, receptor, and membrane morphology perturbations.
(a) A cell with uniform receptor distribution deforming due shear flow compression alone would produce uniform tracks without periodic patterns, much like those in a bead rolling assay (Supp. Figure S4A). (b) An undeformable cell with irregular cell shape but uniform surface receptor distribution would leave a periodic footprint that is uniform in intensity but variable in width. (c) Short elastic membrane tether formation does not alter periodicity of rolling as long as the cell maintains traction (the figure exaggerates the length of each tether to illustrate the concept; in reality, the tethers are only a few hundred nm in length). The tip of each tether (red and orange) forms adhesive contacts after each rotation cycle of the cell, regardless of the elastic tether history. (d) Recently discovered membrane ‘slings’ that are thought to stabilise cell rolling under high shear conditions would only produce contact adhesion points at discrete intervals, which is unlikely to produce periodicity, if any, that matches cell circumference. (e) A small fraction of cells that exhibit irregular membrane morphology such as small ruffles would introduce periodicity in the fluorescent footprint as repeating fine patterns that match the shape of the membrane irregularities. (f) Asymmetrically distributed receptors would produce periodic patterns with variable fluorescent intensity.

References

    1. Nourshargh S. & Alon R. Leukocyte Migration into Inflamed Tissues. Immunity 41, 694–707, doi: 10.1016/j.immuni.2014.10.008 (2014). - DOI - PubMed
    1. McEver R. P. & Zhu C. Rolling cell adhesion. Annual review of cell and developmental biology 26, 363–396, doi: 10.1146/annurev.cellbio.042308.113238 (2010). - DOI - PMC - PubMed
    1. Hickey M. J. & Kubes P. Intravascular immunity: the host-pathogen encounter in blood vessels. Nature reviews. Immunology 9, 364–375, doi: 10.1038/nri2532 (2009). - DOI - PubMed
    1. Harris E. S., Weyrich A. S. & Zimmerman G. A. Lessons from rare maladies: leukocyte adhesion deficiency syndromes. Current opinion in hematology 20, 16–25, doi: 10.1097/MOH.0b013e32835a0091 (2013). - DOI - PMC - PubMed
    1. Laubli H. & Borsig L. Selectins promote tumor metastasis. Seminars in cancer biology 20, 169–177, doi: 10.1016/j.semcancer.2010.04.005 (2010). - DOI - PubMed

Publication types

Substances

LinkOut - more resources