. 2017 Mar 14:7:44447.
doi: 10.1038/srep44447.

Abseq: Ultrahigh-throughput single cell protein profiling with droplet microfluidic barcoding

Affiliations

Abseq: Ultrahigh-throughput single cell protein profiling with droplet microfluidic barcoding

Payam Shahi et al. Sci Rep. .

Abstract

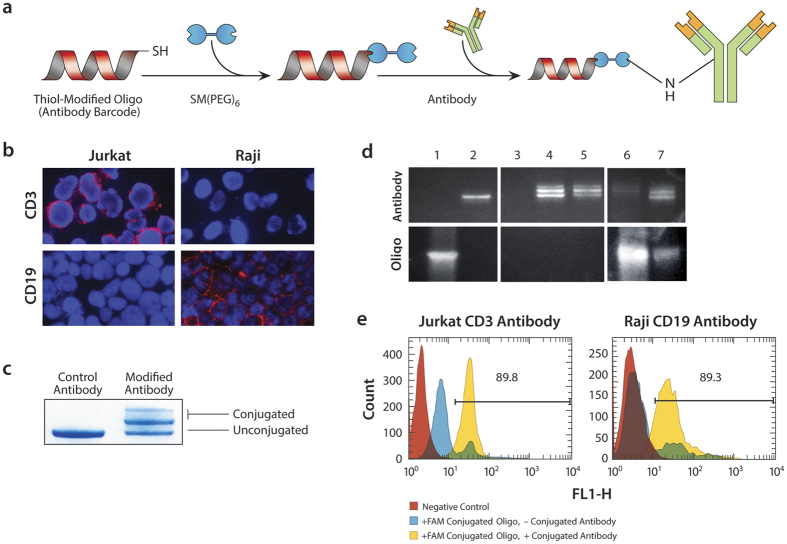
Proteins are the primary effectors of cellular function, including cellular metabolism, structural dynamics, and information processing. However, quantitative characterization of proteins at the single-cell level is challenging due to the tiny amount of protein available. Here, we present Abseq, a method to detect and quantitate proteins in single cells at ultrahigh throughput. Like flow and mass cytometry, Abseq uses specific antibodies to detect epitopes of interest; however, unlike these methods, antibodies are labeled with sequence tags that can be read out with microfluidic barcoding and DNA sequencing. We demonstrate this novel approach by characterizing surface proteins of different cell types at the single-cell level and distinguishing between the cells by their protein expression profiles. DNA-tagged antibodies provide multiple advantages for profiling proteins in single cells, including the ability to amplify low-abundance tags to make them detectable with sequencing, to use molecular indices for quantitative results, and essentially limitless multiplexing.


Conflict of interest statement

The material in this publication is the subject of a patent filing and licensing agreement to Mission Bio, Inc., who is commercializing the technology and of whom ARA is a shareholder.

Figures

Figure 1
Figure 1. Abseq workflow (Figure edited by Sarah Pyle).
Cells are stained with antibodies labeled with unique sequence tags (a). To read out single cell protein expression, a microfluidic workflow conjugates the antibody tag sequences bound to the cell (b) with unique cell barcode sequences (c) via splicing by overlap extension PCR (d). This is performed on >10,000 single cells in parallel and the chimeric products pooled and sequenced. To obtain single cell protein information, the data is sorted by barcode (e). Unique molecular identifiers are included to correct tag counts due to duplicated sequences resulting from PCR bias during sequencing library preparation.
Figure 2
Figure 2. DNA-antibody conjugation.
(a) To enable single cell protein profiling, Abseq uses antibodies labeled with known tag sequences joined via a heterobifunctional crosslinker (Figure edited by Sarah Pyle). (b) To confirm specificity of the antibodies, we label Jurkat and Raji cells, which are binary in their expression of CD3 and CD19, respectively, with the unconjugated antibodies, and obtain the expected labeling pattern. The images are obtained using fluorescently-labeled secondary antibodies (red) and DAPI stain for nuclear DNA (blue). (c) The antibody against CD3 runs as a single band when unconjugated and multiple bands after conjugation when visualized on an SDS-PAGE gel stained with SimplyBlue™ SafeStain; the shift to higher molecular weight indicates successful linkage of sequence tags to antibodies. Unbound tags remain after conjugation and must be removed, as visualized on an SDS-PAGE gel with SYBR DNA stain (d). Column (1) tag oligo only; (2) unconjugated CD3 antibody; (3–5) first, second and third elutions of purified fractions from Nab™ Protein A/G Spin Kit, showing that the second fraction contains most of the conjugated antibody and that oligos are successfully removed (bottom panels); (6) flow-through from column showing captured unbound oligos; (7) conjugated antibody before purification. (e) To confirm that the antibodies retain their affinity after conjugation, we label Jurkat and Raji cells and analyze the results with flow cytometry. We also include fluorescent oligos complimentary to the antibody tag sequences and find that fluorescence of the cells is dependent on presence of the conjugated antibodies.
Figure 3
Figure 3. Bulk validation of SOE-PCR linkage of antibody and cell barcode sequences.
(a) Generation of SOE-PCR product depends on the presence of both antibody tag and cell barcode sequences, as demonstrated on a 1% agarose gel stained with SYBR green. (b) The SOE-PCR product is pure, yielding a sharp peak on a Bioanalyzer at the anticipated molecular weight. (c) For Abseq to provide quantitative results, the number of SOE-PCR products must be in proportion to the number of antibody tag sequences bound to the cell, which we validate by quantitative PCR. When the appropriate antibody is used, amplification occurs early, indicating presence of much SOE-PCR product (green and red). When no or the incorrect antibody is used, amplification occurs late, indicating little SOE-PCR product.
Figure 4
Figure 4. Microfluidic workflow for single cell protein profiling.
(a) A two-inlet flow-focus droplet generator encapsulates single cells with proteinase K lysing agent into 47 μm droplets, while a one-inlet droplet maker encapsulates single barcode randomers into 53 μm droplets. (Scale Bar: 400 μm) (b) After thermal incubation, these droplets are controllably merged with each other and a PCR droplet using a triple-merger device. Cell and barcode droplets are introduced into two inlets, forming an interdigitated stream prior to spacing by oil (orange). One of each droplet is paired with a large PCR droplet formed upstream (green) and the three droplets electrically merged (blue). The droplets are mixed (pink) and split into two (yellow) and then four (purple) portions, followed by off-chip thermal cycling for SOE-PCR of barcodes to antibody tags.
Figure 5
Figure 5. Abseq bioinformatics workflow.
(a) To obtain high quality single cell data, the raw sequence reads are processed through quality filters. While actual barcode groups have many reads, PCR mutation generates spurious groups comprising few reads, as shown by the read count distribution for each group. 95% of reads fall within the large groups, which we select (inset). (b) Contaminating DNA and sequencing error also generate products that do not map to our known antibody tag sequences, as shown by plotting the fraction of reads within a group mapping to the tags versus barcode index, so we select only the groups with >90% correctly-mapping tags (red box). (c) PCR mutation expands a barcode sequence in Hamming space, which we thus discard (fluffy red clusters), while unmutated groups remain well isolated, which we thus keep (green points). A large number of “double positive” clusters are present (d) before removing groups highly connected in Hamming space that disappear when keeping only isolated groups (e). The insets show the GC content of the barcode groups, illustrating that many GC-rich barcode sequences are discarded by Hamming distance clustering, and implying that these groups tend to mutate and amplify faster than less GC-rich sequences. (f) To correct for amplification bias, UMI filtering discards duplicate tag counts evident when plotting the read count histogram for each unique UMI sequence for a specific cell for CD3. (g) UMI correction also reduces the noise of the measured protein profiles. Raw counts and UMI-corrected counts for CD3 tags from individual cells are shown in black and red color, respectively.
Figure 6
Figure 6. Abseq identifies T and B cell populations.
(a) A mixed population of B and T cells are stained with a cocktail of DNA-labeled antibodies targeting CD3 and CD19 surface proteins, and the cells analyzed using Abseq. The results are presented as a scatter plot showing the number of UMI-corrected counts of tags corresponding to each marker, for every cell in the sample. Two major populations are evident that are either strongly CD3-positive (T-cells) or CD19-positive (B-cells). A third, double-positive population is also observed. (b) The proportions of the three populations are in approximate agreement with expectations based on the known proportions with which the cells were mixed and the probability of multiple cell encapsulations.

References

    1. Gutteridge A. & Thornton J. M. Understanding nature’s catalytic toolkit. Trends Biochem. Sci. 30, 622–629 (2005). - PubMed
    1. Randles M. J., Humphries M. J. & Lennon R. Proteomic definitions of basement membrane composition in health and disease. Matrix Biol.doi: 10.1016/j.matbio.2016.08.006 (2016). - DOI - PubMed
    1. Syrovatkina V., Alegre K. O., Dey R. & Huang X.-Y. Regulation, Signaling, and Physiological Functions of G-Proteins. J. Mol. Biol. 428, 3850–3868 (2016). - PMC - PubMed
    1. O’Donnell M. & Li H. The Eukaryotic Replisome Goes Under the Microscope. Curr. Biol. 26, R247–R256 (2016). - PMC - PubMed
    1. Marjanovic N. D. & Weinberg R. A. & Chaffer, C. L. Cell Plasticity and Heterogeneity in Cancer. Clin. Chem. 59, 168–179 (2013). - PMC - PubMed

Publication types