. 2017 Mar 14;12(3):e0173082.
doi: 10.1371/journal.pone.0173082. eCollection 2017.

Transcriptome difference and potential crosstalk between liver and mammary tissue in mid-lactation primiparous dairy cows

Affiliations

Transcriptome difference and potential crosstalk between liver and mammary tissue in mid-lactation primiparous dairy cows

Dengpan Bu et al. PLoS One. .

Abstract

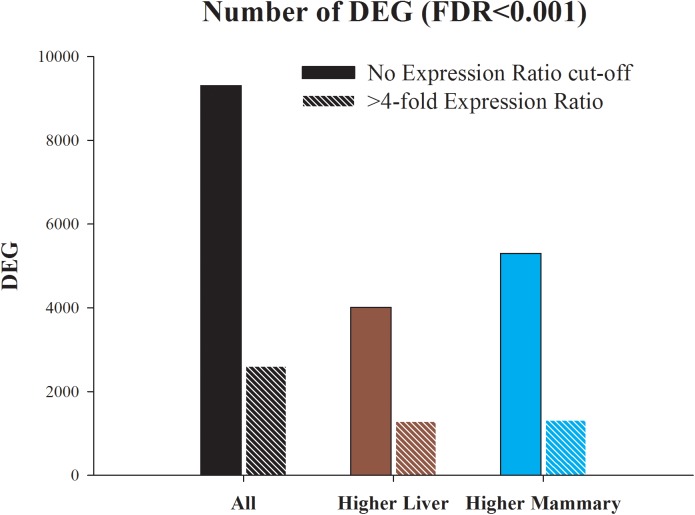
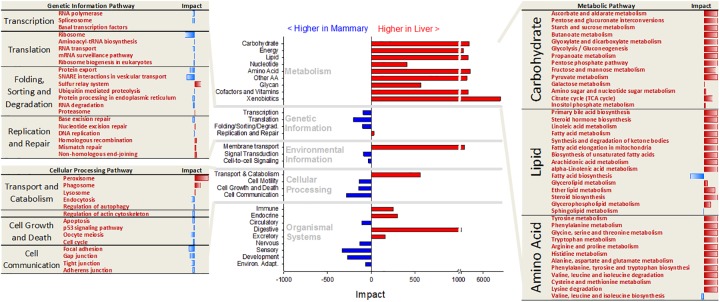
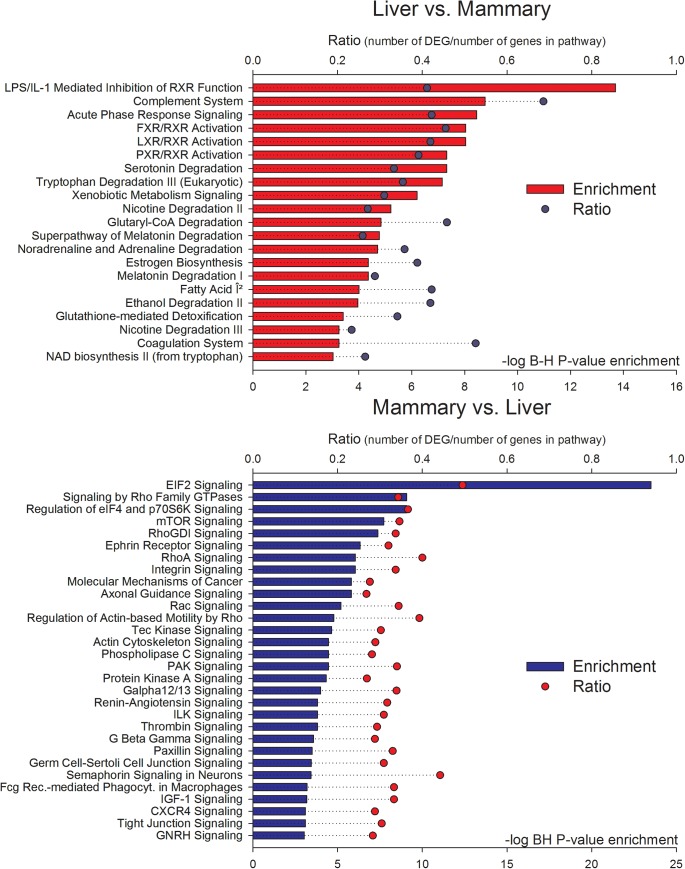
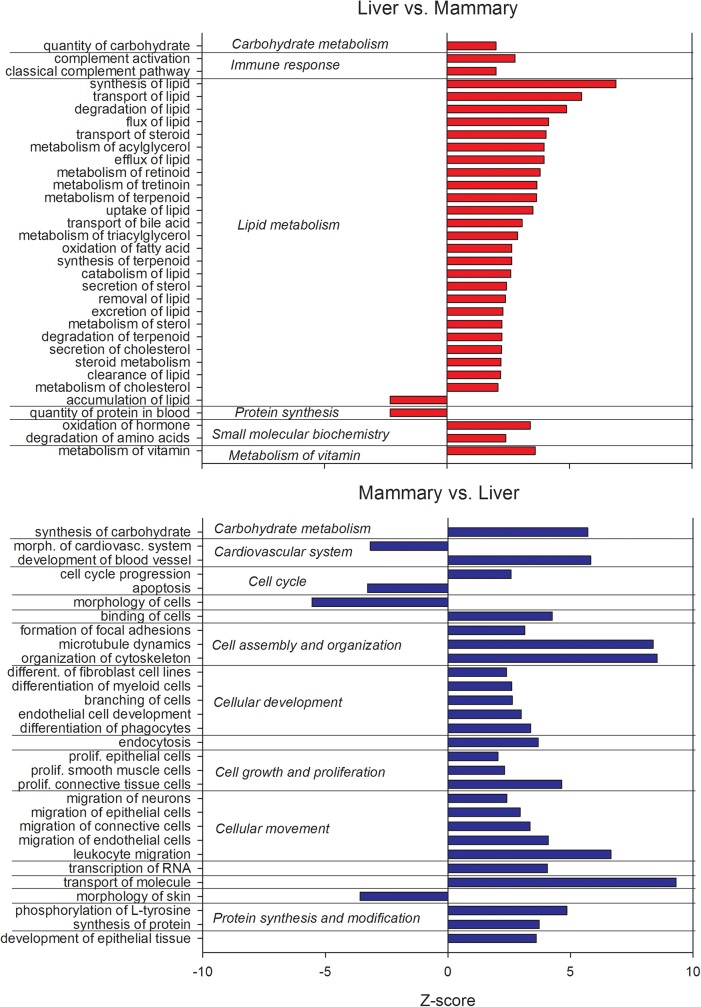
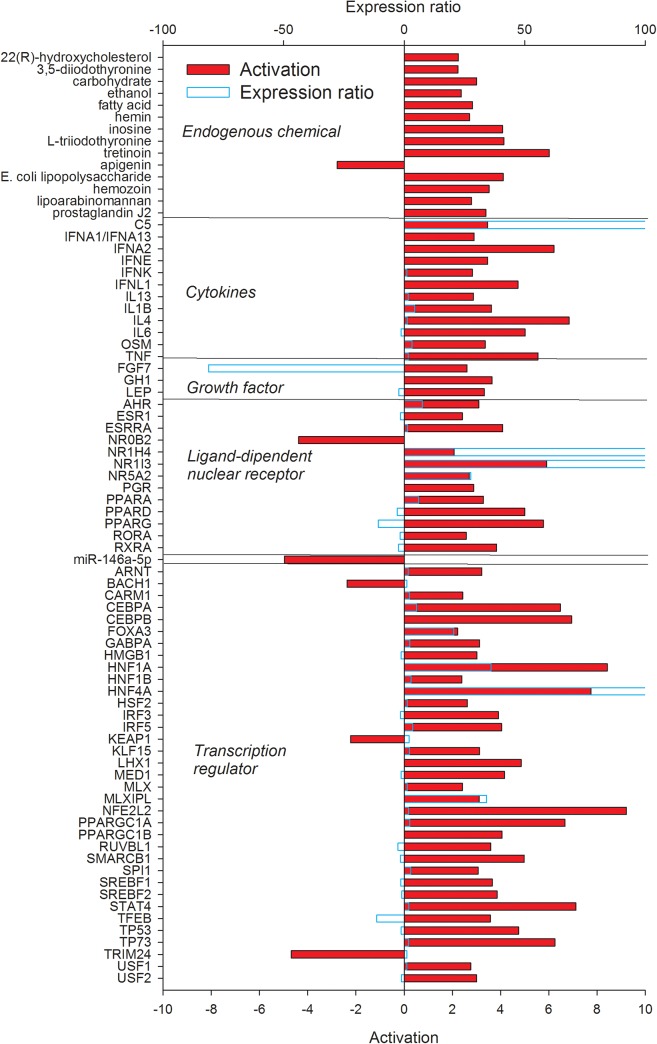
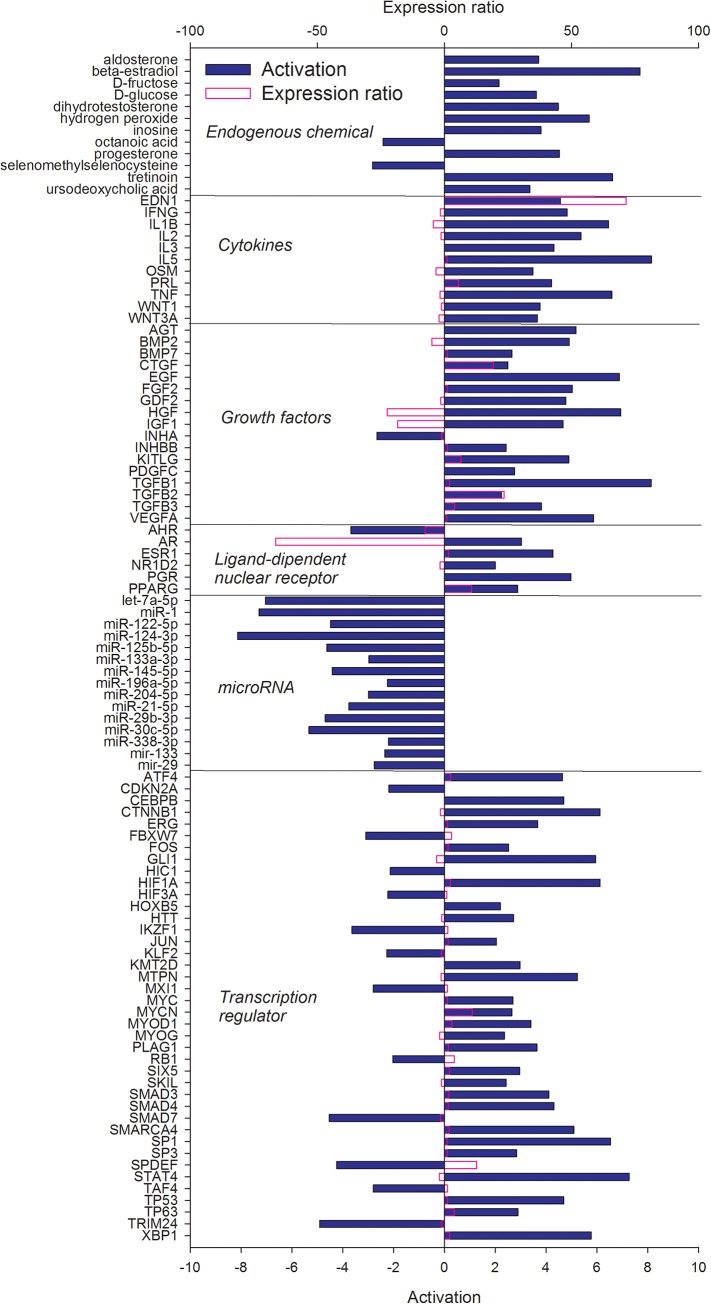
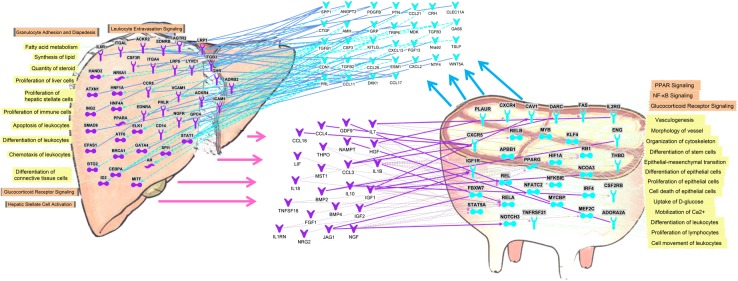
Liver and mammary gland are among the most important organs during lactation in dairy cows. With the purpose of understanding both the different and the complementary roles and the crosstalk of those two organs during lactation, a transcriptome analysis was performed on liver and mammary tissues of 10 primiparous dairy cows in mid-lactation. The analysis was performed using a 4×44K Bovine Agilent microarray chip. The transcriptome difference between the two tissues was analyzed using SAS JMP Genomics using ANOVA with a false discovery rate correction (FDR). The analysis uncovered >9,000 genes differentially expressed (DEG) between the two tissues with a FDR<0.001. The functional analysis of the DEG uncovered a larger metabolic (especially related to lipid) and inflammatory response capacity in liver compared with mammary tissue while the mammary tissue had a larger protein synthesis and secretion, proliferation/differentiation, signaling, and innate immune system capacity compared with the liver. A plethora of endogenous compounds, cytokines, and transcription factors were estimated to control the DEG between the two tissues. Compared with mammary tissue, the liver transcriptome appeared to be under control of a large array of ligand-dependent nuclear receptors and, among endogenous chemical, fatty acids and bacteria-derived compounds. Compared with liver, the transcriptome of the mammary tissue was potentially under control of a large number of growth factors and miRNA. The in silico crosstalk analysis between the two tissues revealed an overall large communication with a reciprocal control of lipid metabolism, innate immune system adaptation, and proliferation/differentiation. In summary the transcriptome analysis confirmed prior known differences between liver and mammary tissue, especially considering the indication of a larger metabolic activity in liver compared with the mammary tissue and the larger protein synthesis, communication, and proliferative capacity in mammary tissue compared with the liver. Relatively novel is the indication by the data that the transcriptome of the liver is highly regulated by dietary and bacteria-related compounds while the mammary transcriptome is more under control of hormones, growth factors, and miRNA. A large crosstalk between the two tissues with a reciprocal control of metabolism and innate immune-adaptation was indicated by the network analysis that allowed uncovering previously unknown crosstalk between liver and mammary tissue for several signaling molecules.


Conflict of interest statement

Competing Interests: The authors have declared that no competing interests exist.

Figures

Fig 1
Fig 1. Number of differentially expressed genes (DEG; Benjamini & Hochberg false discovery rate or FDR≤0.001) between liver and mammary tissue obtained from mid-lactation primiparous dairy cows.
Shown are all DEG, the DEG more expressed in liver compared with mammary tissue, and the DEG more expressed in mammary tissue compared with liver. Presented are also the DEG with >4-fold expression ratio between the two tissues.
Fig 2
Fig 2. Direction of the impact of main sub-categories of KEGG pathways (in the center, with main categories of pathways reported in light grey font) and most impacted pathways in the ‘Genetic Information processing’, ‘Cellular Processing’, and ‘Metabolism’ subcategories of pathways.
For the ‘Metabolism’ subcategories of pathways only the one related to carbohydrate, lipid, and amino acid metabolism are shown (red font = more activated in liver and blue font = more activated in mammary tissue).
Fig 3
Fig 3. Significant (Benjamini & Hochberg FDR [B-H]<0.001 or–log10 B-H>3) enriched pathways in DEG more expressed in liver vs. mammary tissue (top panel with red horizontal bars) and in DEG more expressed in mammary tissue vs. liver (bottom panel in blue horizontal bars).
The round symbols denote the ratio of DEG compared with all genes in the pathway. Results are from Ingenuity Pathway Analysis.
Fig 4
Fig 4. Function with a Z-score ≥2 of DEG more expressed in liver vs. mammary tissue (upper panel) and DEG more expressed in mammary tissue vs. liver (lower panel).
The Z-score is an estimate of the activation or inhibition of the function based on the expression of the DEG related with the function and the known effects of the DEG on the function. Results were obtained using Ingenuity Pathway Analysis.
Fig 5
Fig 5. Upstream regulators (clustered in functional groups) of the DEG more expressed in liver vs. mammary tissue with an estimated Z-score ≥2.
The Z-score is a prediction of the activation status of upstream transcriptional regulators using the molecular network that represent experimentally observed gene expression and are associated with a literature-derived regulation direction which can be either “activating” or “inhibiting” the DEG. Results were obtained using Ingenuity Pathway Analysis. Reported in light blue is the observed expression ratio of upstream regulators.
Fig 6
Fig 6. Upstream regulators (clustered in functional groups) of the DEG more expressed in mammary tissue vs. liver with an estimated Z-score ≥2.
The Z-score is a prediction of the activation states of upstream transcriptional regulators using the molecular network that represent experimentally observed gene expression and are associated with a literature-derived regulation direction which can be either “activating” or “inhibiting” the DEG. Results were obtained using Ingenuity Pathway Analysis. Reported in purple is the observed expression ratio of up-stream regulators.
Fig 7
Fig 7. Potential crosstalk between liver (purple objects, arrows, and lines) and mammary tissue (blue objects, arrows, and lines) obtained by in silico approach via Ingenuity Pathway Analysis.
Genes coding for secreted proteins (i.e., cytokines, growth factors) with higher expression (≥2-fold; FDR<0.001) in liver vs. mammary tissue have the potential to interact with receptors more expressed (≥2-fold; FDR<0.001) in mammary tissue vs. liver and vice versa. The most significant functions (yellow shade) and pathways (orange shade) associated with the receptors are reported.

Similar articles

Cited by

References

    1. Capuco AV, Wood DL, Baldwin R, McLeod K, Paape MJ (2001) Mammary cell number, proliferation, and apoptosis during a bovine lactation: relation to milk production and effect of bST. J Dairy Sci 84, 2177–2187. 10.3168/jds.S0022-0302(01)74664-4 - DOI - PubMed
    1. Schingoethe DJ, Byers FM, Schelling GT (1988) Nutrient needs during critical periods of the life cycle In: Church D, editor. The Ruminant Animal: Digestive, Physiology, and Nutrition. Illinois, USA: Waveland Press Inc. pp. 421–447.
    1. Bionaz M, Loor JJ (2007) Identification of reference genes for quantitative real-time PCR in the bovine mammary gland during the lactation cycle. Physiol Genomics 29, 312–319. 10.1152/physiolgenomics.00223.2006 - DOI - PubMed
    1. Kuhn C, Freyer G, Weikard R, Goldammer T, Schwerin M (1999) Detection of QTL for milk production traits in cattle by application of a specifically developed marker map of BTA6. Anim Genet 30, 333–340. - PubMed
    1. Bergman EN, Brockman RP, Kaufman CF (1974) Glucose-Metabolism in Ruminants—Comparison of Whole-Body Turnover with Production by Gut, Liver, and Kidneys. Federation Proceedings 33, 1849–1854. - PubMed