. 2017 Mar 14;12(3):e0173411.
doi: 10.1371/journal.pone.0173411. eCollection 2017.

The impact of contact patterns on epidemic dynamics

Affiliations

The impact of contact patterns on epidemic dynamics

Qiuju Yin et al. PLoS One. .

Abstract

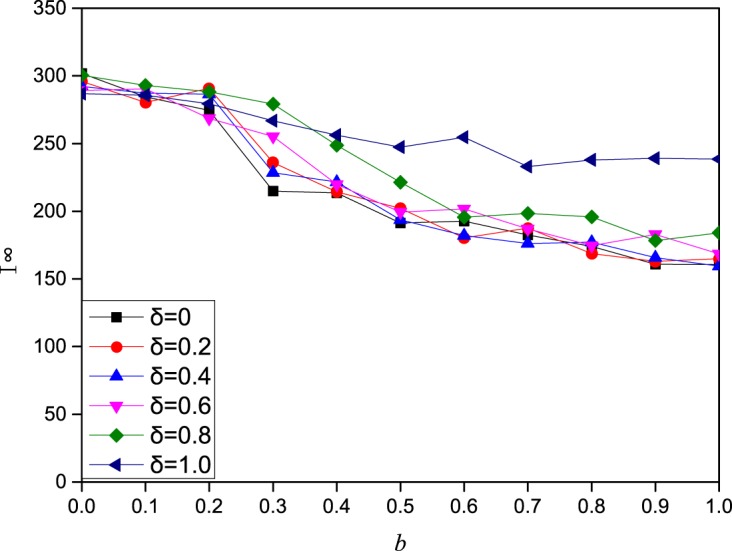
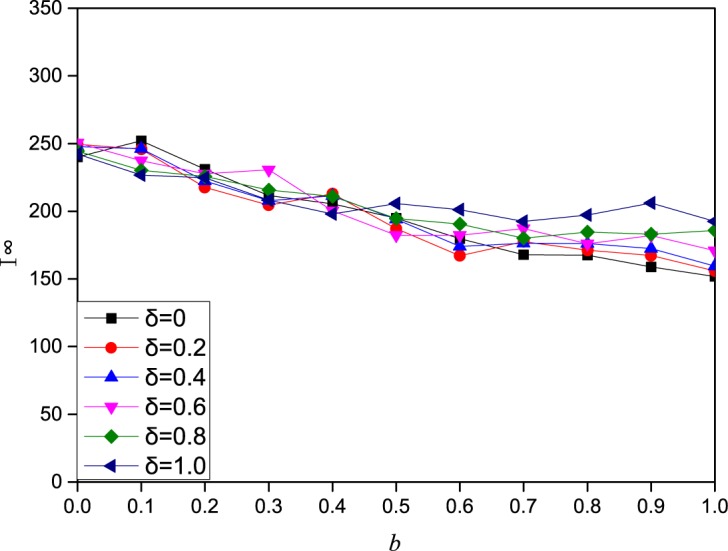
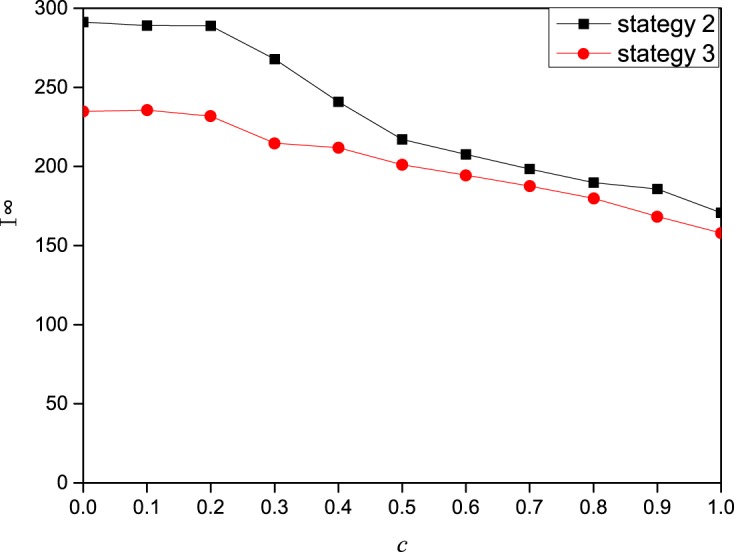
In social networks, individuals have relationships with their neighbor nodes (acquaintance contacts) and also randomly contact other nodes without direct links (stranger contacts). However, these two types of contact patterns are rarely considered together. In this paper, we propose a modified SIS (Susceptible-Infected-Susceptible) model in which a node not only contacts neighbor nodes but also randomly contacts other nodes in the network. We implement the model on a scale-free network and study the influence of different types of contact patterns on epidemic dynamics as well as three possible strategies people adopt when disease outbreaks. The results show that a greater preference for acquaintance contacts makes a disease outbreak less likely. Moreover, the best protective strategy to control the disease is to adjust both the contact number and the contact pattern. In addition, the epidemic is more likely to be controlled when individuals take more information into consideration.


Conflict of interest statement

Competing Interests: The authors have declared that no competing interests exist.

Figures

Fig 1
Fig 1. The effect of contact frequency A0 on the prevalence and threshold of epidemic.
In each of the 6 panels, I(the final epidemic prevalence) as a function of the effective spreading rate λ on a scale-free network of 2000 nodes with degree distribution p(k) ∼ k−2.35. In each subpanel, there are three color lines, the black, red and blue curves represent contact number A0 = 4,5,6, respectively.
Fig 2
Fig 2. The effect of acquaintance contacts ratio μ on the prevalence and threshold of epidemic.
In each of the 3 panels, I(the final epidemic prevalence) as a function of the effective spreading rate λ on a scale-free network of 2000 nodes with degree distribution p(k) ∼ k−2.35. In each subpanel, there are 6 color lines, that represent different acquaintance contacts ratios μ = 0, 0.2, 0.4, 0.6, 0.8, and 1.
Fig 3
Fig 3. The effect of three strategies on the epidemic dynamics.
In each of the 3 panels, I(the final epidemic prevalence) as a function of the effective spreading rate λ on a scale-free network of 2000 nodes with degree distribution p(k) ∼ k−2.35. In each subpanel, there are three color lines: the black, red and blue line, represent strategy 1 without any contact behavior adjustment, strategy 2 (adjustment of contact number) and strategy 3 (adjustment of both contact number and contact patterns), respectively. The other parameters are set to: A0 = 5,μ = 0.6,a = 0.2,b = 0.2,c = 0.2,δ = 0.5 in the panel 3–1, A0 = 5,μ = 0.6,a = 0.5,b = 0.2,c = 0.2,δ = 0.5 in the panel 3–2, A0 = 5,μ = 0.6,a = 1,b = 0.2,c = 0.2,δ = 0.5 in the panel 3–3.
Fig 4
Fig 4. The effect of the contact information influencing factor a on the epidemic transmission dynamics.
In this figure, I (the final epidemic prevalence) as a function of the contact information influencing factor a on a scale-free network of 2000 nodes with degree distribution p(k) ∼ k−2.35. The other parameters are set to A0 = 5,β = 0.3,γ = 1,μ = 0.6,b = 0.2,c = 0.2,δ = 0.5.
Fig 5
Fig 5. The effect of the local information influencing factor b on the epidemic spreading dynamics under strategy 2.
In this figure, I(final prevalence) as a function of the local information influencing factor b under strategy 2 on a scale-free network of 2000 nodes with degree distribution p(k) ∼ k−2.35. The other parameters are set to A0 = 5,β = 0.3,γ = 1, μ = 0.6,a = 0.2,c = 0.2,δ = 0.5.
Fig 6
Fig 6. The effect of the local information influencing factor of on the epidemic spreading dynamics under strategy 3.
In this figure, I (final prevalence) as a function of the local information influencing factor b under strategy 3 on a scale-free network of 2000 nodes with degree distribution p(k) ∼ k−2.35. The other parameters are set to A0 = 5,β = 0.3,γ = 1, μ = 0.6,a = 0.2,c = 0.2,δ = 0.5.
Fig 7
Fig 7. The effect of the global information influencing factor c on the epidemic spreading dynamics.
In this figure, I (the final epidemic prevalence) as a function of the global information influencing factor c on a scale-free network of 2000 nodes with degree distribution p(k) ∼ k−2.35. The other parameters are set to A0 = 5,β = 0.3,γ = 1, μ = 0.6,a = 0.2,b = 0.2,δ = 0.5.

References

    1. Wallinga J, Edmunds WJ, Kretzschmar M. Perspective: human contact patterns and the spread of airborne infectious diseases. Trends in Microbiology. 1999;7(7):372–377. - PubMed
    1. May RM, Lloyd AL. Infection dynamics on scale-free networks. Phys Rev E. 2001;64(6):116–126. - PubMed
    1. Kermack WO, Mckendrick AG. A Contribution to the Mathematical Theory of Epidemics. Royal Society of London Proceedings. 1927;115(772):700–721.
    1. Zhang J, Jin Z, Sun GQ, Zhou T, Ruan S. Analysis of Rabies in China: Transmission Dynamics and Control. Plos One. 2011;6(7): e20891 10.1371/journal.pone.0020891 - DOI - PMC - PubMed
    1. Zou L, Zhang W. Age-Structured Model for the Transmission Dynamics of Hepatitis B. SIAM Journal on Applied Mathematics. 2010;70(8):3121–3139.

LinkOut - more resources