. 2017 Mar 14;12(3):e0173908.
doi: 10.1371/journal.pone.0173908. eCollection 2017.

Purification of cone outer segment for proteomic analysis on its membrane proteins in carp retina

Affiliations

Purification of cone outer segment for proteomic analysis on its membrane proteins in carp retina

Takashi Fukagawa et al. PLoS One. .

Abstract

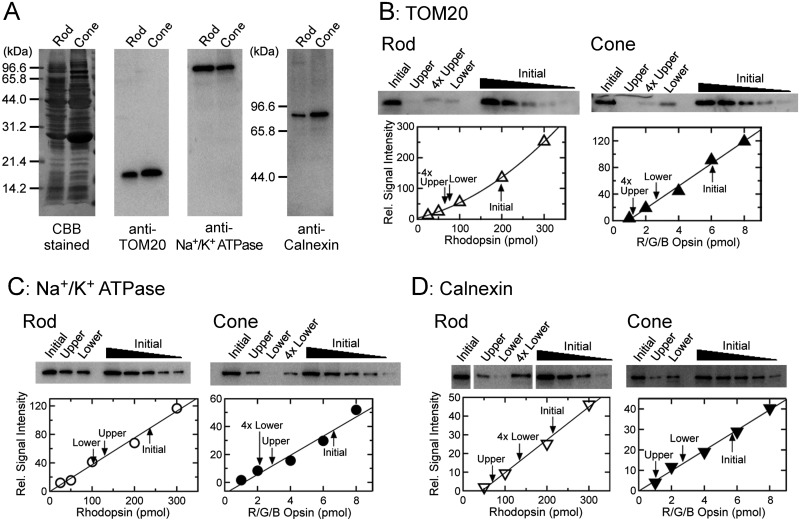
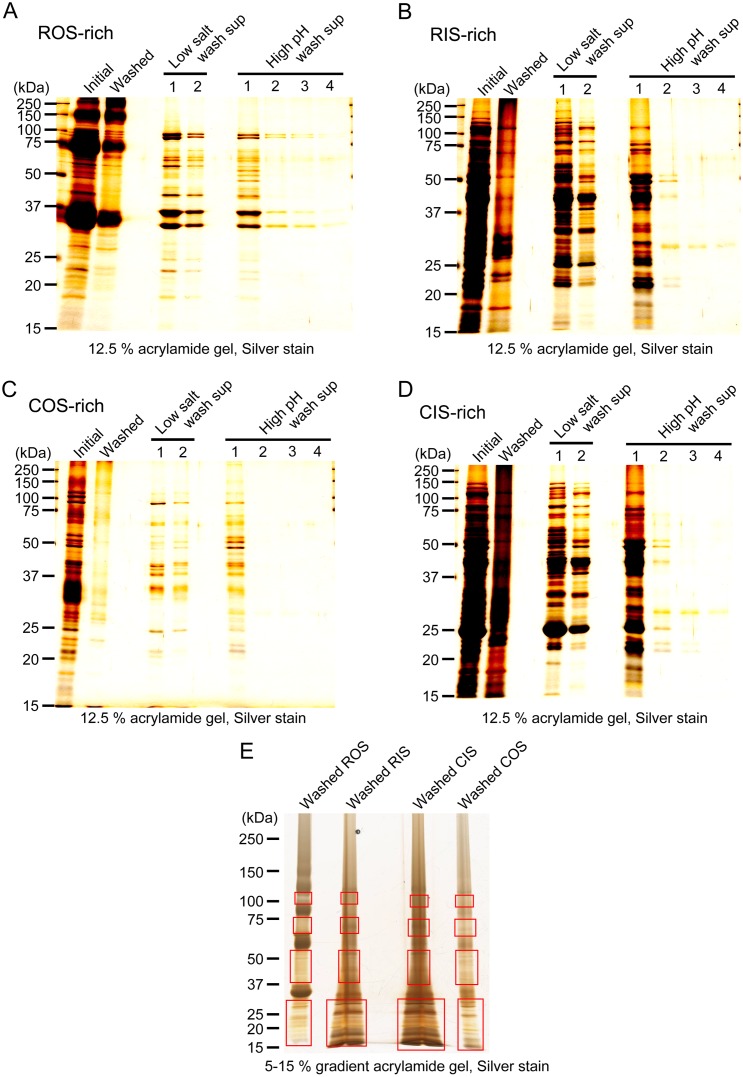
Rods and cones are both photoreceptors in the retina, but they are different in many aspects including the light response characteristics and, for example, cell morphology and metabolism. These differences would be caused by differences in proteins expressed in rods and cones. To understand the molecular bases of these differences between rods and cones, one of the ways is to compare proteins expressed in rods and cones, and to find those expressed specifically or dominantly. In the present study, we are interested in proteins in the outer segment (OS), the site responsible for generation of rod- or cone-characteristic light responses and also the site showing different morphology between rods and cones. For this, we established a method to purify the OS and the inner segment (IS) of rods and also of cones from purified carp rods and cones, respectively, using sucrose density gradient. In particular, we were interested in proteins tightly bound to the membranes of cone OS. To identify these proteins, we analyzed proteins in some selected regions of an SDS-gel of washed membranes of the OS and the IS obtained from both rods and cones, with Liquid Chromatography-tandem Mass Spectrometry (LC-MS/MS) using a protein database constructed from carp retina. By comparing the lists of the proteins found in the OS and the IS of both rods and cones, we found some proteins present in cone OS membranes specifically or dominantly, in addition to the proteins already known to be present specifically in cone OS.


Conflict of interest statement

Competing Interests: The authors have declared that no competing interests exist.

Figures

Fig 1
Fig 1. Purification of OS and IS membranes from purified rods and cones.
Differential interference contrast microscopic (DIC) images of the cell fractions in each step of the purification are shown. Purified carp rods (A) and cones (B) were passed through a 27-gauge needle to dissociate the OS from the IS, and the resultant broken rods (C) and cones (D) were layered on a sucrose density gradient made in a test tube (drawings in the left of E/G and F/H) to centrifuge. The number in the drawings shows the density of sucrose (%, w/v). Separated membranes at upper (E, F) and lower (G, H) interfaces were collected. Scale bar, 20 μm throughout.
Fig 2
Fig 2. Quantification of visual pigments.
Quantity of visual pigments was measured spectrophotometically in three types of rod (A) and cone (B) preparations: membranes from purified cells as initial materials (Initial), membranes in the upper (Upper fraction) and lower (Lower fraction) fraction. (A) Rhodopsin content was measured in the initial rod membranes (left panels), in the upper and lower fraction (middle and right panels, respectively), all obtained from the same number of cells and suspended in the same volume of Ringer's solution. In each of upper panels, curve 1 (black) shows the absorption spectrum before bleach, and curve 2 (blue) shows the spectrum after complete bleach of rhodopsin with illumination of >440 nm light. Curve 2 was subtracted from curve 1 in each of the upper panel to obtain a difference spectrum, which is shown in the corresponding lower panel. From positive absorption by rhodopsin (λmax = 522 nm), relative rhodopsin content was determined. (B) Contents of red-, green-, and blue-sensitive pigments were measured in the initial purified cone membranes (left panels), in the upper and lower faction ((middle and right panels, respectively). In each of upper panels, curve 1 (black) shows absorption spectrum before bleach. Red-sensitive pigment was first bleached with >675 nm light (curve 2), and then green-sensitive pigment with >600 nm light (curve 3) and finally blue-sensitive pigment with >440 nm light (curve 4). Curve 2 was subtracted from curve 1 to obtain a difference spectrum of red-sensitive pigment, which is shown in the corresponding lower panel (red curve 1', λmax = 622 nm). Similarly, difference spectra were obtained for green-sensitive pigment (green curve 2', i.e., curve 2 –curve 3; λmax = 535 nm) and for blue-sensitive pigment (blue curve 3', i.e., curve 3 –curve 4; λmax = 460 nm) to determine the relative contents of these pigments.
Fig 3
Fig 3. Quantification of F1 ATPase β subunit.
Quantities of F1 ATPase β subunit were determined by SDS-PAGE in four rod (A) and four cone (B) membrane preparations. (A) Rod membranes as initial materials (Initial), and rod upper and rod lower fractions (Upper and Lower, respectively) were subjected to SDS-PAGE. The gels were stained with a fluorescent dye, Oriole. In the lane labeled as 4×Upper, 4 times volume of the upper fraction was applied to quantify the amount of F1 ATPase β subunit precisely. Arrowheads indicate the monomer, dimer and tetramer bands of rhodopsin, and arrows indicate the band of F1 ATPase β subunit. (B) Similar SDS-PAGE pattern using four cone membrane preparations. (C) An example of quantification of F1 ATPase β subunit with Oriole staining in four rod membrane preparations. A calibration curve was obtained with Oriole staining using known amounts of BSA (open rectangles and filled line), which was performed in parallel with SDS-PAGE of the rod membrane preparations. From the signal intensity of F1 ATPase β subunit in (A), the amount of F1 ATPase β subunit was quantified in four rod membrane preparations using the calibration curve (downward arrows). Note that F1 ATPase β subunit was not detected in upper fractions in (A). (D) Similar quantification in four cone membrane preparations.
Fig 4
Fig 4. Estimation of separation of OS and IS membranes using TOM20, Na+/K+ ATPase α subunit and calnexin as marker proteins.
(A) Specificity of antibodies used to detect TOM20, Na+/K+ ATPase α subunit and that of anti-calnexin antiserum. Purified rod membranes containing 200 pmol of rhodopsin and cone membranes containing 6 pmol of cone total pigments were subjected to SDS-PAGE and were stained with Coomassie Brilliant Blue (left panel) or probed with antibodies or antiserum against each protein (right three panels). (B-D) Quantitative immunoblot analyses of TOM20 (B), Na+/K+ ATPase α subunit (C) and calnexin (D). In the upper panels in each of (B)—(D), purified rod membranes containing 200 pmol of rhodopsin or purified cone membranes containing 6 pmol of total cone pigments (Initial), upper and lower membrane fractions obtained from the same number of the purified cells (Upper and Lower, respectively), and a diluted series of initial rod and cone membranes were subjected to SDS-PAGE. These membranes were probed with antibodies or antiserum against each marker protein. To detect the amounts of target proteins precisely, 4 times volume of samples were applied when necessary (4×). The amount of a target protein in each of the membranes was determined with a calibration line obtained from immunoblot signals obtained in a diluted series of initial rod or cone membranes. In the lower panels in each of (B)—(D), examples of quantification are shown. The quantity of a target protein in each fraction is indicated by an arrow in lower panels. With this estimation, one can determine how much % of the target protein is present in each of the membranes as compared with the amount in the initial rod or cone membranes of the same cell number.
Fig 5
Fig 5. Preparation of washed membranes for LC-MS/MS.
Membranes in ROS-rich (A), RIS-rich (B), COS-rich (C) and CIS-rich (D) fractions were intensively washed with a low salt buffer and a high pH buffer to eliminate soluble and peripheral membrane proteins as much as possible. In (A)—(D), SDS-PAGE patterns of the membranes prepared from initial membranes (Initial), the membranes finally obtained after intensive washes (Washed), and supernatants obtained during washes (Low salt wash sup 1–2 and High pH wash sup 1–4) are shown for membranes prepared from each fraction. In (E), an example of a gel subjected to LC-MS/MS analysis is shown. Washed membranes obtained from ROS-, RIS-, COS-, and CIS-rich fractions were subjected to SDS-PAGE, and boxed areas of each lane were cut out of the gel and subjected to in gel digestion for LC-MS/MS analysis. Membranes used for SDS-PAGE in each of the lane in (E) were obtained from 106 rods (Washed ROS), 4.7 × 10⁵ rods (Washed RIS), 1.2 × 10⁵ cones (Washed CIS) and 2.5 × 10⁴ cones (Washed COS).
Fig 6
Fig 6. Subcellular localization of neurocalcin δ B (NCALD) in rods and cones.
(A) DIC images (left panels) of double (top), single (middle) and twin (bottom) cones, and immunofluorescent images of antiserum against anti-mAAT (middle panels) and those of NCALD (right panels). Scale bars, 10 μm. OS, outer segment. IS, inner segment. (B) Negative control of (A) with use of control mouse serum (middle for mAAT) and rabbit serum (right for NCALD). A cone was only faintly labeled with these control sera. (C) Immunoblot analysis of non-washed membranes in ROS-, RIS-, COS- and CIS-rich fractions (ROS-rich, RIS-rich, COS-rich and CIS-rich, respectively). Membranes in these fractions were subjected to SDS-PAGE and were stained with CBB or probed with antibody against NCALD. NCALD signals were observed in membranes of COS-rich and CIS-rich fractions (arrowhead). The membranes of ROS- and RIS-rich fraction were obtained from 2.0 × 10⁵ rods. The membranes of COS- and CIS-rich fraction were obtained from 2.0 × 10⁵ and 5.0 × 10⁴ cones, respectively, to observe similar intensity of immunoblot signals of NCALD. (D) Immunoblot signals of NCALD (arrowhead) on membranes obtained from 2.0 × 10⁵ purified cone membranes (Purified cones), washed COS membranes obtained from 2.5 × 10⁶ purified cones (Washed COS) and washed CIS membrane obtained from 2.5 × 10⁶ purified cones (Washed CIS).

Similar articles

Cited by

References

    1. Pugh EN Jr. Lamb TD. Amplification and kinetics of the activation steps in phototransduction. Biochim Biophys Acta. 1993; 1141(2–3):111–49. - PubMed
    1. Kawamura S, Tachibanaki S. Rod and cone photoreceptors: molecular basis of the difference in their physiology. Comp Biochem Physiol A Mol Integr Physiol. 2008; 150(4):369–77. 10.1016/j.cbpa.2008.04.600 - DOI - PubMed
    1. Fu Y, Yau KW. Phototransduction in mouse rods and cones. Pflugers Arch. 2007; 454(5):805–19. 10.1007/s00424-006-0194-y - DOI - PMC - PubMed
    1. Tachibanaki S, Tsushima S, Kawamura S. Low amplification and fast visual pigment phosphorylation as mechanisms characterizing cone photoresponses. Proc Natl Acad Sci USA. 2001; 98(24):14044–9. 10.1073/pnas.241396898 - DOI - PMC - PubMed
    1. Tachibanaki S, Arinobu D, Shimauchi-Matsukawa Y, Tsushima S, Kawamura S. Highly effective phosphorylation by G protein-coupled receptor kinase 7 of light-activated visual pigment in cones. Proc Natl Acad Sci USA. 2005; 102(26):9329–34. 10.1073/pnas.0501875102 - DOI - PMC - PubMed

Substances