

Transcriptomic profile of leg muscle during early growth in chicken
- PMID: 28291821
- PMCID: PMC5349469
- DOI: 10.1371/journal.pone.0173824
Transcriptomic profile of leg muscle during early growth in chicken
Abstract
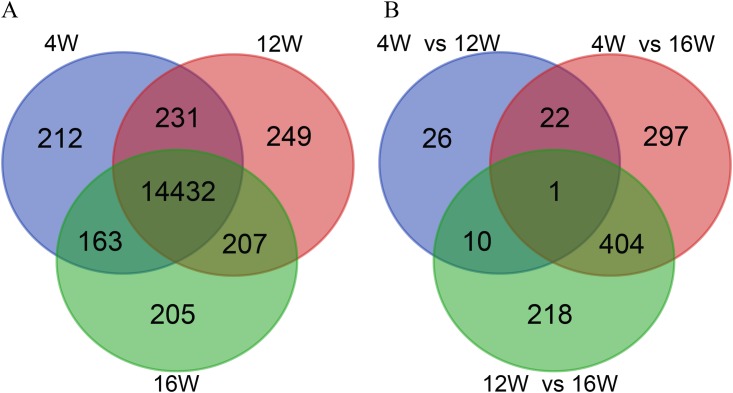
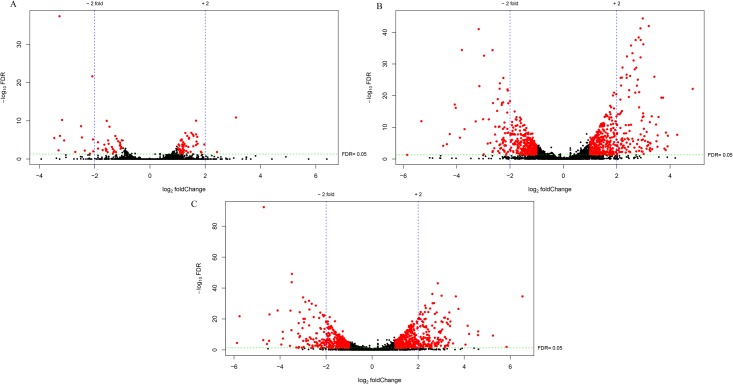
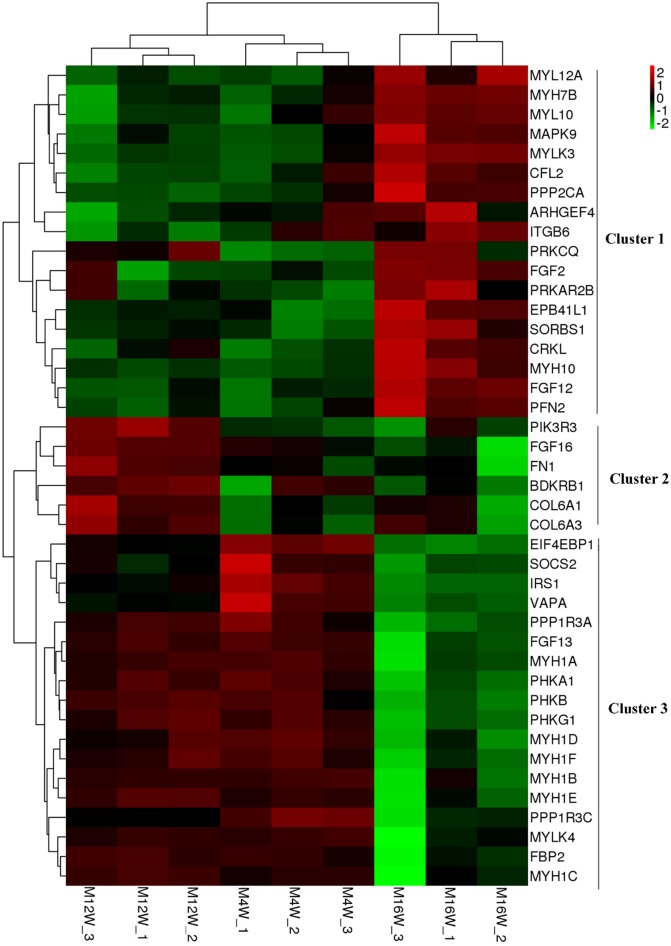
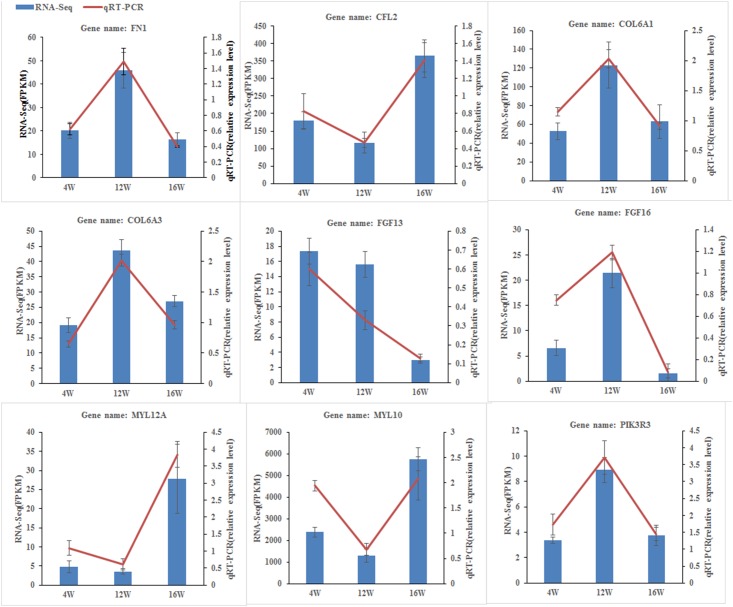
The early growth pattern, especially the age of peak growth, of broilers affects the time to market and slaughter weight, which in turn affect the profitability of the poultry industry. However, the underlying mechanisms regulating chicken growth and development have rarely been studied. This study aimed to identify candidate genes involved in chicken growth and investigated the potential regulatory mechanisms of early growth in chicken. RNA sequencing was applied to compare the transcriptomes of chicken muscle tissues at three developmental stages during early growth. In total, 978 differentially expressed genes (DEGs) (fold change ≥ 2; false discovery rate < 0.05) were detected by pairwise comparison. Functional analysis showed that the DEGs are mainly involved in the processes of cell growth, muscle development, and cellular activities (such as junction, migration, assembly, differentiation, and proliferation). Many of the DEGs are well known to be related to chicken growth, such as MYOD1, GH, IGF2BP2, IGFBP3, SMYD1, CEBPB, FGF2, and IGFBP5. KEGG pathway analysis identified that the DEGs were significantly enriched in five pathways (P < 0.1) related to growth and development: extracellular matrix-receptor interaction, focal adhesion, tight junction, insulin signaling pathway, and regulation of the actin cytoskeleton. A total of 42 DEGs assigned to these pathways are potential candidate genes inducing the difference in growth among the three developmental stages, such as MYH10, FGF2, FGF16, FN1, CFL2, MAPK9, IRS1, PHKA1, PHKB, and PHKG1. Thus, our study identified a series of genes and several pathways that may participate in the regulation of early growth in chicken. These results should serve as an important resource revealing the molecular basis of chicken growth and development.
Conflict of interest statement
Figures
Similar articles
-
Transcriptomic profile of leg muscle during early growth and development in Haiyang yellow chicken.Arch Anim Breed. 2021 Sep 20;64(2):405-416. doi: 10.5194/aab-64-405-2021. eCollection 2021. Arch Anim Breed. 2021. PMID: 34584942 Free PMC article.
-
Comparative Transcriptome Profiling of Skeletal Muscle from Black Muscovy Duck at Different Growth Stages Using RNA-seq.Genes (Basel). 2020 Oct 20;11(10):1228. doi: 10.3390/genes11101228. Genes (Basel). 2020. PMID: 33092100 Free PMC article.
-
Transcriptome Analysis of Leg Muscles and the Effects of ALOX5 on Proliferation and Differentiation of Myoblasts in Haiyang Yellow Chickens.Genes (Basel). 2023 Jun 1;14(6):1213. doi: 10.3390/genes14061213. Genes (Basel). 2023. PMID: 37372393 Free PMC article.
-
Discovery of potential transcriptional biomarkers in broiler chicken for detection of amantadine abuse based on RNA sequencing technology.Food Addit Contam Part A Chem Anal Control Expo Risk Assess. 2019 Feb;36(2):254-269. doi: 10.1080/19440049.2018.1562232. Epub 2019 Jan 16. Food Addit Contam Part A Chem Anal Control Expo Risk Assess. 2019. PMID: 30650025
-
Insights into the molecular mechanism of glucose metabolism regulation under stress in chicken skeletal muscle tissues.Saudi J Biol Sci. 2014 Jul;21(3):197-203. doi: 10.1016/j.sjbs.2014.01.005. Epub 2014 Feb 4. Saudi J Biol Sci. 2014. PMID: 24955006 Free PMC article. Review.
Cited by
-
LncRNA Airn alleviates diabetic cardiac fibrosis by inhibiting activation of cardiac fibroblasts via a m6A-IMP2-p53 axis.Biol Direct. 2022 Nov 16;17(1):32. doi: 10.1186/s13062-022-00346-6. Biol Direct. 2022. PMID: 36384975 Free PMC article.
-
Transcriptome Analysis of Differentially Expressed Genes Related to the Growth and Development of the Jinghai Yellow Chicken.Genes (Basel). 2019 Jul 17;10(7):539. doi: 10.3390/genes10070539. Genes (Basel). 2019. PMID: 31319533 Free PMC article.
-
Revealing Pathways Associated with Feed Efficiency and Meat Quality Traits in Slow-Growing Chickens.Animals (Basel). 2021 Oct 15;11(10):2977. doi: 10.3390/ani11102977. Animals (Basel). 2021. PMID: 34679997 Free PMC article.
-
Decoding chicken growth regulation through multi-omics insights and emerging genetic tools for growth optimization.Poult Sci. 2025 Jul 5;104(10):105542. doi: 10.1016/j.psj.2025.105542. Online ahead of print. Poult Sci. 2025. PMID: 40652768 Free PMC article. Review.
-
How to employ metabolomic analysis to research on functions of prebiotics and probiotics in poultry gut health?Front Microbiol. 2022 Nov 14;13:1040434. doi: 10.3389/fmicb.2022.1040434. eCollection 2022. Front Microbiol. 2022. PMID: 36452931 Free PMC article. Review.
References
-
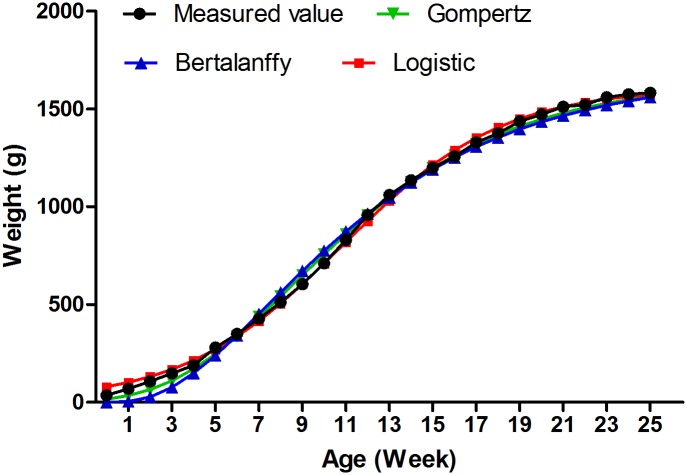
- Tholon P, Queiroz SAD. Mathematic models applied to describe growth curves in poultry applied to animal breeding. Ciência Rural. 2009;39:2261–9.
-
- Veloso RC, Pires AV, Torres RA, Drumond ECS, Costa LS, Amaral JM, et al. Growth of genotypes of an alternative strain of broiler chickens. Arquivo Brasileiro De Medicina Veterinaria E Zootecnia. 2015;67:1361–71.
-
- Das Singh NM, Paul AK, Paul RK. Selecting appropriate nonlinear growth models using Bootstrap technique. Indian Journal of Animal Sciences. 2015;85:104–6.
Publication types
MeSH terms
LinkOut - more resources
Full Text Sources
Other Literature Sources
Miscellaneous
