. 2017 Mar 13;40(5):467-477.e5.
doi: 10.1016/j.devcel.2017.02.003.

Fat2 and Lar Define a Basally Localized Planar Signaling System Controlling Collective Cell Migration

Affiliations

Fat2 and Lar Define a Basally Localized Planar Signaling System Controlling Collective Cell Migration

Kari Barlan et al. Dev Cell. .

Abstract

Collective migration of epithelial cells underlies diverse tissue-remodeling events, but the mechanisms that coordinate individual cell migratory behaviors for collective movement are largely unknown. Studying the Drosophila follicular epithelium, we show that the cadherin Fat2 and the receptor tyrosine phosphatase Lar function in a planar signaling system that coordinates leading and trailing edge dynamics between neighboring cells. Fat2 signals from each cell's trailing edge to induce leading edge protrusions in the cell behind, in part by stabilizing Lar's localization in these cells. Conversely, Lar signals from each cell's leading edge to stimulate trailing edge retraction in the cell ahead. Fat2/Lar signaling is similar to planar cell polarity signaling in terms of sub-cellular protein localization; however, Fat2/Lar signaling mediates short-range communication between neighboring cells instead of transmitting long-range information across a tissue. This work defines a key mechanism promoting epithelial migration and establishes a different paradigm for planar cell-cell signaling.

Keywords: Drosophila; Fat2; Lar; cadherin; collective cell migration; egg chamber; epithelium.


Figures

Figure 1
Figure 1. The developmental context for the migration of the follicular epithelium
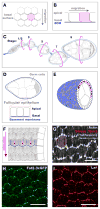
(A and B) Illustrations showing a migrating epithelium from basal (A) and side (B) views. Protrusion size has been exaggerated in (B) to increase visibility. (C) Micrograph of a developmental array of egg chambers, highlighting the period when rotation (arrows) occurs. (D) Illustration of a central sagittal section through an egg chamber. (E) Illustration of a central transverse section though an egg chamber. During their migration (arrow), the follicular epithelial cells crawl along the basement membrane, which remains stationary. (F) Illustration of the basal surface of the follicular epithelium. During migration, the actin cytoskeleton is planar polarized, with stress fibers oriented in the direction of movement and leading edge protrusions oriented orthogonally (arrows). (G) Micrograph of actin-based structures at the basal surface of the follicular epithelium at stage 7. A single cell is highlighted. The direction of migration is down, as determined by the orientation of leading edge protrusions. (H and I) Micrographs showing planar polarization of Fat2-3xGFP (H) and Lar (I) at the basal surface at stage 7. Scale bars, 10 μm.
Figure 2
Figure 2. Lar and Fat2 promote follicle cell migration and localize to juxtaposing cell edges at the basal epithelial surface
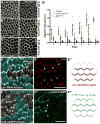
(A–C) Still images from time-lapse movies of control (A) and Larbola1/Larbola2 (B and C) stage 6 epithelia. Dotted lines mark the same three cells across each time series. Some Larbola1/Larbola2 epithelia migrate slowly (B) while some do not migrate (C). Scale bars, 10 μm. (D) Migration rates for control, Larbola1/Larbola2, and fat2N103-2 epithelia. Individual data points, mean ± SD. See Table S1 for sample sizes and P-values. (E and E′) Mosaic expression of Lar-RNAi. Wild-type cells are pseudocolored cyan. Lar is enriched at the leading edge of wild-type cells behind the clone (solid triangles), compared to the trailing edge of wild-type cells ahead of the clone (open triangles). Scale bar, 10 μm. (F and F′) Mosaic epithelium showing Fat2-3xGFP’s subcellular localization. Cells not expressing fat2-3xGFP are pseudocolored cyan. Asterisk marks one cell. Fat2-3xGFP is present at the cell’s trailing edge (solid triangle) but not at the leading edge (open triangle). Scale bar, 10 μm. (E) and (F) are stage 7 epithelia and the direction of migration is down. Illustrations in (E″) and (F″) depict Lar and Fat2 distributions at the basal surface. See also Figures S1, S2, Table S1, and Movie S1.
Figure 3
Figure 3. Fat2 and Lar play complementary roles in leading edge protrusion formation
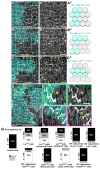
(A–C) Representative images of protrusion formation at the basal surface of control (A), Lar13.2 (B), and fat2N103-2 (C) mosaic epithelia. Protrusions are reduced within Lar13.2 clones (B, B′), while Fat2 functions non-cell-autonomously in protrusion formation (C, C′). Wild-type cells directly behind fat2N103-2 cells lack protrusions (open triangles); fat2N103-2 cells directly behind wild-type cells form protrusions (solid triangles). Scale bars, 10 μm. Illustrations (A″, B″, C″) depict results shown in boxed regions in micrographs. (D–F) Basal surface of a fat2G58-2 mosaic epithelium. (E and E′) Zoom of green boxed region in (D). The asterisk marks a fat2G58-2 cell whose leading edge contacts both a wild-type cell and a fat2G58-2 cell. The portion of the leading edge that contacts the wild-type cell forms protrusions (solid triangle), whereas the portion that contacts the fat2G58-2 cell does not (open triangle). (F and F′) Zoom of magenta boxed region in (D) showing that the same property holds true for a wild-type cell (asterisk). Scale bars, 5 μm (E′, F′). (G) Quantification of protrusion formation in mosaic epithelia. Protrusions were scored by eye as either normal, weak, or absent (none). For Lar and fat2 mosaic epithelia, this analysis was performed on the first row of cells just inside the clone and on the first row of cells just outside the clone, at both the leading and trailing boundaries of the clone. Experiments performed at stage 7. Images oriented with direction of migration down. See also Figure S1
Figure 4
Figure 4. Fat2 non-cell-autonomously stabilizes Lar in neighboring cells
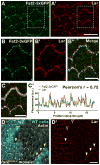
(A–C) Fat2-3xGFP and Lar puncta colocalize along cell-cell interfaces at the basal surface. Boxed regions in (A, A′) are blown up in (B, B′). (C and C′) Line scan analysis on image data in (B). (C′) Fluorescence intensities and corresponding Pearson’s coefficient for Fat2-3xGFP and Lar along the yellow line in (C). Scale bars, 10 μm (A) and 5 μm (B and C). (D) Fat2 stabilizes Lar’s localization in neighboring cells. Lar is absent from the leading edge of wild-type cells directly behind fat2N103-2 cells (open triangles), but localizes normally in fat2N103-2 cells directly behind wild-type cells (solid triangles). Scale bar, 10 μm. See also Figure S3.
Figure 5
Figure 5. Epithelial migration is required for Fat2’s and Lar’s planar polarization
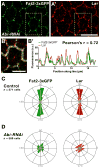
(A and B) Representative images of Fat2-3xGFP’s and Lar’s localization at the basal surface of an epithelium expressing Abi-RNAi. Boxed regions in (A) and (A′) are blown up in the merged image in (B). (B′) Fluorescence intensities and corresponding Pearson’s coefficient for Fat2-3xGFP and Lar along the yellow line in (B). Scale bars, 10 μm (A) and 5 μM (B). (C and D) Rose diagrams showing angular distribution for Fat2-3xGFP and Lar polarity in control (C) and Abi-RNAi (D) epithelia. Fat2 and Lar are no longer planar polarized at the basal surface of Abi-RNAi epithelia. 6 egg chambers were analyzed for each condition. Yellow lines indicate average angle and magnitude of polarity. Experiments performed at stage 7.
Figure 6
Figure 6. Fat2’s intracellular domain is largely dispensable for Lar localization and protrusion formation
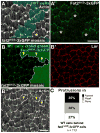
(A and A′) Image of the basal surface of a fat2ΔICD-3xGFP mosaic epithelium. Wild-type cells are pseudocolored cyan. Fat2ΔICD-3xGFP protein is localized to the trailing and lateral edges of each cell, but is excluded from the leading edge. Asterisks mark selected cells at the front of the clone. Although we cannot distinguish between homozygous and heterozygous fat2ΔICD-3xGFP cells, we see this localization pattern in all fat2ΔICD-3xGFP mosaics. Scale bar, 10 μm. (B) Image of the basal surface of fat2ΔICD-3xGFP mosaic epithelium. Wild-type cells express cytoplasmic GFP, and homozygous fat2ΔICD-3xGFP cells lack cytoplasmic GFP. The clone boundary is also indicated by the white dashed line. Fat2ΔICD-3xGFP stabilizes Lar in the plasma membrane (B′) and non-cell-autonomously induces protrusions in neighboring wild-type cells (triangles) (B″). Scale bar, 10 μm. (C) Quantification of protrusions in wild-type cells directly behind fat2ΔICD-3xGFP cells. Experiments performed at stage 7. Images oriented with direction of migration down. See also Figures S4 and S5.
Figure 7
Figure 7. Cell-cell signaling and protrusions both contribute to trailing edge retraction
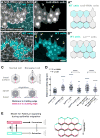
(A and A′) Fat2 functions cell-autonomously in trailing edge retraction, as fat2-RNAi cells have elongated basal surfaces (arrows). Image in (A) is a 3-part overlay of actin, fluorescent clone marker, and a cyan pseudocolored mask. Scale bar, 10 μm. (B and B′) Lar promotes trailing edge retraction non-cell-autonomously. Wild-type cells (cyan) directly ahead of Lar13.2 cells have elongated basal surfaces (arrows). Scale bar, 10 μm. Illustrations in (A″) and (B″) depict results shown in micrographs. (C and D) Quantification of trailing edge retraction defects. Method used to generate data in (D) is depicted in (C). The yellow dot marks the center of the nucleus. (D) In elongated cells, nuclear distance to the trailing edge increases compared to controls (blue asterisks). In Lar13.2 and SCARk13811 mosaics, measurements were made on wild-type cells directly ahead of mutant cells. Individual data points, mean ± SD; one-way ANOVA. (E) Model for Fat2/Lar signaling during epithelial migration. Arrows indicate direction of information flow for protrusion formation (black arrows) and trailing edge retraction (white arrows). Experiments performed at stage 7. Images oriented with direction of migration down. See also Figures S6 and S7.

Comment in

References

    1. Aigouy B, Farhadifar R, Staple DB, Sagner A, Röper JC, Jülicher F, Eaton S. Cell Flow Reorients the Axis of Planar Polarity in the Wing Epithelium of Drosophila. Cell. 2010;142:773–786. - PubMed
    1. Aurich F, Dahmann C. A Mutation in fat2 Uncouples Tissue Elongation from Global Tissue Rotation. CellReports. 2016;14:2503–2510. - PubMed
    1. Aw WY, Heck BW, Joyce B, Devenport D. Transient Tissue-Scale Deformation Coordinates Alignment of Planar Cell Polarity Junctions in the Mammalian Skin. Current Biology. 2016;26:2090–2100. - PMC - PubMed
    1. Bateman J, Reddy RS, Saito H, Van Vactor D. The receptor tyrosine phosphatase Dlar and integrins organize actin filaments in the Drosophila follicular epithelium. Current Biology. 2001;11:1317–1327. - PubMed
    1. Cetera M, Horne-Badovinac S. Round and round gets you somewhere: collective cell migration and planar polarity in elongating Drosophila egg chambers. Current Opinion in Genetics & Development. 2015;32:10–15. - PMC - PubMed

MeSH terms