. 2017 Mar 13;31(3):411-423.
doi: 10.1016/j.ccell.2017.02.010.

Integrated Molecular Characterization of Uterine Carcinosarcoma

Collaborators, Affiliations

Integrated Molecular Characterization of Uterine Carcinosarcoma

Andrew D Cherniack et al. Cancer Cell. .

Abstract

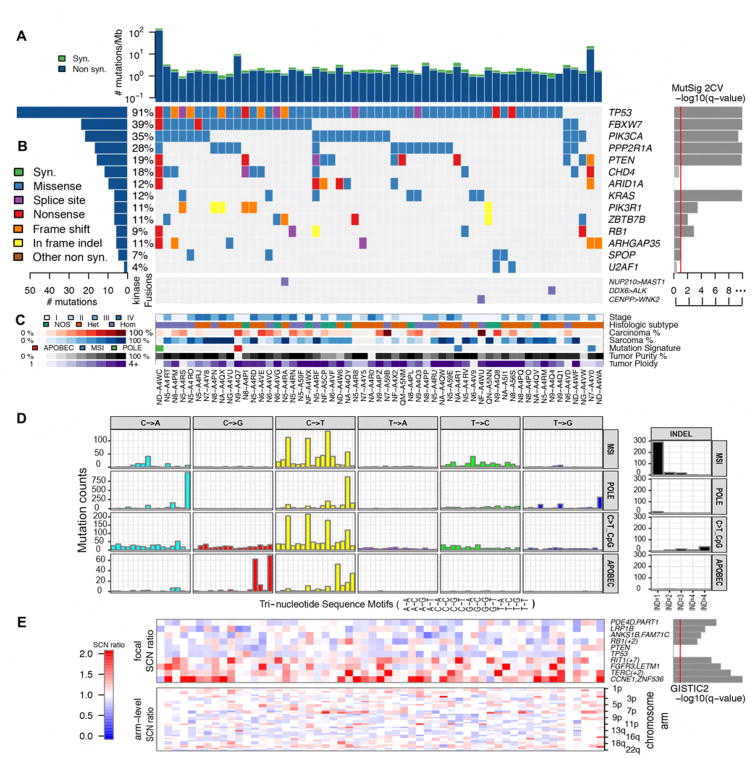
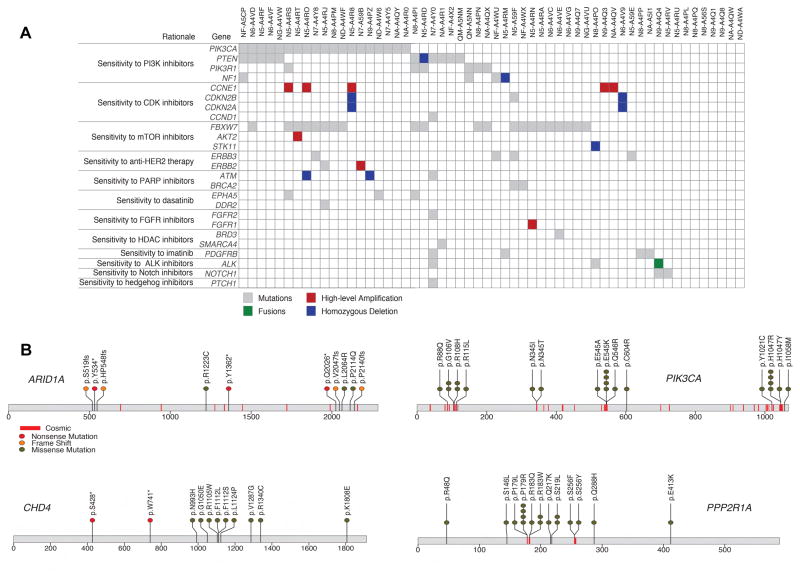
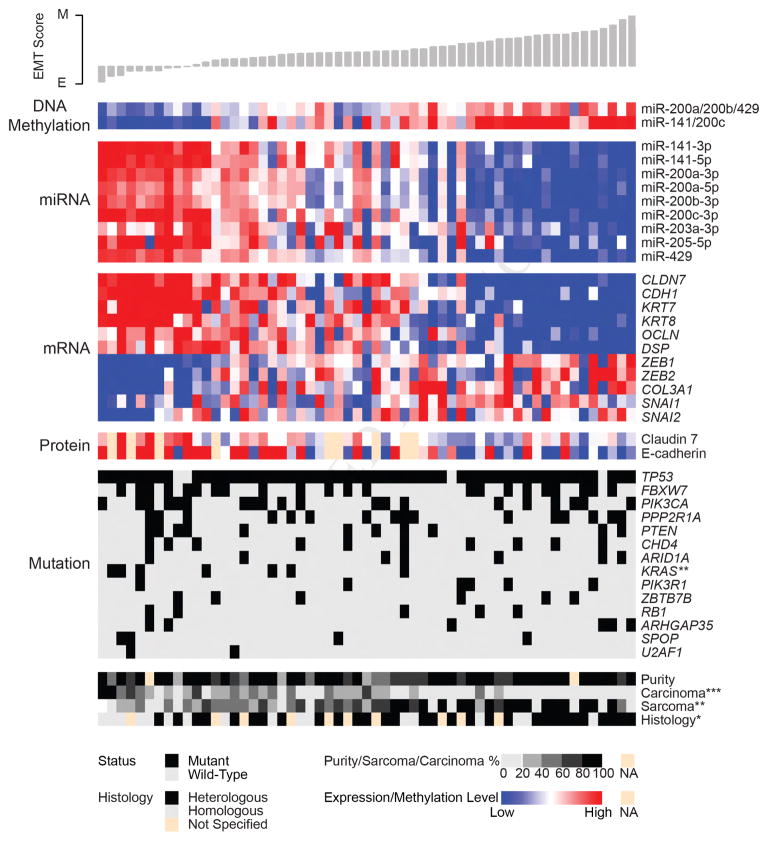
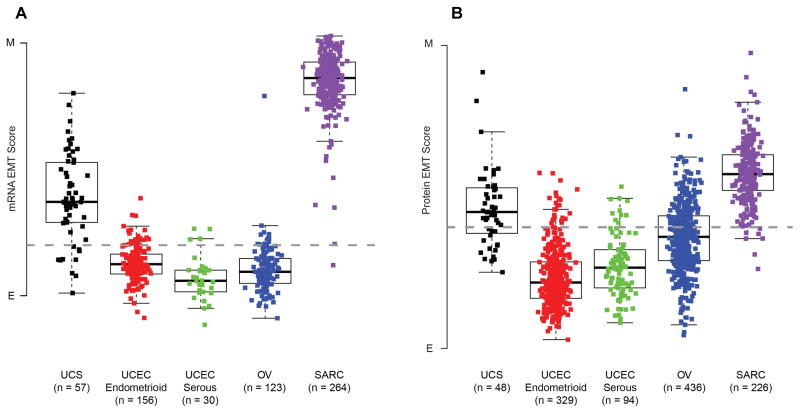
We performed genomic, epigenomic, transcriptomic, and proteomic characterizations of uterine carcinosarcomas (UCSs). Cohort samples had extensive copy-number alterations and highly recurrent somatic mutations. Frequent mutations were found in TP53, PTEN, PIK3CA, PPP2R1A, FBXW7, and KRAS, similar to endometrioid and serous uterine carcinomas. Transcriptome sequencing identified a strong epithelial-to-mesenchymal transition (EMT) gene signature in a subset of cases that was attributable to epigenetic alterations at microRNA promoters. The range of EMT scores in UCS was the largest among all tumor types studied via The Cancer Genome Atlas. UCSs shared proteomic features with gynecologic carcinomas and sarcomas with intermediate EMT features. Multiple somatic mutations and copy-number alterations in genes that are therapeutic targets were identified.

Keywords: EMT; TGGA; The Cancer Genome Atlas; UCS; endometrial cancer; epithelial-to-mesenchymal transition; gynecologic cancer; gynecologic oncology; translational science; uterine carcinosarcoma.


Figures

Figure 1
Figure 1. Landscape of somatic alterations in 57 uterine carcinosarcomas
(A) Synonymous (syn.) and non-synonymous (non syn.) mutation density (mutations/Mb) across the cohort. (B) Gene-sample matrix of mutations in MutSig 2CV significant genes (Benjamini-Hochberg false-discovery rate q value < 0.1, left). Samples with kinase-domain fusions are shown below the mutations. Samples are ordered by number of mutations in significant genes. (C) Tumor stage, histologic subtype, carcinoma and sarcoma percentages, mutation signature type, purity and ploidy across the cohort. (D) Mutational signatures discovered in UCS cohort. A variant of non-negative matrix factorization (Bayesian NMF) to the mutation count matrix across samples (101 by 57). The vertical scale represents counts of mutations in each context bin labeled on the horizontal axis. Indel counts and bins are shown on the right. MSI, Micro-satellite instability. IND=1–4 refer to one, two, three, or four or more base indels. (E) Heatmap of focal somatic copy number (SCN) alterations (top) in genes with the highest GISTIC2 significance (right) for deletions (top 4), amplifications (lower 4), as well as for TP53 and PTEN, which were not significantly altered. The SCN ratio scale is corrected by purity and ploidy for each sample. Also shown is the arm-level SCN chromosome-sample heatmap across the cohort (bottom). See also Figures S1 and S2 and Tables S1 – S4.
Figure 2
Figure 2. Clinically relevant alterations in uterine carcinosarcoma
(A) Landscape of potentially clinically relevant mutations, copy number alterations and fusions in 56 UCS tumors, as identified by the PHIAL algorithm. Rows represent alterations in genes that lead to a given clinical rationale. Somatic mutations are shown in gray, homozygous deletions in blue, high-level amplifications in red (focal and more than two copies gained) and gene fusions in green. One POLE hypermutator case is excluded. (B) Mutation positions in amino acid coordinates for 4 of 14 significantly mutated genes. Each mutation is annotated by protein change (Gencode v18 transcripts). Also marked in red lines are sites of mutations from COSMIC v67 for which more than 5 experiments or samples had a mutation at the site.
Figure 3
Figure 3. Clonality of UCS tumors compared with other TCGA tumor types
(A) Sorted mutation counts for each tumor separated by tumor type. All mutations are plotted in blue, clonal mutations in red, mutations in Significantly Mutated Genes (SMG) are light blue and clonal SMG mutations in magenta. All data was uniformly processed through the ABSOLUTE pipeline that includes adjustment for cellularity. SMGs for other tumor types were based on www.tumorportal.org (Lawrence et al., 2014). Labels across the top of the plot indicate the count of tumors included for each tumor type. (B) Boxplots showing the clonal proportion of mutations. Boxplot center lines (red) represent tumor medians, box limits (blue) are the inter-quartile range from 25% and 75%, whiskers (black) represent the extent of tumors out to 1.5 times the inter-quartile range, and red crosses are outliers beyond 1.5 times the inter-quartile range. (C) Boxplots showing the clonal proportion of SMGs. Components of the figure are as defined in panel (B). BLCA, bladder urothelial carcinoma; BRCA, breast invasive carcinoma; GBM, glioblastoma; KICH, kidney chromophobe; KIRC, kidney renal clear cell carcinoma; KIRP, kidney renal papillary cell carcinoma; LGG, low grade glioma; LUAD, lung adenocarcinoma; LUSC, lung squamous cell carcinoma; SKCM, skin cutaneous melanoma; STAD, stomach adenocarcinoma; THCA thyroid carcinoma; UCEC, uterine corpus endometrial carcinoma; UCS, uterine carcinosarcoma.
Figure 4
Figure 4. Evidence of EMT in uterine carcinosarcoma
The heatmap shows methylation levels for miR-200 family members, expression of miR-200 family members, expression of select genes associated with EMT and protein expression of genes associated with EMT. Methylation and expression levels are median-centered by row and scaled by platform for visualization purposes. One DNA methylation probe from multiple highly correlated probes that map to the promoter of each miRNA cluster is shown (miR-200a/200b/429 = cg15822328, miR-141/200c = cg24702147). Samples (n = 57) appear in columns and are ordered according to EMT score, as shown by the histogram at the top. Annotation tracks at the bottom show mutation status for significantly mutated genes, as well as values of clinical variables of interest. Missing values (NA) for protein expression (n = 9) and tumor purity (n = 2) are indicated. Wilcoxon rank sum tests were used to assess the significance of associations between EMT scores and either gene mutations or histological type; Spearman correlation tests were used to assess the significance of associations between EMT scores and tumor purity, carcinoma percentage, and sarcoma percentage. Asterisks indicate statistically significant p values: *p < 0.05; **p < 0.01; ***p < 0.001. E, epithelial; M, mesenchymal; EMT, epithelial-to-mesenchymal transition. See also Figure S3 and Table S5.
Figure 5
Figure 5. Expression and quantification of EMT across tumor types
(A) The boxplot display shows differences of EMT scores within five groups of tumors: UCS, endometrioid UCEC, serous UCEC, OV, SARC (ANOVA p value < 0.001). Boxplot center lines represent tumor medians, box limits are the inter-quartile range from 25% and 75%, whiskers represent the extent of tumors out to 1.5 times the inter-quartile range. The dashed horizontal line corresponds to an EMT score of 0. (B) Boxplot display shows differences in protein-based EMT scores within five groups of tumors: UCS, endometrioid UCEC, serous UCEC, OV, SARC (ANOVA p value < 0.001). Components of the figure are as defined in panel (A). E, epithelial; M, mesenchymal; EMT, epithelial-to-mesenchymal transition, UCS, uterine carcinosarcoma; UCEC, uterine corpus endometrial carcinoma; OV, ovarian serous carcinoma; SARC, sarcoma. See also Figure S4.
Figure 6
Figure 6. Comparison of TCGA gynecological cancers
Molecular features distinguishing serous versus endometrioid uterine carcinomas (UCEC) for DNA methylation and mRNA expression are shown for UCEC, OV and UCS samples (columns). In addition, all segments for DNA copy number are displayed, with blue and red indicating deletion and amplification respectively. Within each tumor group, the samples are ranked by increasing similarity to serous UCEC and decreasing similarity to endometrioid UCEC (as measured by a combined rank of difference in each tumor’s distance to the endometrioid UCEC centroid and serous UCEC centroid from four different platforms; see Supplemental Experimental Procedures). Top color bars denote molecular subtype (if UCEC: blue – POLE; green – MSI; orange – copy number low; red – copy number high), PTEN mutation, TP53 mutation (black – mutant; gray – wild-type; white - missing), and percent endometrioid content as estimated from slide review (for UCS: blue to red for 0% to 100%). One UCS sample failed DNA copy number analyses resulting in a total of 56 UCS samples for integrated analyses. See also Figures S5 and S6 and Table S7.
Figure 7
Figure 7. RPPA analysis demonstrating shared epithelial and mesenchymal features of UCS tumors
(A) Supervised clustering heatmap showing the top 100 differentially expressed proteins between the gynecologic cancers (endometrial [UCEC] and ovarian [OV]) versus sarcomas [SARC] (without the leiomyosarcoma subtype). UCS was then added and the samples were clustered within each tumor type, but not across tumor types. The top half shows proteins that are not highly expressed in sarcomas, whereas the bottom half shows proteins that are highly expressed in sarcomas. The arrows point to proteins of interest color-coded to reflect pathway membership. UCS proteins outlined in purple have similar profiles to the gynecologic cancers and proteins outlined in green have profiles similar to sarcoma. (B) Box plots of pathway activities showing how UCS compares with UCEC, OV and SARC. Sample size of each tumor type is the same as panel (A). Boxplot center lines represent tumor medians, box limits are the inter-quartile range from 25% and 75%, whiskers represent the extent of tumors out to 1.5 times the inter-quartile range, and circles are outliers beyond 1.5 times the inter-quartile range. ANOVA-based p values are shown for each plot, indicating the statistical significance of the differences between the boxes. See also Figure S7 and Table S6.

References

    1. Abeln EC, Smit VT, Wessels JW, de Leeuw WJ, Cornelisse CJ, Fleuren GJ. Molecular genetic evidence for the conversion hypothesis of the origin of malignant mixed mullerian tumours. The Journal of pathology. 1997;183:424–431. - PubMed
    1. Akbani R, Ng PK, Werner HM, Shahmoradgoli M, Zhang F, Ju Z, Liu W, Yang JY, Yoshihara K, Li J, et al. A pan-cancer proteomic perspective on The Cancer Genome Atlas. Nature communications. 2014;5:3887. - PMC - PubMed
    1. Berger AH, Imielinski M, Duke F, Wala J, Kaplan N, Shi GX, Andres DA, Meyerson M. Oncogenic RIT1 mutations in lung adenocarcinoma. Oncogene. 2014;33:4418–4423. - PMC - PubMed
    1. Bitler BG, Aird KM, Garipov A, Li H, Amatangelo M, Kossenkov AV, Schultz DC, Liu Q, Shih Ie M, Conejo-Garcia JR, et al. Synthetic lethality by targeting EZH2 methyltransferase activity in ARID1A-mutated cancers. Nat Med. 2015;21:231–238. - PMC - PubMed
    1. Bland AE, Stone R, Heuser C, Shu J, Jazaeri A, Shutter J, Atkins K, Rice L. A clinical and biological comparison between malignant mixed mullerian tumors and grade 3 endometrioid endometrial carcinomas. International journal of gynecological cancer: official journal of the International Gynecological Cancer Society. 2009;19:261–265. - PubMed

Publication types