Comparative Study
. 2017 Jun 1;312(6):E519-E529.
doi: 10.1152/ajpendo.00351.2016. Epub 2017 Mar 14.

Phenylalanine isotope pulse method to measure effect of sepsis on protein breakdown and membrane transport in the pig

Affiliations
Comparative Study

Phenylalanine isotope pulse method to measure effect of sepsis on protein breakdown and membrane transport in the pig

Gabriella A M Ten Have et al. Am J Physiol Endocrinol Metab. .

Abstract

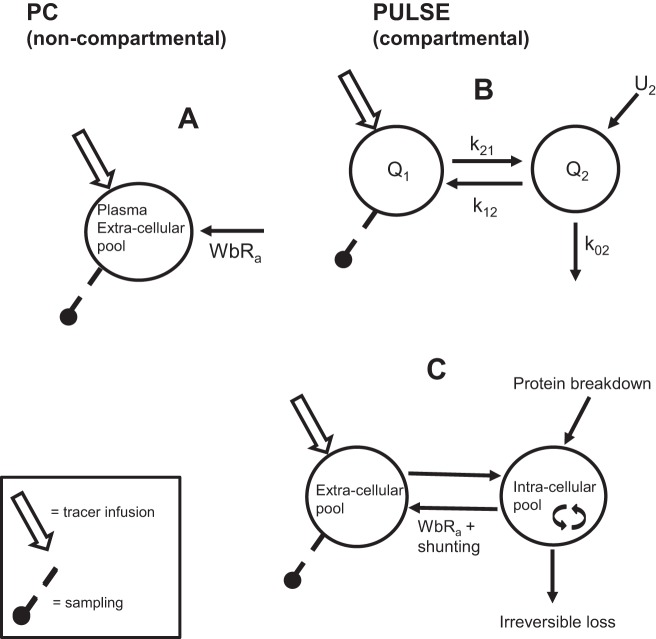
The primed-continuous (PC) phenylalanine (Phe) stable isotope infusion methodology is often used as a proxy for measuring whole body protein breakdown (WbPB) in sepsis. It is unclear if WbPB data obtained by an easy-to-use single IV Phe isotope pulse administration (PULSE) are comparable to those by PC. Compartmental modeling with PULSE could provide us more insight in WbPB in sepsis. Therefore, in the present study, we compared PULSE with PC as proxy for WbPB in an instrumented pig model with Pseudomonas aeruginosa-induced severe sepsis (Healthy: n = 9; Sepsis: n = 13). Seventeen hours after sepsis induction, we compared the Wb rate of appearance (WbRa) of Phe obtained by PC (L-[ring-13C6]Phe) and PULSE (L-[15N]Phe) in arterial plasma using LC-MS/MS and (non)compartmental modeling. PULSE-WbRa was highly correlated with PC-WbRa (r = 0.732, P < 0.0001) and WbPB (r = 0.897, P < 0.0001) independent of the septic state. PULSE-WbRa was 1.6 times higher than PC-WbRa (P < 0.001). Compartmental and noncompartmental PULSE modeling provide comparable WbRa values, although compartmental modeling was more sensitive. WbPB was elevated in sepsis (Healthy: 3,378 ± 103; Sepsis: 4,333 ± 160 nmol·kg BW-1·min-1, P = 0.0002). With PULSE, sepsis was characterized by an increase of the metabolic shunting (Healthy: 3,021 ± 347; Sepsis: 4,233 ± 344 nmol·kg BW-1·min-1, P = 0.026). Membrane transport capacity was the same. Both PC and PULSE methods are able to assess changes in WbRa of plasma Phe reflecting WbPB changes with high sensitivity, independent of the (patho)physiological state. The easy-to-use (non)compartmental PULSE reflects better the real WbPB than PC. With PULSE compartmental analysis, we conclude that the membrane transport capacity for amino acids is not compromised in severe sepsis.

Keywords: phenylalanine; pig; protein breakdown; pulse stable isotope method; sepsis.


Figures

Fig. 1.
Fig. 1.
Calculation models for whole body protein breakdown. Two calculation models for whole body protein breakdown (WbPB) by determination of whole body rate of appearance (WbRa) of phenylalanine (Phe). A: noncompartmental model using a primed-continuous infusion of L-[ring-13C6]Phe (PC). WbRa is the tracer infusion rate divided by the fraction of tracer found in plasma/extracellular pool (TTR = tracer/tracee ratio) in a tracer steady state. B: compartmental model using bolus infusion, L-[15N]Phe (PULSE) and SAAMII computer modeling. Computer parameters: Q = pool sizes of the compartments; k21 = rate parameter to pool 2, from pool 1; k02 = rate parameter of irreversible loss from pool 2; U2 = rate of appearance of Phe in pool 2. C: physiological assignment of SAAMII computer model. Flux (F12) of Phe from the intracellular pool to the extracellular pool represents the k21 times Q1, and is equal to F21 in physiological steady state; U2 ( = F20) represents WbPB; Flux of Phe from the intracellular pool to hydroxylation and protein synthesis represents the irreversible loss (F02 = k02Q2); WbRa of Phe is the fraction of Phe from protein breakdown that appears in Q1 that is not irreversibly lost. The amount of Phe flux between Q1 and Q2 that is not irreversibly lost is shunt back to Q1 (F21-WbRa).
Fig. 2.
Fig. 2.
Protocol. PC: primed-continuous infusion L-[ring-13C6]phenylalanine (Phe). PULSE: bolus infusion L-[15N]Phe. MPAP,  mean pulmonary artery pressure, MAP, mean arterial pressure.
Fig. 3.
Fig. 3.
Example plasma tracer/tracee ratios. Example of plasma tracer/tracee time courses of arterial phenylalanine (Phe) in a Healthy and a Sepsis animal. PC: steady-state curve, 5 h after the start of a primed-continuous infusion of L-[ring-13C6]Phe tracer; PULSE: a two-exponential decay curve after a bolus infusion tracer with L-[15N]Phe. TTR is tracer/tracee ratio.
Fig. 4.
Fig. 4.
Individual decay curves of Healthy animals (PULSE). Plasma tracer/tracee (TTR) time courses of arterial Phe in healthy animals. PULSE: a two-exponential decay curve after a bolus infusion tracer with L-[15N]Phe.
Fig. 5.
Fig. 5.
Individual decay curves of Sepsis animals (PULSE). Plasma tracer/tracee (TTR) time courses of arterial Phe in Sepsis animals. PULSE: A two-exponential decay curve after a bolus infusion tracer with L-[15N]Phe.
Fig. 6.
Fig. 6.
Phenylalanine (Phe, tracee) concentrations. A: arterial plasma Phe tracee (nontracer) concentrations after administration of L-[15N]Phe pulse. Between 17 and 18 h after start, administration of Pseudomonas aeruginosa. Data are expressed as means ± SD. Healthy n = 9, Sepsis n = 13. Statistics for physiological steady-state: linear regression, significance P < 0.05 if slope was different from zero. Slope in Sepsis group was different from zero (P = 0.0211). B: average tissue Phe concentration from muscle, jejunum, ileum, liver, lung in µmol/kg wet wt. At necropsy, 18 h after start, administration of Pseudomonas aeruginosa. Data are expressed as means ± SE. Healthy n = 9, Sepsis n = 13. Statistics: Sepsis compared with Healthy, unpaired t-test. *Significance, P < 0.05.
Fig. 7.
Fig. 7.
Effect of sepsis on whole body rate of appearance (WbRa) of phenylalanine (Phe) using two different tracer methods. WbRa as proxy for whole body protein breakdown in sepsis and healthy pigs. Calculated with PC tracer method: primed-continuous infusion of L-[ring-13C6]Phe (A) or with the PULSE tracer method: bolus infusion of L-[15N]Phe (B). Compartmental and noncompartmental data analyses. Data are expressed as means ± SE. Healthy n = 9, Sepsis n = 13. Statistics: sepsis compared with Healthy, unpaired t-test. *Significance, P < 0.05. C: correlation between WbRa-PULSE (compartmental) vs. WbRa-PC. Statistics for correlation: Pearson correlation (r = 0.732), with a likelihood for real correlation (P < 0.0001). Linear regression is used for the prediction of best line (r2 = 0.507, slope 1.61). D: Bland-Altman plot. Ratio vs. the average of the two different tracer methods. The discrepancy (mean ± SD) is 1.628 ± 0.2279. Wilcoxon Signed Rank test was used to determine the discrepancy was different from 1: P < 0.0001. Discrepancy passed D’Agostino and Pearson normality test. E: correlation between WbRa-PULSE (compartmental) vs. WbRa-PULSE (noncompartmental). Statistics for correlation: Pearson correlation (r = 0.969), with a likelihood for real correlation (P < 0.0001). Linear regression is used for the prediction of best line (r2 = 0.9386, slope = 1.005). F: Bland-Altman plot. Difference vs. the average of the two different PULSE data analysis methods. The discrepancy (mean ± SD) is −26.51 ± 108.1. Wilcoxon Signed Rank test was used to determine the discrepancy was different from zero: No significance. Discrepancy did not pass D’Agostino and Pearson normality test.
Fig. 8.
Fig. 8.
Effect of sepsis on whole body protein breakdown (WbPB). WbPB data obtained with compartmental modeling (PULSE method). A: WbPB. Data are expressed as means ± SE. Healthy n = 9, Sepsis n = 13. Statistics: Sepsis compared with Healthy, unpaired t-test. *Significance, P < 0.0002. B: correlation between WbPB and whole body rate of appearance (WbRa). Statistics: Pearson correlation (r = 0.897), with a likelihood for real correlation (P < 0.0001). Linear regression is used for the prediction of best line (r2 = 0.803, slope = 0.60).

Similar articles

Cited by

References

    1. Bland JM, Altman DG. Measuring agreement in method comparison studies. Stat Methods Med Res 8: 135–160, 1999. doi:10.1191/096228099673819272. - DOI - PubMed
    1. Bregendahl K, Yang X, Liu L, Yen JT, Rideout TC, Shen Y, Werchola G, Fan MZ. Fractional protein synthesis rates are similar when measured by intraperitoneal or intravenous flooding doses of L-[ring-2H5]phenylalanine in combination with a rapid regimen of sampling in piglets. J Nutr 138: 1976–1981, 2008. - PubMed
    1. Bruins MJ, Deutz NE, Soeters PB. Aspects of organ protein, amino acid and glucose metabolism in a porcine model of hypermetabolic sepsis. Clin Sci (Lond) 104: 127–141, 2003. doi:10.1042/cs1040127. - DOI - PubMed
    1. Bruins MJ, Lamers WH, Meijer AJ, Soeters PB, Deutz NE. In vivo measurement of nitric oxide production in porcine gut, liver and muscle during hyperdynamic endotoxaemia. Br J Pharmacol 137: 1225–1236, 2002. doi:10.1038/sj.bjp.0704993. - DOI - PMC - PubMed
    1. Bruins MJ, Soeters PB, Deutz NE. Endotoxemia affects organ protein metabolism differently during prolonged feeding in pigs. J Nutr 130: 3003–3013, 2000. - PubMed

MeSH terms

LinkOut - more resources