. 2017 Apr 5;37(14):3896-3912.
doi: 10.1523/JNEUROSCI.3042-16.2017. Epub 2017 Mar 14.

Nonlinear Modulation of Cutaneous Reflexes with Increasing Speed of Locomotion in Spinal Cats

Affiliations

Nonlinear Modulation of Cutaneous Reflexes with Increasing Speed of Locomotion in Spinal Cats

Marie-France Hurteau et al. J Neurosci. .

Abstract

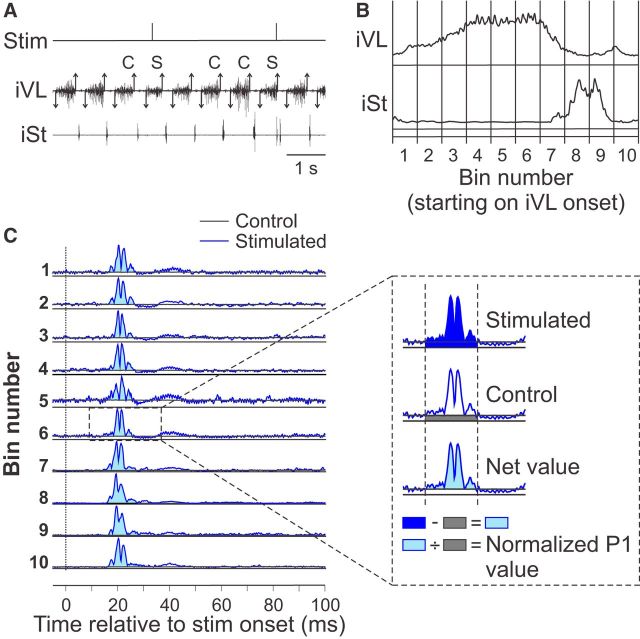
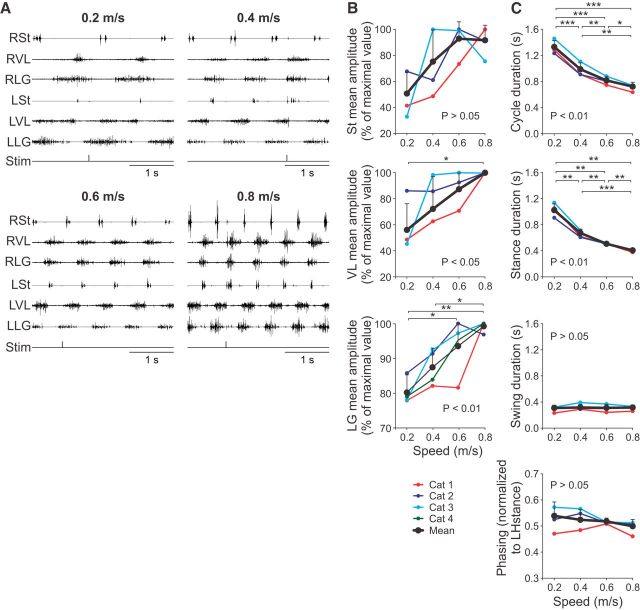
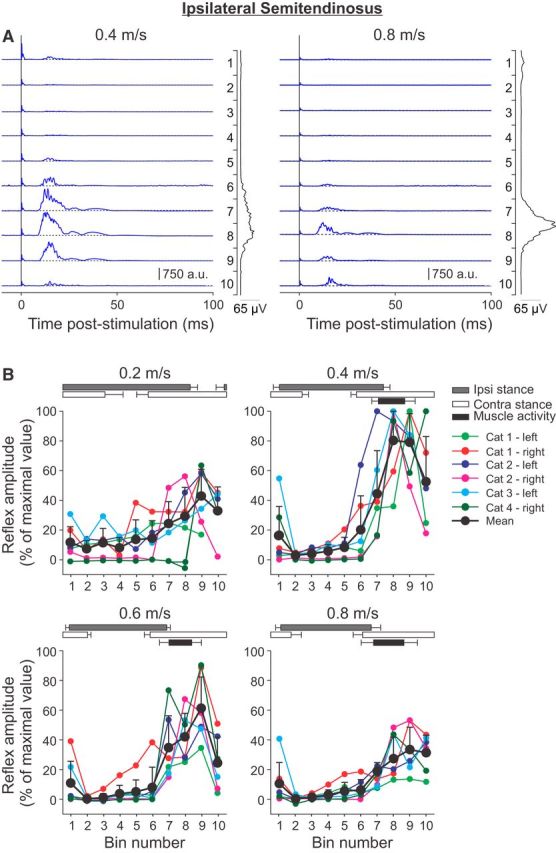
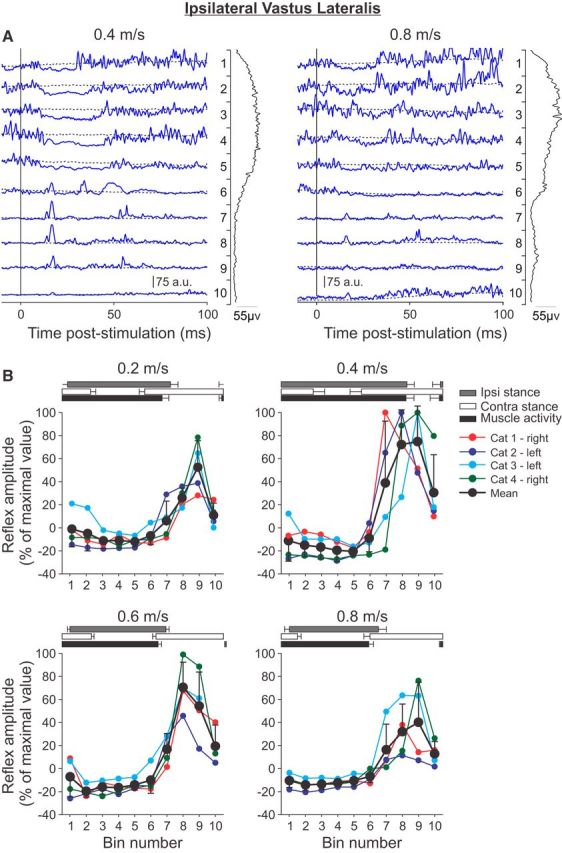
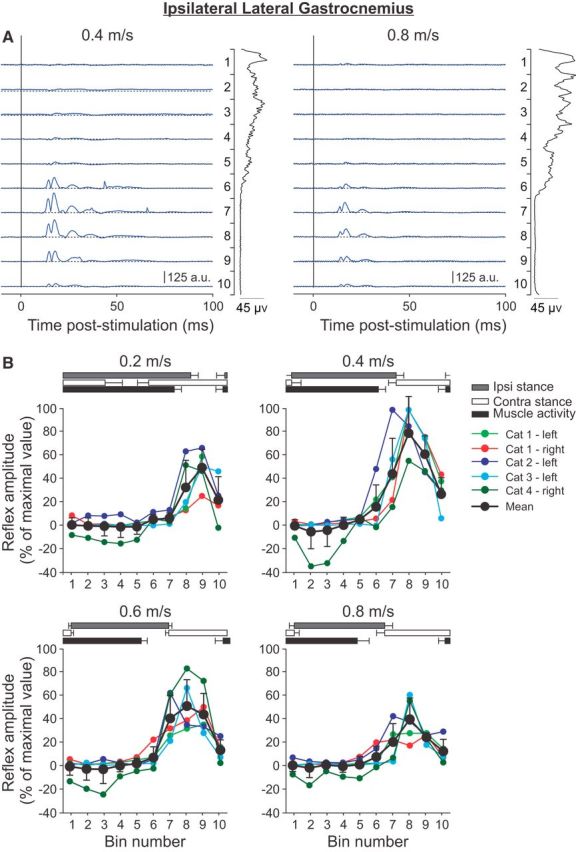
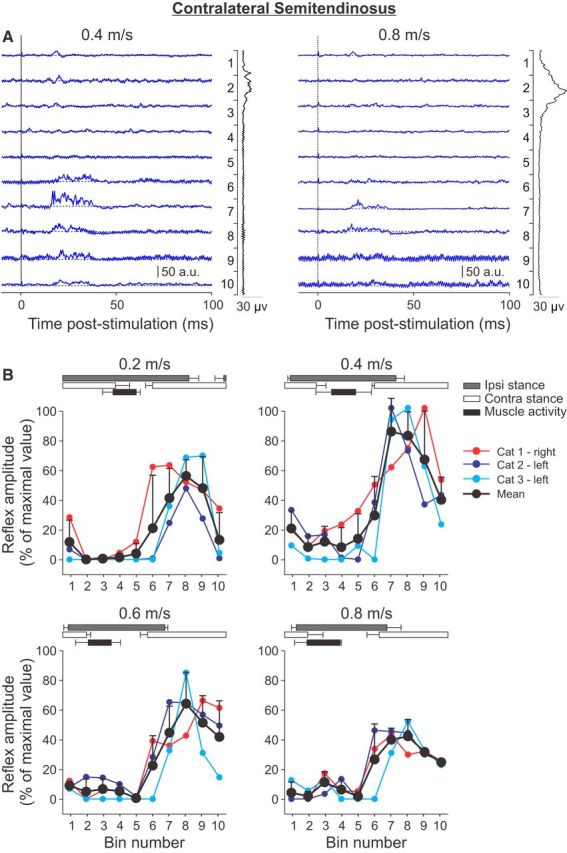
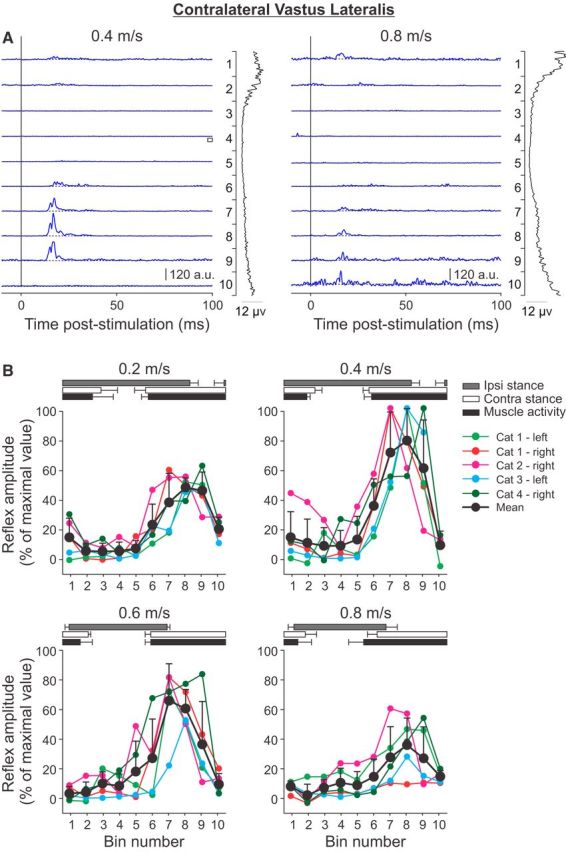
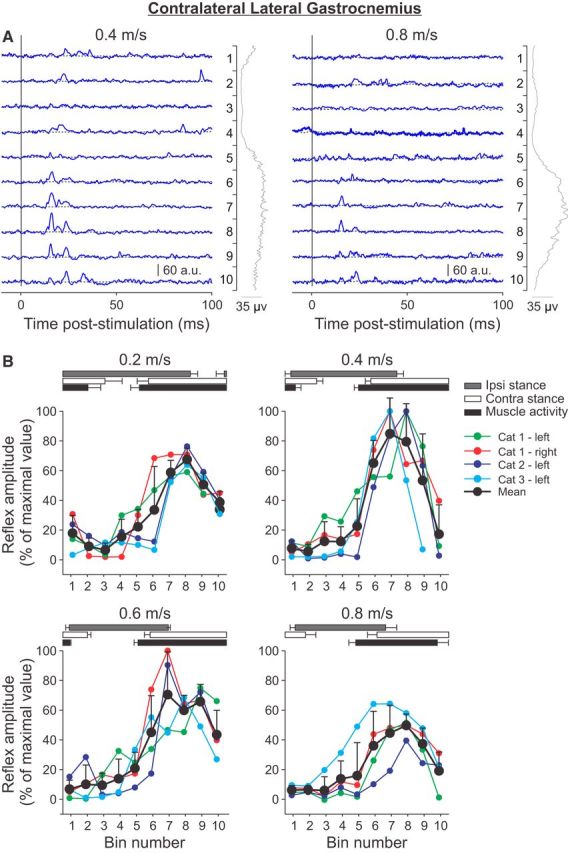
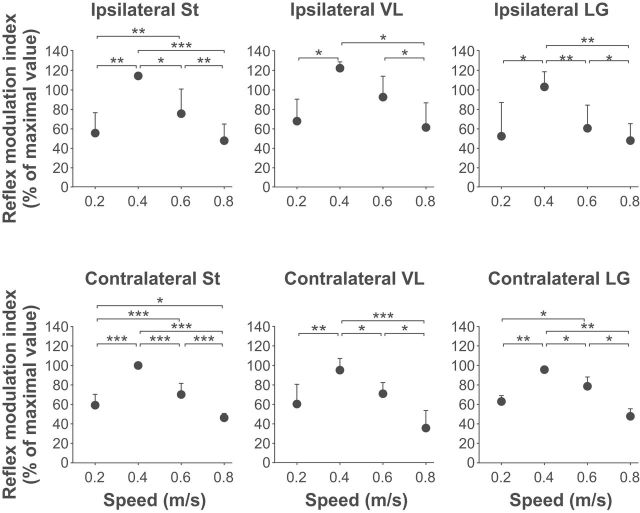
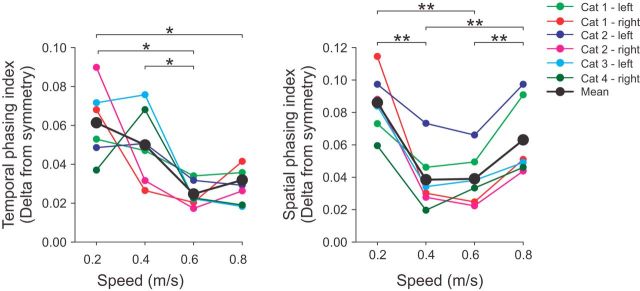
Cutaneous reflexes are important for responding rapidly to perturbations, correcting limb trajectory, and strengthening support. During locomotion, they are modulated by phase to generate functionally appropriate responses. The goal of the present study was to determine whether cutaneous reflexes and their phase-dependent modulation are altered with increasing speed and if this is accomplished at the spinal level. Four adult cats that recovered stable hindlimb locomotion after spinal transection were implanted with electrodes to record hindlimb muscle activity chronically and to stimulate the superficial peroneal nerve electrically to evoke cutaneous reflexes. The speed-dependent modulation of cutaneous reflexes was assessed by evoking and characterizing ipsilateral and contralateral responses in semitendinosus, vastus lateralis, and lateral gastrocnemius muscles at four treadmill speeds: 0.2, 0.4, 0.6, and 0.8 m/s. The amplitudes of ipsilateral and contralateral responses were largest at intermediate speeds of 0.4 and 0.6 m/s, followed by the slowest and fastest speeds of 0.2 and 0.8 m/s, respectively. The phase-dependent modulation of reflexes was maintained across speeds, with ipsilateral and contralateral responses peaking during the stance-to-swing transition and swing phase of the ipsilateral limb or midstance of the contralateral limb. Reflex modulation across speeds also correlated with the spatial symmetry of the locomotor pattern, but not with temporal symmetry. That the cutaneous reflex amplitude in all muscles was similarly modulated with increasing speed independently of the background level of muscle activity is consistent with a generalized premotoneuronal spinal control mechanism that could help to stabilize the locomotor pattern when changing speed.SIGNIFICANCE STATEMENT When walking, receptors located in the skin respond to mechanical pressure and send signals to the CNS to correct the trajectory of the limb and to reinforce weight support. These signals produce different responses, or reflexes, if they occur when the foot is contacting the ground or in the air. This is known as phase-dependent modulation of reflexes. However, when walking at faster speeds, we do not know if and how these reflexes are changed. In the present study, we show that reflexes from the skin are modulated with speed and that this is controlled at the level of the spinal cord. This modulation could be important in preventing sensory signals from destabilizing the walking pattern.

Keywords: cutaneous reflex; locomotion; speed; spinal cord.


Figures

Figure 1.
Figure 1.
Reflex analysis. A, Burst onsets (downward arrows) and offsets (upward arrows) of an extensor muscle ipsilateral to the stimulation were visually determined. Step cycles were defined from successive burst onsets of this extensor. Cycles were then categorized as control (C, cycles with no stimulation) or stimulated (S, cycles with a stimulation). B, Control and stimulated cycles were then averaged for the different muscles and normalized to the step cycle. Normalized cycles were then separated into 10 equal bins. C, Control and stimulated cycles were sorted into these 10 bins. For instance, if stimuli were given in the first 10% of the cycle, then these cycles were sorted into bin 1 and so on. The control cycles provide a blEMG in each bin. The onset and offset of short-latency responses, defined as a prominent positive deflection away from the blEMG, were then determined visually. The EMG within that window was integrated and the blEMG occurring in the same time window was then subtracted to provide a net reflex value. This net value was then divided by the blEMG occurring in the same time window to provide a normalized response. iVL, Ipsilateral vastus lateralis; iSt, ipsilateral semitendinosus.
Figure 2.
Figure 2.
Modulation of the locomotor pattern with increasing speed. A, Each panel shows the EMG from the right (R) and left (L) St, VL, and LG. The stimulation (Stim) of the left SP nerve is shown below the EMGs. Data are from Cat 4. B, Mean amplitude of the St, VL, and LG EMG bursts normalized to the maximal value obtained at one speed. C, Cycle, stance, and swing durations and temporal phasing at the different speeds. Data are shown for individual cats and for the group (n = 4 cats). p-values indicate if there was a significant effect of speed (one-factor repeated-measures ANOVA) at the 0.05 level. Asterisks indicate significant differences between speeds (pairwise comparisons): *p < 0.05; **p < 0.01; ***p < 0.001.
Figure 3.
Figure 3.
Phase-and speed-dependent modulation of cutaneous reflexes in the ipsilateral semitendinosus across speeds. A, Cutaneous reflexes evoked in a spinal cat (Cat 1) at 0.4 and 0.8 m/s and separated into 10 bins. The blue lines are the rectified EMG waveforms obtained with stimulation (average of 5–17 cycles per bin). The dashed lines show the background level of EMG (average of >90 control cycles). The EMG waveform shown vertically on the right of each panel is the rectified activity of the muscle at each speed (average of >90 control cycles). B, P1 responses were averaged in each bin and expressed as a percentage of the maximal value obtained at 0.4 m/s. Data are shown for individual nerve stimulations (mean) and for pooled data (mean ± SD). The horizontal bars above the panels show the stance phases for the ipsilateral (Ipsi) and contralateral (Contra) hindlimbs, along with the period of activity of the ipsilateral semitendinosus obtained from 30 cycles. Error bars indicate mean ± SD. In A and B, the locomotor cycle was synchronized to onset of the ipsilateral VL.
Figure 4.
Figure 4.
Phase-and speed-dependent modulation of cutaneous reflexes in the ipsilateral VL across speeds. A, Cutaneous reflexes evoked in a spinal cat (Cat 2) at 0.4 and 0.8 m/s and separated into 10 bins. The blue lines are the rectified EMG waveforms obtained with stimulation (average of 5–17 cycles per bin). The dashed lines show the background level of EMG (average of >130 control cycles). The EMG waveform shown vertically on the right of each panel is the rectified activity of the muscle at each speed (average of >130 control cycles). B, P1 or N1 responses were averaged in each bin and expressed as a percentage of the maximal value obtained at 0.4 m/s. Data are shown for individual nerve stimulations (mean) and for pooled data (mean ± SD). The horizontal bars above the panels show the stance phases for the ipsilateral (Ipsi) and contralateral (Contra) hindlimbs along with the period of activity of the ipsilateral VL obtained from 30 cycles. Error bars indicate mean ± SD. In A and B, the locomotor cycle was synchronized to onset of the ipsilateral VL.
Figure 5.
Figure 5.
Phase-and speed-dependent modulation of cutaneous reflexes in the ipsilateral lateral gastrocnemius across speeds. A, Cutaneous reflexes evoked in a spinal cat (Cat 2) at 0.4 and 0.8 m/s and separated into 10 bins. The blue lines are the rectified EMG waveforms obtained with stimulation (average of 8–17 cycles per bin). The dashed lines show the background level of EMG (average of >130 control cycles). The EMG waveform shown vertically on the right of each panel is the rectified activity of the muscle at each speed (average of >130 control cycles). B, P1 or N1 responses were averaged in each bin and expressed as a percentage of the maximal value obtained at 0.4 m/s. Data are shown for individual nerve stimulations (mean) and for pooled data (mean ± SD). The horizontal bars above the panels show the stance phases for the ipsilateral (Ipsi) and contralateral (Contra) hindlimbs, along with the period of activity of the ipsilateral lateral gastrocnemius obtained from 30 cycles. Error bars indicate mean ± SD. In A and B, the locomotor cycle was synchronized to onset of the ipsilateral VL.
Figure 6.
Figure 6.
Phase-and speed-dependent modulation of cutaneous reflexes in the contralateral semitendinosus across speeds. A, Cutaneous reflexes evoked in a spinal cat (Cat 2) at 0.4 and 0.8 m/s and separated into 10 bins. The blue lines are the rectified EMG waveforms obtained with stimulation (average of 5–20 cycles per bin). The dashed lines show the background level of EMG (average of >130 control cycles). The EMG waveform shown vertically on the right of each panel is the rectified activity of the muscle at each speed (average of >130 control cycles). B, P1 responses were averaged in each bin and expressed as a percentage of the maximal value obtained at 0.4 m/s. Data are shown for individual nerve stimulations (mean) and for pooled data (mean ± SD). The horizontal bars above the panels show the stance phases for the ipsilateral (Ipsi) and contralateral (Contra) hindlimbs, along with the period of activity of the contralateral semitendinosus obtained from 30 cycles. Error bars indicate mean ± SD. In A and B, the locomotor cycle was synchronized to onset of the ipsilateral VL.
Figure 7.
Figure 7.
Phase-and speed-dependent modulation of cutaneous reflexes in the contralateral VL across speeds. A, Cutaneous reflexes evoked in a spinal cat (Cat 3) at 0.4 and 0.8 m/s and separated into 10 bins. The blue lines are the rectified EMG waveforms obtained with stimulation (average of 7–21 cycles per bin). The dashed lines show the background level of EMG (average of >60 control cycles). The EMG waveform shown vertically on the right of each panel is the rectified activity of the muscle at each speed (average of >60 control cycles). B, P1 responses were averaged in each bin and expressed as a percentage of the maximal value obtained at 0.4 m/s. Data are shown for individual nerve stimulations (mean) and for pooled data (mean ± SD). The horizontal bars above the panels show the stance phases for the ipsilateral (Ipsi) and contralateral (Contra) hindlimbs, along with the period of activity of the contralateral VL obtained from 30 cycles. Error bars indicate mean ± SD. In A and B, the locomotor cycle was synchronized to onset of the ipsilateral VL.
Figure 8.
Figure 8.
Phase-and speed-dependent modulation of cutaneous reflexes in the contralateral lateral gastrocnemius muscle across speeds. A, Cutaneous reflexes evoked in a spinal cat (Cat 2) at 0.4 and 0.8 m/s and separated into 10 bins. The blue lines are the rectified EMG waveforms obtained with stimulation (average of 4–17 cycles per bin). The dashed lines show the background level of EMG (average of >130 control cycles). The EMG waveform shown vertically on the right of each panel is the rectified activity of the muscle at each speed (average of >130 control cycles). B, P1 responses were averaged in each bin and expressed as a percentage of the maximal value obtained at 0.4 m/s. Data are shown for individual nerve stimulations (mean) and for pooled data (mean ± SD). The horizontal bars above the panels show the stance phases for the ipsilateral (Ipsi) and contralateral (Contra) hindlimbs, along with the period of activity of the contralateral lateral gastrocnemius obtained from 30 cycles. Error bars indicate mean ± SD. In A and B, the locomotor cycle was synchronized to onset of the ipsilateral VL.
Figure 9.
Figure 9.
Modulation of cutaneous reflexes across speeds for pooled data. The modulation index was measured by subtracting the smallest response observed in one of the phases from the largest response observed in one of the other phases for all muscles and at each speed. Each bar represents the mean ± SD of pooled data (i.e., nerves stimulated). Asterisks indicate significant differences between speeds (pairwise comparisons): *p < 0.05; **p < 0.01; ***p < 0.001.
Figure 10.
Figure 10.
Temporal and spatial symmetry of the locomotor pattern across speeds. Temporal and spatial phasing intervals were measured. The deviation from a perfect symmetry of 0.5 was then calculated at each speed. Data are shown for individual cats (each data point is the average of 30 cycles) and for pooled data (i.e., six sessions from four cats). Asterisks indicate significant differences between speeds (pairwise comparisons): *p < 0.05; **p < 0.01; ***p < 0.001.

Similar articles

Cited by

References

    1. Abourachid A, Herbin M, Hackert R, Maes L, Martin V (2007) Experimental study of coordination patterns during unsteady locomotion in mammals. J Exp Biol 210:366–372. 10.1242/jeb.02632 - DOI - PubMed
    1. Abraham LD, Marks WB, Loeb GE (1985) The distal hindlimb musculature of the cat: cutaneous reflexes during locomotion. Exp Brain Res 58:594–603. 10.1007/BF00235875 - DOI - PubMed
    1. Baken BC, Dietz V, Duysens J (2005) Phase-dependent modulation of short latency cutaneous reflexes during walking in man. Brain Res 1031:268–275. 10.1016/j.brainres.2004.10.058 - DOI - PubMed
    1. Bellardita C, Kiehn O (2015) Phenotypic characterization of speed-associated gait changes in mice reveals modular organization of locomotor networks. Curr Biol 25:1426–1436. 10.1016/j.cub.2015.04.005 - DOI - PMC - PubMed
    1. Bolton DA, Misiaszek JE (2009) Contribution of hindpaw cutaneous inputs to the control of lateral stability during walking in the cat. J Neurophysiol 102:1711–1724. 10.1152/jn.00445.2009 - DOI - PubMed

Publication types