. 2017 Apr 12;37(15):4032-4045.
doi: 10.1523/JNEUROSCI.2626-16.2017. Epub 2017 Mar 14.

Functional Organization of Vestibulo-Ocular Responses in Abducens Motoneurons

Affiliations

Functional Organization of Vestibulo-Ocular Responses in Abducens Motoneurons

Haike Dietrich et al. J Neurosci. .

Abstract

Vestibulo-ocular reflexes (VORs) are the dominating contributors to gaze stabilization in all vertebrates. During horizontal head movements, abducens motoneurons form the final element of the reflex arc that integrates visuovestibular inputs into temporally precise motor commands for the lateral rectus eye muscle. Here, we studied a possible differentiation of abducens motoneurons into subtypes by evaluating their morphology, discharge properties, and synaptic pharmacology in semi-intact in vitro preparations of larval Xenopus laevis Extracellular nerve recordings during sinusoidal head motion revealed a continuum of resting rates and activation thresholds during vestibular stimulation. Differences in the sensitivity to changing stimulus frequencies and velocities allowed subdividing abducens motoneurons into two subgroups, one encoding the frequency and velocity of head motion (Group I), and the other precisely encoding angular velocity independent of stimulus frequency (Group II). Computational modeling indicated that Group II motoneurons are the major contributor to actual eye movements over the tested stimulus range. The segregation into two functional subgroups coincides with a differential activation of glutamate receptor subtypes. Vestibular excitatory inputs in Group I motoneurons are mediated predominantly by NMDA receptors and to a lesser extent by AMPA receptors, whereas an AMPA receptor-mediated excitation prevails in Group II motoneurons. Furthermore, glycinergic ipsilateral vestibular inhibitory inputs are activated during the horizontal VOR, whereas the tonic GABAergic inhibition is presumably of extravestibular origin. These findings support the presence of physiologically and pharmacologically distinct functional subgroups of extraocular motoneurons that act in concert to mediate the large dynamic range of extraocular motor commands during gaze stabilization.SIGNIFICANCE STATEMENT Outward-directed gaze-stabilizing eye movements are commanded by abducens motoneurons that combine different sensory inputs including signals from the vestibular system about ongoing head movements (vestibulo-ocular reflex). Using an amphibian model, this study investigates whether different types of abducens motoneurons exist that become active during different types of eye movements. The outcome of this study demonstrates the presence of specific motoneuronal populations with pharmacological profiles that match their response dynamics. The evolutionary conservation of the vestibulo-ocular circuitry makes it likely that a similar motoneuronal organization is also implemented in other vertebrates. Accordingly, the physiological and pharmacological understanding of specific motoneuronal contributions to eye movements might help in designing drug therapies for human eye movement dysfunctions such as abducens nerve palsy.

Keywords: GABA; extraocular motoneurons; glutamate; glycine; semicircular canal; vestibulo-ocular reflex.


Figures

Figure 1.
Figure 1.
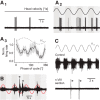
Anatomical organization of the abducens nucleus in larval X. laevis. A, Horizontal confocal reconstruction of a hindbrain whole-mount preparation of a stage 54 tadpole depicting retrogradely labeled abducens motoneurons in r5 after unilateral (A1, A3) or bilateral (A2) application of Alexa Fluor 488 dextran to the VIth motor nerve(s) at the level of the LR muscle; brainstem-crossing fibers, visualized by 633 nm illumination (magenta-colored crossing fibers in A1), indicate the center of r1–7, respectively; inset in A1 is a higher magnification of the outlined area (VI). The location of the trochlear nucleus (IV) is indicated in A1. Note that the two green fiber bundles in A2 represent the bilateral VIth motor nerves (n.VI) traversing rostrally beneath the ventral surface of the hindbrain. r, rostral; c, caudal. B, Somal size (cross-sectional area, B1) and circularity (B2) distributions of retrogradely labeled abducens motoneurons (n = 275); circularity of 1 indicates a round cell body. C, D, Dependency of somal size (C) and circularity (D) on the mediolateral (C1, D1) and rostrocaudal (C2, D2) motoneuronal position within the abducens nucleus; positions were normalized to the most medial/rostral (0) and most lateral/caudal (1) part of the nucleus, respectively.
Figure 2.
Figure 2.
Semi-intact X. laevis preparations for electrophysiological recordings and pharmacological perturbations of extraocular motor nerve activity. A, Photomicrographs, depicting in A1 an isolated head of a stage 54 tadpole secured to the Sylgard floor of the recording chamber with three pins (fix. pin), with intact inner ears, CNS, and eyes and, in A2, the extraocular motor innervation of eye muscles. B, Schematics of the semi-intact preparation, indicating LR (VI) and SO (IV) nerve recording electrodes and the pipette for pressure injection of drugs into the abducens nucleus and of a hindbrain cross-section (cs) at r5, depicting the injection electrode path (bottom right); curved double arrows indicate horizontal turntable rotation. C, Representative multiunit abducens nerve discharge (black trace) and the activity of extracted single units (red and blue traces) based on spike shape analysis. D, E, Spike templates (s.u. 1 and s.u. 2 in D) of the two single units isolated in C and graphical illustration of the principal component analysis (PC1, PC2) used for the spike sorting with respect to spike shape and amplitude (E). ON, Optic nerve. Dashed gray sine wave in C indicates head motion stimulus velocity (Hvel). Photograph in A2 was modified from Lambert et al., 2008.
Figure 3.
Figure 3.
Discharge properties of silent and spontaneously active abducens motor units. A, Representative examples of units with moderate (A1) and low (red arrowheads in A2) spontaneous activity and a typical silent unit (blue arrowhead in A2) at rest (left traces in A1, A2) and during multiple cycles of horizontal sinusoidal head rotation (right traces in A1, A2). B, Histogram depicting the distribution of neuronal firing rates at rest; the distribution between 0 and 1 spikes/s (light green bar) is plotted at an extended scale in the inset; the dark green bar indicates units that were silent at rest. C, Correlation between the mean interspike interval (ISI) and CV2 in C1 for all spontaneously active units and in C2 for units with a resting discharge between 1 and 10 Hz (gray area in C1; n = 33). Color code in C2: Red, Group I units, blue: Group II units, black: unspecified units recorded only at a single motion stimulus frequency (0.5 Hz). D, Average firing rate modulation (±SEM, shaded areas) of a population of spontaneously active (sa; D1) and silent (s; D2) motor units over a single motion cycle at 0.5 Hz and different stimulus peak velocities. E, Linear correlation between the resting rate and modulation depth of spontaneously active neurons during rotation at 0.5 Hz with a peak velocity of ±30°/s (n = 41). Inset depicts differences in activation threshold (Act. thr.) between silent (s) and spontaneously active (sa) units. Dashed gray sine waves in D indicate head motion stimulus velocity (Hvel).
Figure 4.
Figure 4.
Discharge properties of Group I and Group II abducens motor units. A, B, Average rotation-evoked firing rate modulation (±SEM, shaded areas) of spontaneously active (sa) Group I (A1, n = 12) and Group II (A2, n = 10) and silent (s) Group I (B1, n = 7) and Group II (B2, n = 6) motor units over a single rotation cycle at a stimulus frequency of 0.5 Hz and varying peak velocities (left in A1, A2), at a stimulus peak velocity of ±30°/s and varying frequencies (middle in A1, A2; B1, B2) and at different peak amplitude/frequency combinations that always drive the eye to the same eccentric position (right in A1, A2); dashed gray sine waves indicate head motion stimulus velocity (Hvel). C, D, Dependency of the maximal discharge modulation depth (C1, C2, D1, D2) and phase re stimulus velocity (C3, C4, D3, D4) of rotation-evoked responses (±SEM) on stimulus peak velocity (C1, C3, D1, D3) and frequency (C2, C4, D2, D4) in spontaneously active (C) and silent (D) Group I (black) and Group II (red) motor units.
Figure 5.
Figure 5.
Discharge properties of non-VOR abducens motor units. A, Representative example of a non-VOR unit at rest (A1) and during sinusoidal head rotation over multiple rotation cycles at 0.5 Hz and ±60°/s peak velocity (A2) with its average response over a single cycle (A3). B, Representative example of a multiunit abducens nerve discharge during multiple cycles of head rotation at 0.5 Hz and ±30°/s peak velocity. Note that non-VOR units (*) have the largest spike amplitudes. C, Representative example of a multiunit abducens nerve discharge during multiple rotation cycles before and after contralateral VIIIth nerve transection. Note that a single non-VOR unit remains active after the lesion (*). Dashed sine waves in A3 and red and gray sine waves in B and C indicate head motion stimulus velocity (Hvel). Calibration bar in A1 also applies to A2.
Figure 6.
Figure 6.
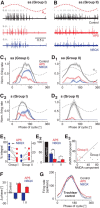
Excitatory neurotransmitter profile of Group I and Group II abducens motor units. A, B, Representative examples of spontaneously active Group I (A) and Group II (B) units before and after focal injection of D-AP5 (red, 500 μm) and NBQX (blue, 10 μm) into the respective abducens nucleus. Single units (s.u., gray traces) were identified by spike sorting. C, D, Average normalized firing rate modulation over a single rotation cycle (±SEM, shaded areas) of representative spontaneously active (sa; C1, D1) and silent (s; C2, D2) Group I (C) and Group II (D) abducens motor units at a stimulus frequency of 0.5 Hz and peak velocity of ±30°/s before and after D-AP5 (red) and NBQX (blue) injection into the respective abducens nucleus. E, Dot plot illustrating the relative change in the area under the curve after D-AP5 and NBQX injection for individual Group I and II motoneurons (E1); bar charts depicting the average (±SEM) residual components of the respective response integrals (E2) and correlation of AMPA and NMDA components in Group I (black) and II (red) motoneurons (E3); note that the separation line has a slope of 1. F, Phase shifts of the response peaks after NMDA (D-AP5, red) and AMPA (NBQX, blue) receptor blockade in spontaneously active (sa) and silent (s) Group I and Group II abducens motoneurons. G, Representative example of a trochlear control recording before and after D-AP5 and NBQX injection into the abducens nucleus. Dashed gray sine waves in AD indicate head motion stimulus velocity (Hvel).
Figure 7.
Figure 7.
Inhibitory neurotransmitter profile of abducens motor units. A, B, Representative example of a multiunit abducens nerve discharge over multiple rotation cycles (A) and average responses (B) over a single cycle (n = 3, ±SEM, shaded areas) before (black) and after surgical removal of the ipsilateral horizontal (hor) canal cupula (red). C, Schematic of a semi-intact preparation depicting the recording and stimulation paradigm, ipsilateral neuronal VOR connections and the removal of crossed excitatory vestibular inputs to abducens motoneurons by midline section (dotted line). D, Inhibitory modulation of average multiunit abducens nerve responses over a single motion cycle (n = 6, ±SEM, shaded areas) at 0.5 Hz and different stimulus velocities of head rotation after midline section. E, F, Representative example (E) and average responses (F) over a single motion cycle (n = 6, ±SEM, shaded areas) of the multiunit abducens nerve discharge before (control, black) after midline section (blue) and subsequent focal strychnine (10 μm) injection into the respective abducens nucleus (red). For comparison, average control responses over a single rotation cycle in the intact preparation are indicated in the inset in F. G, H, Representative example (G) and average responses (H) over a single motion cycle (n = 7 single units, ±SEM, shaded areas) of isolated single units before (black) and after focal injection of gabazine (10 μm) into the respective abducens nucleus. Dotted lines in H represent average responses of spontaneously active units (three of seven). The bar chart in the inset in H shows the average increase in firing rate of all single units (n = 7, ±SEM) at different peak stimulus velocities (at 0.5 Hz). abd, Abducens; cup, cupula; VN, vestibular nucleus. Gray (dashed) sine waves in A, B, and EH indicate head motion stimulus velocity (Hvel).
Figure 8.
Figure 8.
Computational modeling of eye movements. A, Schematic depicting video recordings of eye movements in semi-intact X. laevis tadpole preparations during horizontal sinusoidal head rotation. B, Averaged eye positions (green, Eyepos) and corresponding sinusoidal fits (blue, sine fit) over a single cycle of sinusoidal head rotation at three different frequencies (at ±30°/s peak velocity). C, Schematic view of the model used to evaluate whether observed motoneuronal spike patterns sufficiently explain eye movement behavior. Left, Spikes recorded from different motoneurons; black: original recordings; red: 180° shifted version to account for the innervation of the antagonistic muscle. Middle, Time courses of simulated muscle contractions derived from spike trains in the left column. Right, Weighted sum (positive weights, wi) of muscle contractions fitted to original VOR eye movement recordings (green trace) in response to head rotation (black dashed trace) and resultant simulations of eye movements (blue trace). D, Contributions of Group I (blue) and Group II (magenta) motor units to the simulation of actual eye movements (green, Eyepos) at 0.1, 0.5, and 1 Hz head rotation. E, Explained variances for eye movement simulations from all neurons (black) and contributions of Group I (blue), Group II (magenta), spontaneously active (sa, gray), or silent (s, gray) abducens motor units to overall explained variance. Gray sine waves and dashed black/green vertical lines in B indicate head motion stimulus position (Hpos) and phase relation of the responses, respectively.
Figure 9.
Figure 9.
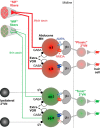
Schematic summarizing the actual and putative anatomical and pharmacological features of X. laevis abducens motoneurons. Spontaneously active (sa) or silent (s) abducens motoneurons (MN) distinguish into two subgroups according to differences in response magnitude and timing. AMPA and NMDA response components are inversely correlated in Group I and II motoneurons, respectively. The vestibular excitation of Group I motoneurons consists of a smaller AMPA (light blue) and larger NMDA (dark red) receptor contribution, whereas in Group II motoneurons, the AMPA component (dark blue) considerably surmounts the NMDA (light red) receptor contribution. All motoneurons receive a tonic GABAergic input, whereas the modulated glycinergic ipsilateral vestibular inhibition is discernable only in spontaneously active motoneurons. Based on previous studies (Straka et al., 2009), it appears likely that silent and spontaneously active motoneurons receive excitatory inputs from phasic and tonic 2° vestibular neurons (VN) respectively and mediate these signals separately onto singly (SIF) and multiply innervated (MIF) extraocular muscle fibers. sa I and II, spontaneously active Group I and II abducens motoneurons; s I and II, silent Group I and II abducens motoneurons.

Similar articles

Cited by

References

    1. Beraneck M, Pfanzelt S, Vassias I, Rohregger M, Vibert N, Vidal PP, Moore LE, Straka H (2007) Differential intrinsic response dynamics determine synaptic signal processing in frog vestibular neurons. J Neurosci 27:4283–4296. 10.1523/JNEUROSCI.5232-06.2007 - DOI - PMC - PubMed
    1. Birch PJ, Grossman CJ, Hayes AG (1988) 6,7-Dinitro-quinoxaline-2,3-dion and 6-nitro,7-cyano-quinoxaline-2,3-dion antagonise responses to NMDA in the rat spinal cord via an action at the strychnine-insensitive glycine receptor. Eur J Pharmacol 156:177–180. 10.1016/0014-2999(88)90163-X - DOI - PubMed
    1. Branoner F, Straka H (2015) Semicircular canal-dependent developmental tuning of translational vestibulo-ocular reflexes in Xenopus laevis. Dev Neurobiol 75:1051–1067. 10.1002/dneu.22234 - DOI - PubMed
    1. Broussard DM, DeCharms RC, Lisberger SG (1995) Inputs from the ipsilateral and contralateral vestibular apparatus to behaviorally characterized abducens neurons in rhesus monkeys. J Neurophysiol 74:2445–2459. - PubMed
    1. Büttner-Ennever JA, Horn AK (2002) Oculomotor system: a dual innervation of the eye muscles from the abducens, trochlear, and oculomotor nuclei. Mov Disord 17:S2–S3. - PubMed

Publication types

LinkOut - more resources