. 2017 Mar 28;114(13):3497-3502.
doi: 10.1073/pnas.1702663114. Epub 2017 Mar 14.

Small molecule selectively suppresses MYC transcription in cancer cells

Affiliations

Small molecule selectively suppresses MYC transcription in cancer cells

Claire Bouvard et al. Proc Natl Acad Sci U S A. .

Abstract

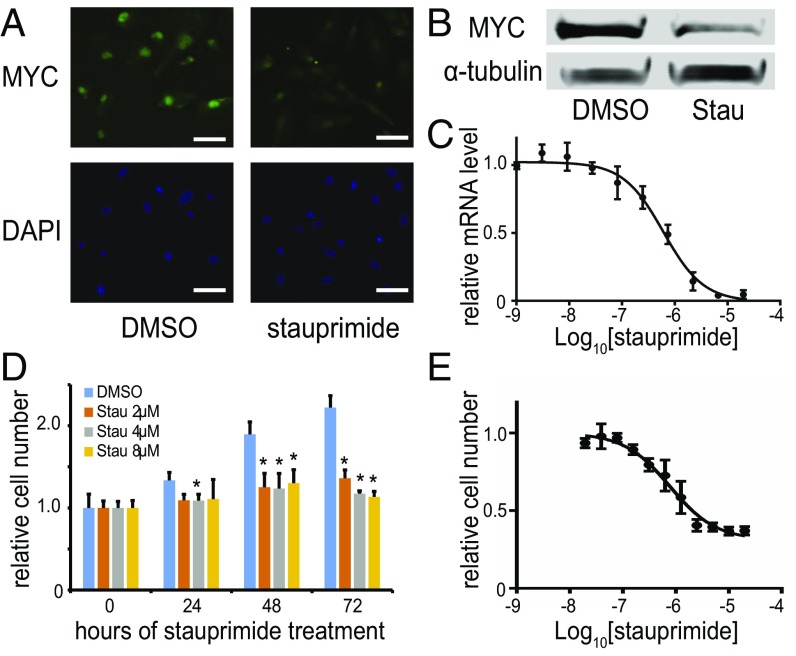
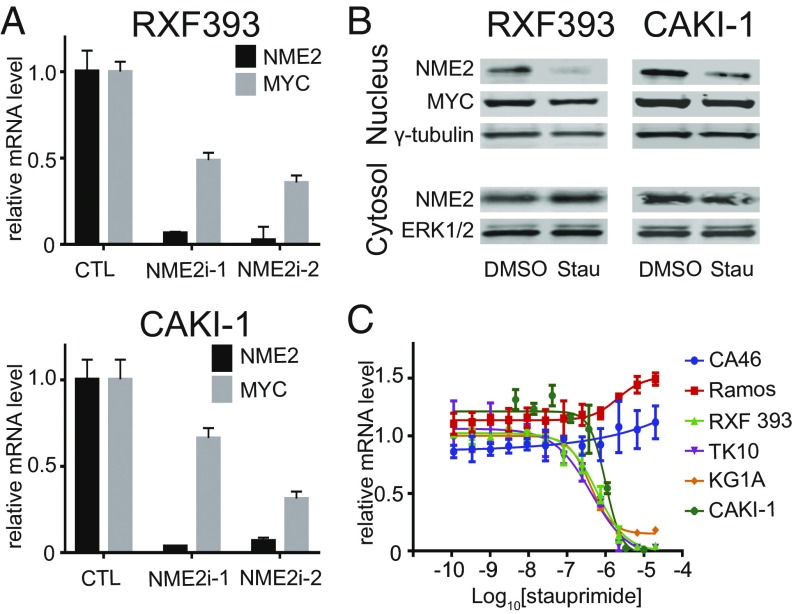
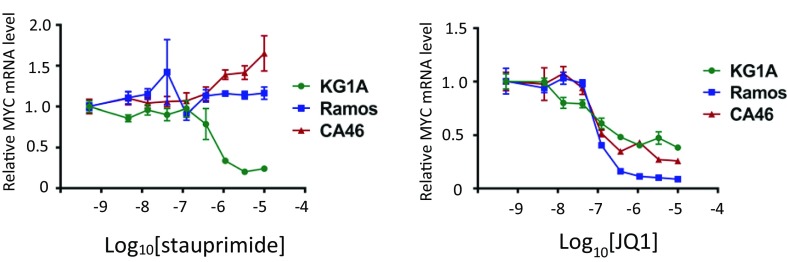
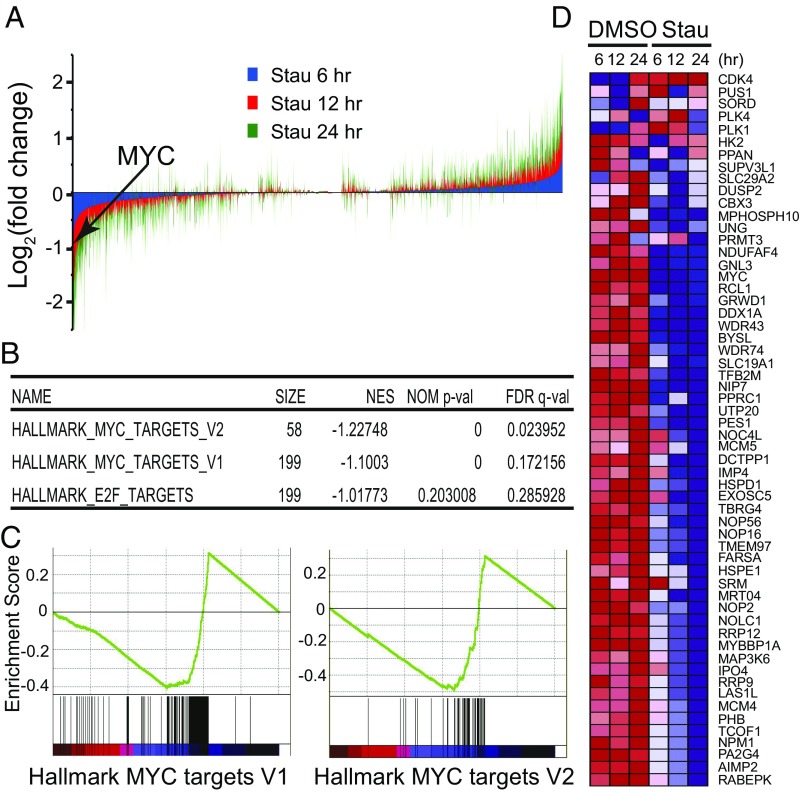
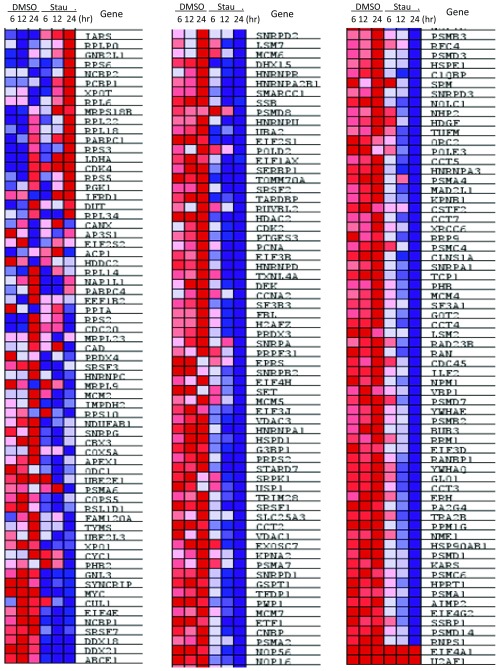
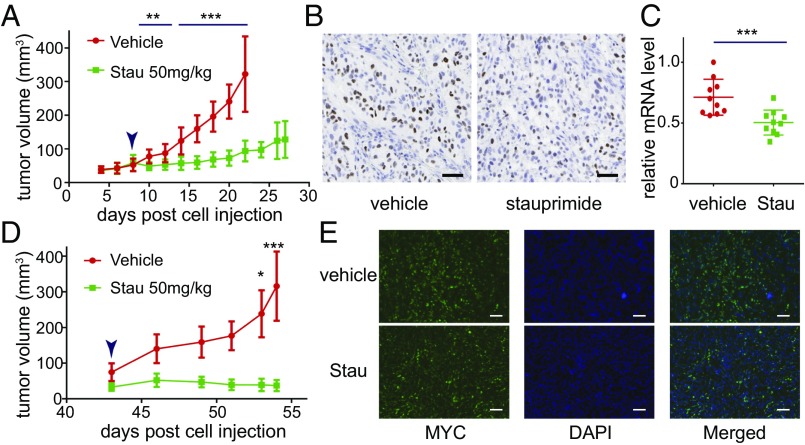
Stauprimide is a staurosporine analog that promotes embryonic stem cell (ESC) differentiation by inhibiting nuclear localization of the MYC transcription factor NME2, which in turn results in down-regulation of MYC transcription. Given the critical role the oncogene MYC plays in tumor initiation and maintenance, we explored the potential of stauprimide as an anticancer agent. Here we report that stauprimide suppresses MYC transcription in cancer cell lines derived from distinct tissues. Using renal cancer cells, we confirmed that stauprimide inhibits NME2 nuclear localization. Gene expression analysis also confirmed the selective down-regulation of MYC target genes by stauprimide. Consistent with this activity, administration of stauprimide inhibited tumor growth in rodent xenograft models. Our study provides a unique strategy for selectively targeting MYC transcription by pharmacological means as a potential treatment for MYC-dependent tumors.

Keywords: MYC; NME2; cancer; nuclear localization; stauprimide.


Conflict of interest statement

The authors declare no conflict of interest.

Figures

Fig. 1.
Fig. 1.
Stauprimide suppresses MYC transcription in cancer cells. (A) Immunostaining of MYC in RXF 393 cells treated by stauprimide (5 μM) or DMSO for 24 h; nuclei were stained with DAPI. (Scale bars: 50 μm.) (B) Western blot of RXF 393 cell lysate for MYC upon stauprimide (5 μM) treatment for 24 h; α-tubulin was used as a loading control. (C) qRT-PCR for MYC mRNA in RXF 393 cells treated with stauprimide for 6 h in dose–response format. (D) Proliferation of RXF 393 cells upon stauprimide treatment at indicated concentrations assessed at various time points. Asterisk indicates statistically significant difference compared with DMSO-treated controls, P < 0.05. (E) Dose–response of RXF 393 cell proliferation to stauprimide treatment measured at 72 h. All data are presented as mean ± SD, n = 3.
Fig. 2.
Fig. 2.
NME2-mediated MYC transcription is inhibited by stauprimide in cancer cells. (A) qRT-PCR analysis of NME2 and MYC mRNA levels in RXF 393 and CAKI-1 renal cancer cells following transfection of NME2 targeting siRNAs in the cells. (B) Western blotting of indicated proteins for nuclear and cytosolic fractions of RXF 393 and CAKI-1 cell lysates upon stauprimide treatment (5 μM) for 3 h. (C) qRT-PCR for MYC mRNA in indicated cell lines treated with stauprimide for 6 h in dose–response format.
Fig. S1.
Fig. S1.
Dose–response of MYC mRNA levels upon stauprimide and JQ1 treatment in CA46, RAMOS, and KG1A cells. The cells were treated with compounds at indicated concentrations for 6 h. mRNA was extracted and analyzed by qRT-PCR for MYC; GAPDH was used as control for normalization. Data are presented as mean ± SD.
Fig. 3.
Fig. 3.
Stauprimide selectively suppresses MYC target gene transcription. (A) Genome-wide gene expression analysis by mRNA-seq upon stauprimide treatment (5 μM) in RXF 393 cells at 6, 12, and 24 h time points. The expression levels of each gene were normalized to the total mRNA abundance of each sample and compared with that of DMSO-treated controls. (B) The list of the top gene sets that are enriched over the time course of stauprimide treatment. GSEA analysis was performed using HALLMARK gene set database. (C) Enrichment plot of genes in HALLMARK_MYC_TARGETS_V1 and HALLMARK-MYC_TARGETS_V2 gene sets during the time course of stauprimide treatment. (D) Heat map of the mRNA levels of the genes listed in the HALLMARK_MYC_TARGETS_V2 gene set during the time course of stauprimide treatment.
Fig. S2.
Fig. S2.
Heat map of mRNA levels of genes in the HALLMARK_MYC_target_V1 gene set.
Fig. S3.
Fig. S3.
Plasma stauprimide levels upon oral administration in the initial PK study and the tolerability study. (A) Plasma stauprimide levels in the initial PK study. Stauprimide was administered as single dose at 20 mg/kg in 75% (vol/vol) PEG300; 25% (vol/vol) D5W. (B) Plasma stauprimide levels in the tolerability study. Samples were collected following the last dose in a 7-d, once-per-day dosing scheme. Stauprimide was orally administered at 50 mg/kg. Each line represents one animal in the dosing group.
Fig. 4.
Fig. 4.
Stauprimide inhibits tumor growth in xenograft tumor models. (A) Tumor volume measurement of RXF 393 cells injected s.c. into NOD/SCID mice and treated with stauprimide (50 mg/kg, once per day) or with vehicle [75% (vol/vol) PEG300; 25% (vol/vol) D5W], n = 10/group. (B) Immunohistochemistry staining of tumor samples using anti-MYC antibody at the end of the dosing period of A. (Scale bars: 100 μm.) (C) qRT-PCR analysis of human MYC mRNA in tumor samples at the end of the dosing period of A; mRNA abundance was normalized to human GAPDH. (D) Tumor volume measurement of CAKI-1 cells injected s.c. into NOD/SCID mice treated with stauprimide (50 mg/kg, once per day) or with vehicle [75% (vol/vol) PEG300; 25% (vol/vol) D5W], n = 5/group. (E) Fluorescent immunostaining of tumor samples using anti-MYC antibody at the end of dosing period of D. (Scale bars: 100 μm.) Arrowheads in A and D indicate the start of dosing. All data are presented as mean ± SD; statistical analyses were carried out using t test, *P < 0.05, **P < 0.01, ***P < 0.001.
Fig. S4.
Fig. S4.
Body weight of mice treated with stauprimide in the xenograft model with RXF 393 cell injection. Arrow indicates the time dosing was started. Data are presented as mean ± SD, n = 10.

Similar articles

Cited by

References

    1. Nie Z, et al. c-Myc is a universal amplifier of expressed genes in lymphocytes and embryonic stem cells. Cell. 2012;151(1):68–79. - PMC - PubMed
    1. Soucek L, Evan GI. The ups and downs of Myc biology. Curr Opin Genet Dev. 2010;20(1):91–95. - PMC - PubMed
    1. Fernandez PC, et al. Genomic targets of the human c-Myc protein. Genes Dev. 2003;17(9):1115–1129. - PMC - PubMed
    1. Dang CV, O’donnell KA, Juopperi T. The great MYC escape in tumorigenesis. Cancer Cell. 2005;8(3):177–178. - PubMed
    1. Kim S, et al. MYC and BCL2 overexpression is associated with a higher class of Memorial Sloan-Kettering Cancer Center prognostic model and poor clinical outcome in primary diffuse large B-cell lymphoma of the central nervous system. BMC Cancer. 2016;16:363. - PMC - PubMed

Publication types

MeSH terms

Substances

LinkOut - more resources