

Diagnosis of prostate cancer by desorption electrospray ionization mass spectrometric imaging of small metabolites and lipids
- PMID: 28292895
- PMCID: PMC5380053
- DOI: 10.1073/pnas.1700677114
Diagnosis of prostate cancer by desorption electrospray ionization mass spectrometric imaging of small metabolites and lipids
Abstract
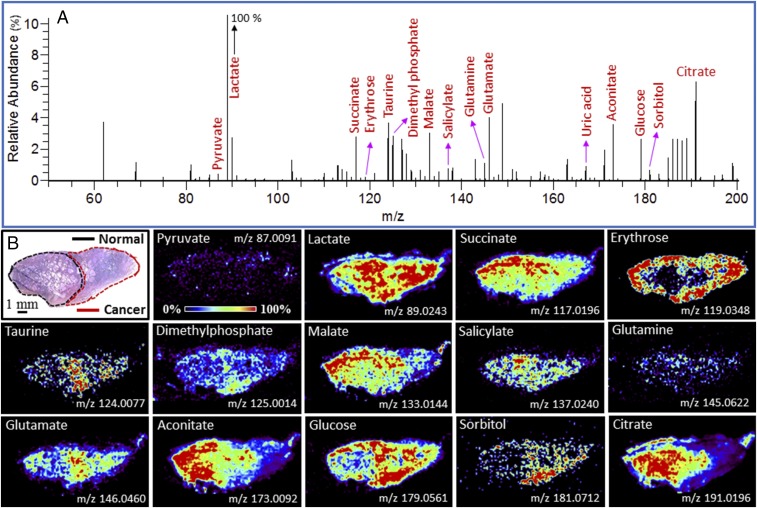
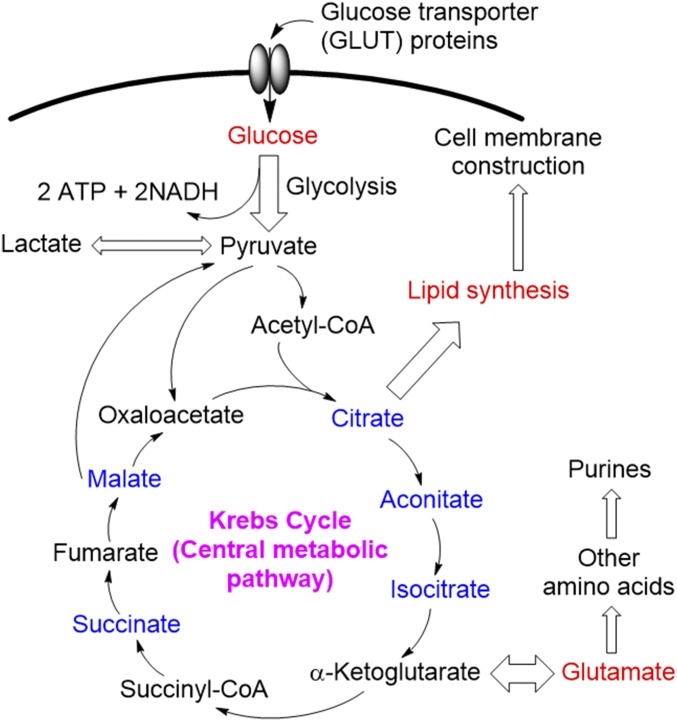
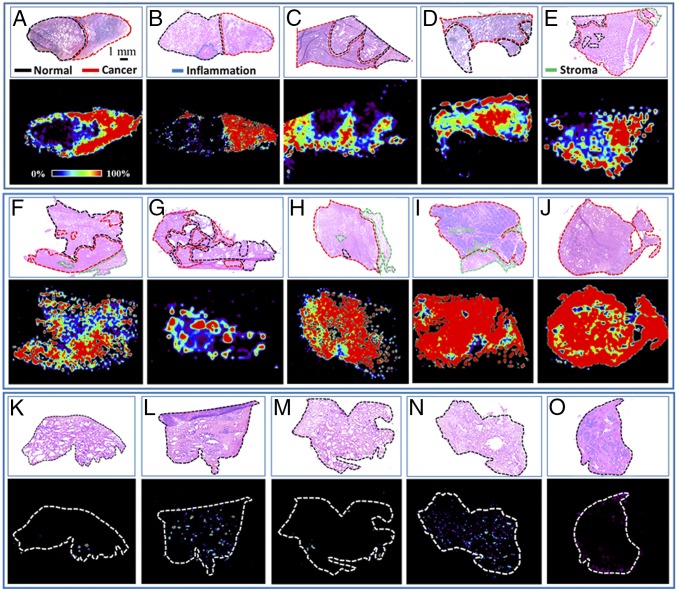
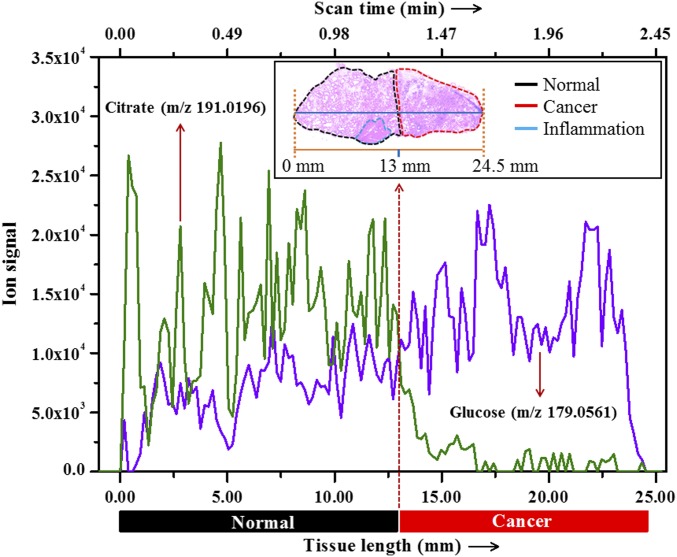
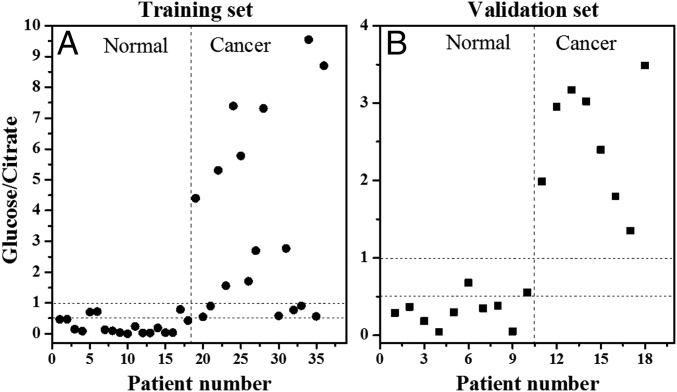
Accurate identification of prostate cancer in frozen sections at the time of surgery can be challenging, limiting the surgeon's ability to best determine resection margins during prostatectomy. We performed desorption electrospray ionization mass spectrometry imaging (DESI-MSI) on 54 banked human cancerous and normal prostate tissue specimens to investigate the spatial distribution of a wide variety of small metabolites, carbohydrates, and lipids. In contrast to several previous studies, our method included Krebs cycle intermediates (m/z <200), which we found to be highly informative in distinguishing cancer from benign tissue. Malignant prostate cells showed marked metabolic derangements compared with their benign counterparts. Using the "Least absolute shrinkage and selection operator" (Lasso), we analyzed all metabolites from the DESI-MS data and identified parsimonious sets of metabolic profiles for distinguishing between cancer and normal tissue. In an independent set of samples, we could use these models to classify prostate cancer from benign specimens with nearly 90% accuracy per patient. Based on previous work in prostate cancer showing that glucose levels are high while citrate is low, we found that measurement of the glucose/citrate ion signal ratio accurately predicted cancer when this ratio exceeds 1.0 and normal prostate when the ratio is less than 0.5. After brief tissue preparation, the glucose/citrate ratio can be recorded on a tissue sample in 1 min or less, which is in sharp contrast to the 20 min or more required by histopathological examination of frozen tissue specimens.
Keywords: Krebs cycle; desorption electrospray ionization; mass spectrometry; metabolism; prostate cancer.
Conflict of interest statement
The authors declare no conflict of interest.
Figures
Comment in
-
Diagnosis: Making DESI-MSI desirable.Nat Rev Urol. 2017 Jun;14(6):325. doi: 10.1038/nrurol.2017.46. Epub 2017 Mar 29. Nat Rev Urol. 2017. PMID: 28352134 No abstract available.
References
-
- Siegel RL, Miller KD, Jemal A. Cancer statistics, 2015. CA Cancer J Clin. 2015;65(1):5–29. - PubMed
-
- Yossepowitch O, et al. Positive surgical margins in radical prostatectomy: Outlining the problem and its long-term consequences. Eur Urol. 2009;55(1):87–99. - PubMed
-
- Brooks JD, et al. The impact of tumor volume on outcomes after radical prostatectomy: Implications for prostate cancer screening. Open Prostate Cancer J. 2008;1:1–8.
-
- Erguvan-Dogan B, et al. Specimen radiography in confirmation of MRI-guided needle localization and surgical excision of breast lesions. AJR Am J Roentgenol. 2006;187(2):339–344. - PubMed
Publication types
MeSH terms
Substances
Grants and funding
LinkOut - more resources
Full Text Sources
Other Literature Sources
Medical
