. 2017 Mar 28;114(13):E2672-E2681.
doi: 10.1073/pnas.1615883114. Epub 2017 Mar 14.

Fission yeast myosin I facilitates PI(4,5)P2-mediated anchoring of cytoplasmic dynein to the cortex

Affiliations

Fission yeast myosin I facilitates PI(4,5)P2-mediated anchoring of cytoplasmic dynein to the cortex

Jerrin Mathew Thankachan et al. Proc Natl Acad Sci U S A. .

Abstract

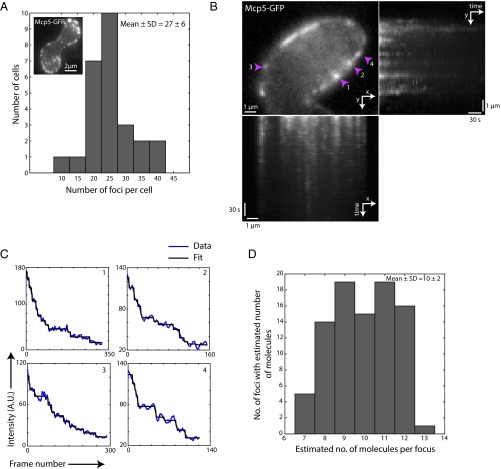
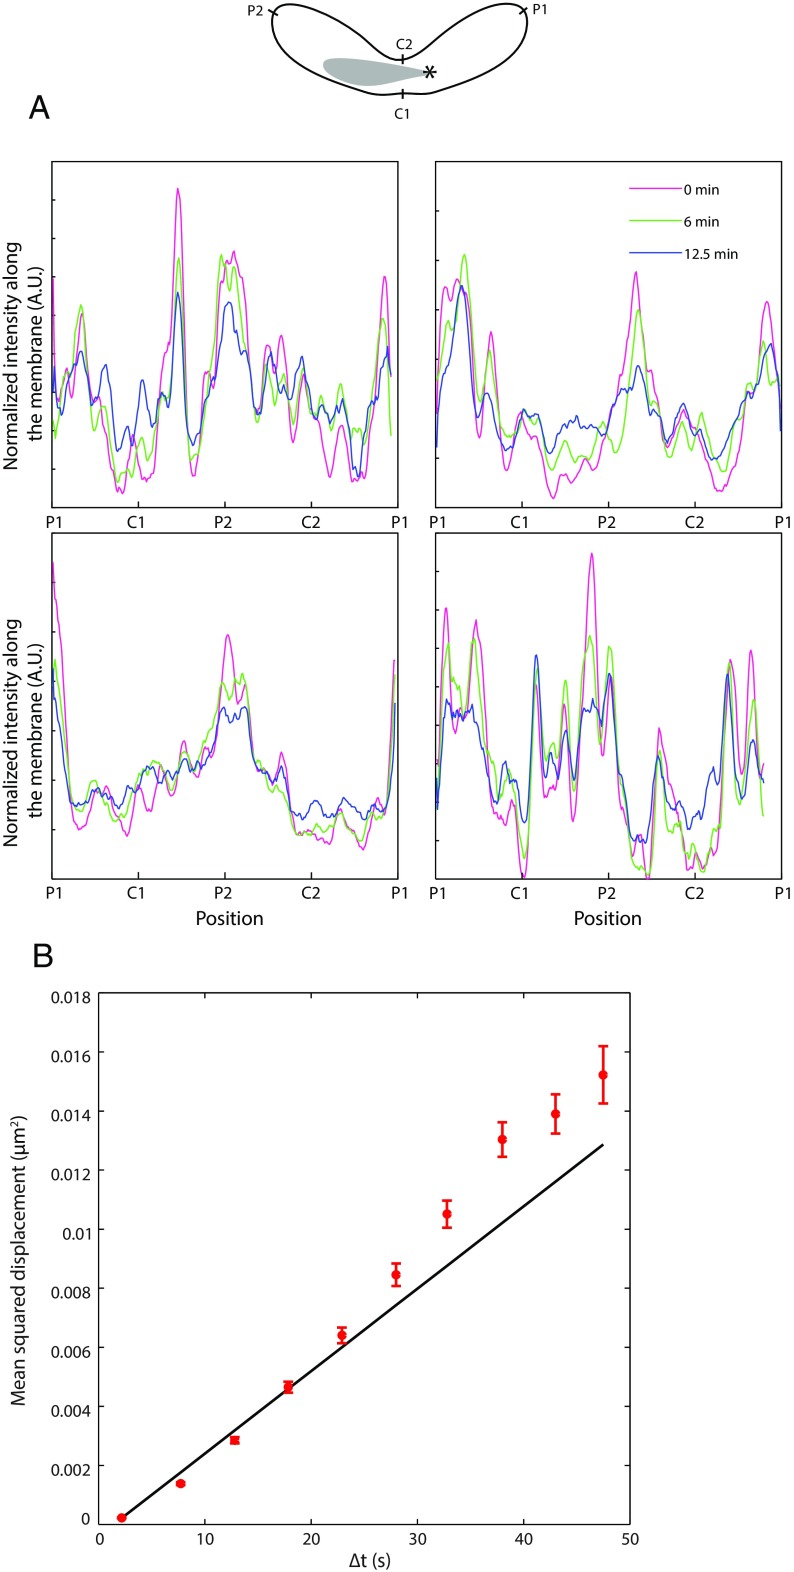
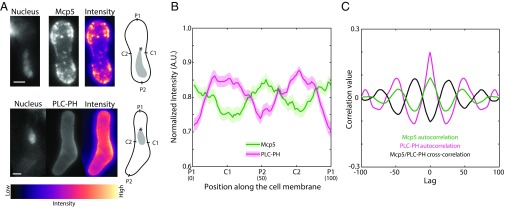
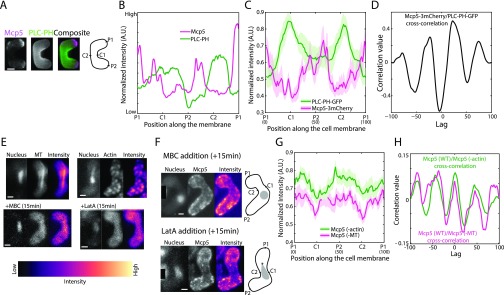
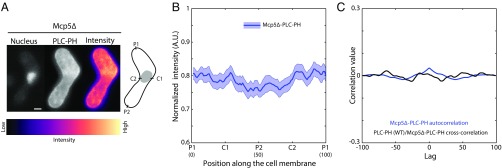
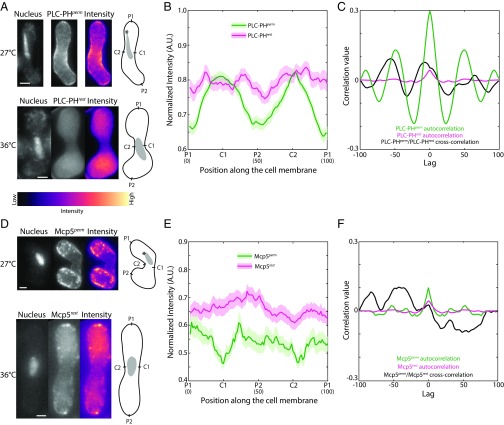
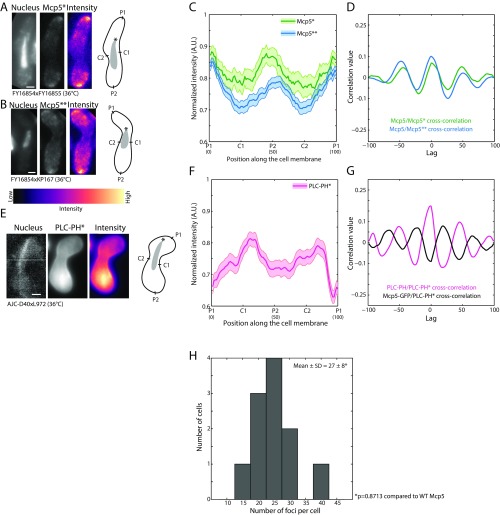
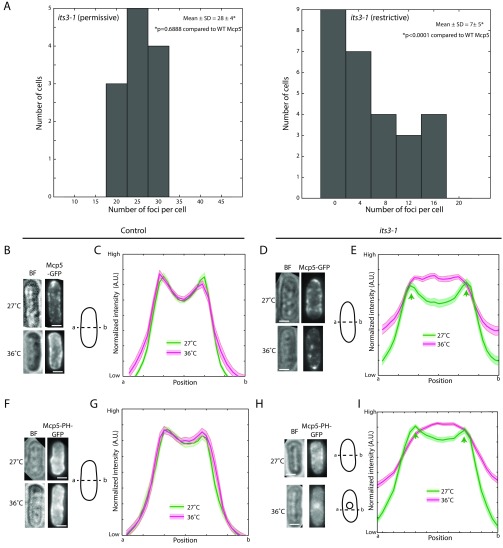
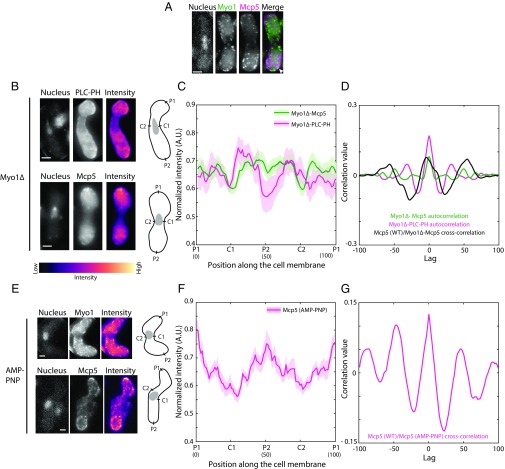
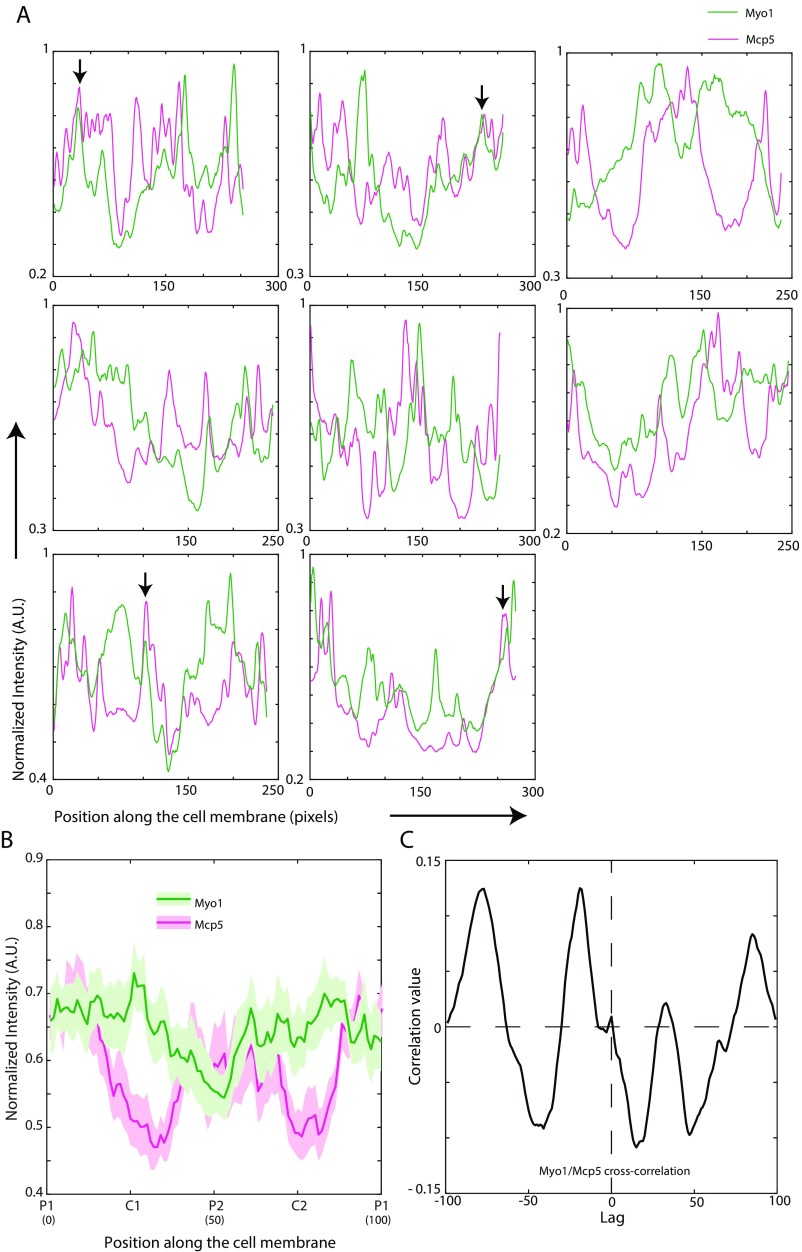
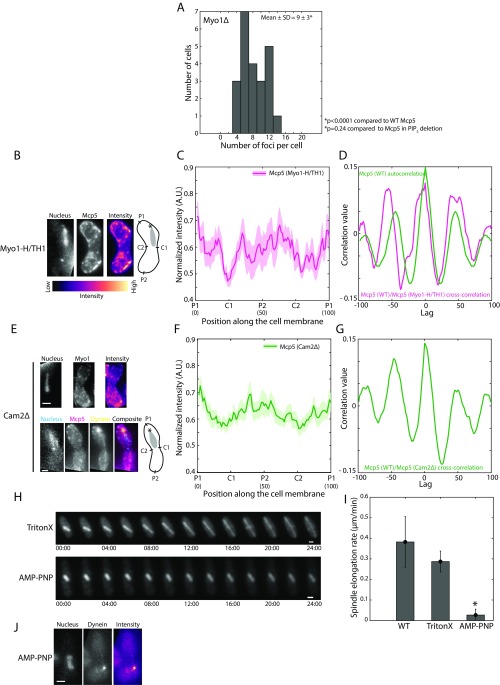
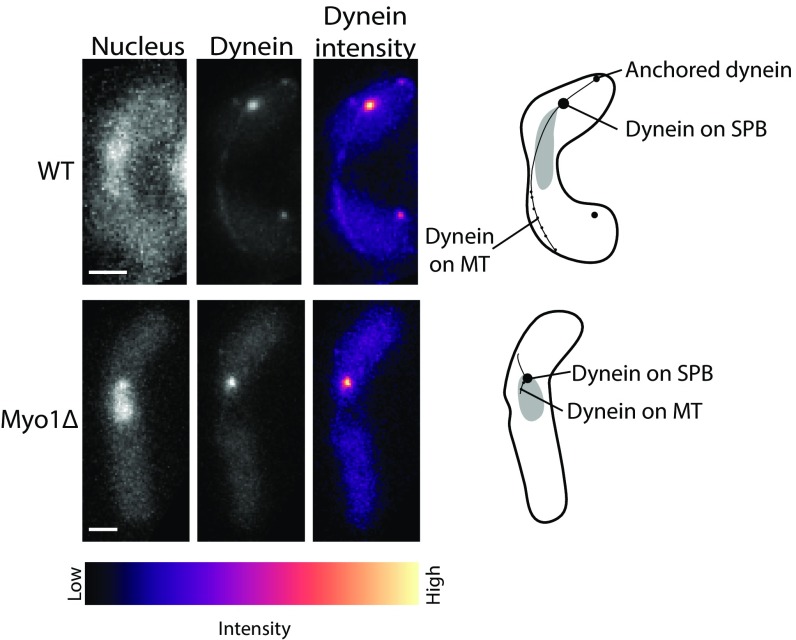
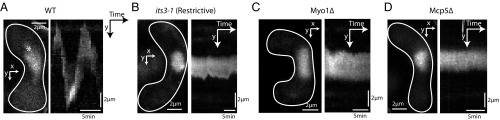
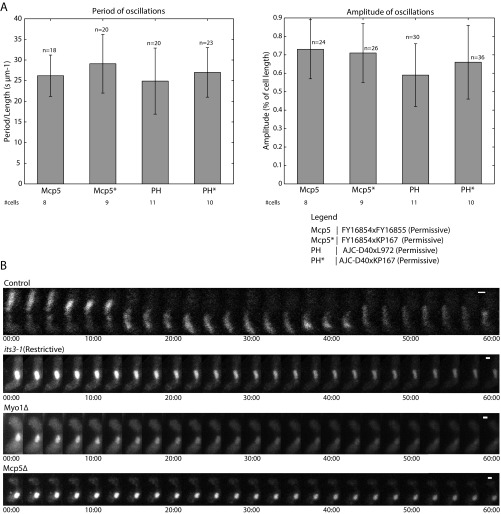
Several key processes in the cell, such as vesicle transport and spindle positioning, are mediated by the motor protein cytoplasmic dynein, which produces force on the microtubule. For the functions that require movement of the centrosome and the associated nuclear material, dynein needs to have a stable attachment at the cell cortex. In fission yeast, Mcp5 is the anchor protein of dynein and is required for the oscillations of the horsetail nucleus during meiotic prophase. Although the role of Mcp5 in anchoring dynein to the cortex has been identified, it is unknown how Mcp5 associates with the membrane as well as the importance of the underlying attachment to the nuclear oscillations. Here, we set out to quantify Mcp5 organization and identify the binding partner of Mcp5 at the membrane. We used confocal and total internal reflection fluorescence microscopy to count the number of Mcp5 foci and the number of Mcp5 molecules in an individual focus. Further, we quantified the localization pattern of Mcp5 in fission yeast zygotes and show by perturbation of phosphatidylinositol 4-phosphate 5-kinase that Mcp5 binds to phosphatidylinositol 4,5-bisphosphate [PI(4,5)P2]. Remarkably, we discovered that the myosin I protein in fission yeast, Myo1, which is required for organization of sterol-rich domains in the cell membrane, facilitates the localization of Mcp5 and that of cytoplasmic dynein on the membrane. Finally, we demonstrate that Myo1-facilitated association of Mcp5 and dynein to the membrane determines the dynamics of nuclear oscillations and, in essence, dynein activity.

Keywords: Mcp5; PIP2; cortical anchoring; cytoplasmic dynein; myosin I.


Conflict of interest statement

The authors declare no conflict of interest.

Figures

Fig. 1.
Fig. 1.
Each cluster of Mcp5 contains ∼10 molecules. (A) Inset shows a representative maximum intensity projection of a fission yeast zygote (strain FY16854xFY16855; Table S1) expressing Mcp5-GFP imaged using a confocal microscope; plot is the histogram of number of foci counted per cell versus number of cells with given number of foci. The mean ± SD of the number of foci per cell was estimated to be 27 ± 6 (n = 26 cells). (B) Enlarged portion of a zygote expressing Mcp5-GFP (strain FY16854xFY16855; Table S1) imaged using a TIRF microscope. The maximum intensity projection onto y axis along time is shown on Right of the image and the maximum intensity projection onto the x axis along time is shown Below. (C) The points 1, 2, 3, and 4 marked with the magenta arrowheads in B are shown as representative data for bleaching step analysis. The raw five-frame sliding average data (blue) are plotted alongside the fits obtained from STEPFINDER software (black). (D) The histogram of the estimated number of molecules per Mcp5 focus is plotted to obtain a mean ± SD of 10 ± 2 molecules per focus (n = 89 foci).
Fig. S1.
Fig. S1.
Mcp5 foci do not exhibit dynamics at long and short time scales. (A) Schematic of a fission yeast zygote depicting the positions P1, C1, P2, and C2 on the membrane (Top) and the characteristic normalized intensity profiles of Mcp5 along the membrane at 0 min (magenta), 6 min (green), and 12.5 min (blue). The peaks of intensity of Mcp5 remain relatively unchanged with time, indicating little dynamics/turnover of Mcp5 foci. (B) MSD analysis of Mcp5 foci as a function of the time lag (red, error bars represent SEM, n = 77 foci tracked for at least 100 s from 12 cells, strain FY16854 × FY16855; see Table S1). A weighted fit to the equation MSD = 2DΔt + offset (black) yielded a diffusion coefficient D of 6.9 × 10⁻⁵ ± 4.3 × 10⁻⁶ µm2/s.
Fig. 2.
Fig. 2.
Localization patterns of PLC-PH and Mcp5 on the membrane are complementary. (A) Confocal microscope images showing the maximum intensity projection of the Hoechst-stained nucleus (Top and Bottom Left), the summed intensity projection (Top and Bottom Center), and the intensity map (Top and Bottom Right) of a cell expressing fluorescent Mcp5 (strain FY16854xFY16855; Table S1) and PLC-PH (strain AJC-D40xL972; Table S1), respectively, and the schematics depicting the locations P1, C1, P2, and C2 along the membrane of the cell. The intensity range is shown below the images. The asterisk marks the position of the SPB with respect to the nucleus (gray). (Scale bar, 2 µm.) (B) The mean normalized intensity profiles of Mcp5 (green, n = 41 cells) and PLC-PH (magenta, n = 51 cells) along the positions P1, C1, P2, and C2 are plotted. The lighter shaded regions depict the SEM of the normalized intensity profiles. The numbers in parentheses below the plot indicate the bin number (SI Materials and Methods for details). (C) Autocorrelation analyses of Mcp5 signals (green) and PLC-PH signals (magenta) exhibit spatial periodicity, with Mcp5 signal being repeated at the poles and the PLC-PH signal at the centers. The intensity signals of Mcp5 and PLC-PH are inversely correlated (black), as can be seen from the negative correlation at zero lag.
Fig. S2.
Fig. S2.
Mcp5 and PLC-PH signals exhibit complementarity and Mcp5 clustering is not affected by perturbation of the cytoskeleton. (A) Confocal microscope images showing the maximum intensity projection of Mcp5-3mCherry (Left, magenta), PLC-PH-GFP (Center, green), and the composite (Right) alongside the schematic depicting the locations P1, C1, P2, and C2 along the membrane of the cell (strain VA026; see Table S1). (B) The normalized intensity profiles of Mcp5 (magenta) and PLC-PH (green) of the cell in A along the positions P1, C1, P2, and C2 are plotted. Mcp5 and PLC-PH localizations appear complementary. (C) The mean normalized intensity profiles of Mcp5 (magenta) and PLC-PH (green) from the same cells along the positions P1, C1, P2, and C2 are plotted (n = 6 cells). The lighter shaded regions depict the SEM of the intensity profile. The numbers in parentheses below the plot indicate the bin number (see SI Materials and Methods for details). (D) The cross-correlation analysis of Mcp5 and PLC-PH in this background (black) shows an inverse correlation as in Fig. 2C. (E) Confocal microscope images showing the maximum intensity projection of the Hoechst-stained nucleus (left image), the maximum intensity projection (center image), and intensity map (right image) of fission yeast zygotes expressing tubulin-GFP (Left, strain KI001 × L972; see Table S1) and Lifeact-GFP (Right, strain MMY1824 × L972; see Table S1), before and after the treatment with MBC (Left) and LatA (Right), respectively. (F) Confocal microscope images showing the maximum intensity projection of the Hoechst-stained nucleus (Left), the summed intensity projection (Center), and intensity map (Right) of fission yeast zygotes expressing fluorescent Mcp5 (strain FY16854 × FY16855; see Table S1) treated with MBC (Top) and LatA (Bottom; see SI Materials and Methods) and the schematics depicting the locations P1, C1, P2, and C2 along the membrane of the cell. The asterisk marks the position of the SPB with respect to the nucleus (gray). The intensity range is shown to the left of the images. (G) The mean normalized intensity profiles of Mcp5 in cells treated with MBC (magenta) and LatA (green) along the positions P1, C1, P2, and C2 are plotted (n = 8 and 11 cells, respectively). The lighter shaded regions depict the SEM of the intensity profiles. The numbers in parentheses below the plot indicate the bin number (see SI Materials and Methods for details). (H) Cross-correlation analyses of wild-type Mcp5 signal with that of Mcp5 signals in cells treated with MBC (magenta), and LatA (green) exhibit periodicity similar to that seen in Fig. 2C. (Scale bar, 2 µm.)
Fig. 3.
Fig. 3.
Preferential localization of PLC-PH to the cell centers is abolished in a cell devoid of Mcp5. (A) Confocal microscope images showing the maximum intensity projection of the Hoechst-stained nucleus (Left), the summed intensity projection (Center), and the intensity map (Right) of a Mcp5Δ cell expressing fluorescent PLC-PH (strain VA024; Table S1) and the schematic depicting the nucleus (gray), and locations P1, C1, P2, and C2 along the membrane of the cell. (Scale bar, 2 µm.) (B) The mean normalized intensity profile of PLC-PH (“Mcp5Δ-PLC-PH,” blue, n = 27 cells) along the positions P1, C1, P2, and C2 is plotted. The lighter shaded region depicts the SEM of the normalized intensity profile. The numbers in parentheses below the plot indicate the bin number (SI Materials and Methods for details). Unlike in Fig. 2B, PLC-PH’s membrane localization does not show preference to the center. (C) Autocorrelation analysis of PLC-PH signals (blue) exhibits no spatial periodicity. The cross-correlation analysis of wild-type PLC-PH and PLC-PH in Mcp5Δ background (black) does not show any significant correlation.
Fig. 4.
Fig. 4.
PLC-PH and Mcp5 localization patterns are perturbed in its3-1 zygotes. (A) Confocal microscope images showing the maximum intensity projection of the Hoechst-stained nucleus (Top and Bottom Left), the summed intensity projection (Top and Bottom Center), and the intensity map (Top and Bottom Right) of an its3-1 zygote expressing fluorescent PLC-PH at permissive temperature of 27 °C (“PLC-PHperm,” strain KP167xAJC-D40; Table S1) and after shift to restrictive temperature of 36 °C (“PLC-PHrest,” strain KP167xAJC-D40; Table S1), respectively, and the schematics depicting the locations P1, C1, P2, and C2 along the membrane of the cell. The intensity range is shown below the images. (B) The mean normalized intensity profiles of PLC-PHperm (green, n = 76 cells) and PLC-PHrest in experimental cells shifted to restrictive temperature 3–4 h before nuclear oscillations phase (magenta, n = 19 cells) along the positions P1, C1, P2, and C2 are plotted. The lighter shaded regions depict the SEM of the intensity profiles. The numbers in parentheses below the plot indicate the bin number (SI Materials and Methods for details). (C) Autocorrelation analysis of control PLC-PHperm signal (green) exhibits spatial periodicity at the cell centers, whereas PLC-PHrest signal (magenta) exhibits no such spatial periodicity. Cross-correlation analysis (black) reveals an aberrant correlation between the two signals, indicating a perturbation in PLC-PHrest localization upon shift to restrictive temperature. (D) Fluorescence microscope images showing the maximum intensity projection of the Hoechst-stained nucleus (Top and Bottom Left), the summed intensity projection (Top and Bottom Center), and the intensity map (Top and Bottom Right) of an its3-1 zygote expressing fluorescent Mcp5 at permissive temperature of 27 °C (“Mcp5perm,” strain KP167xVA026; Table S1) and after shift to restrictive temperature of 36 °C (“Mcp5rest,” strain KP167xVA026; Table S1), respectively, and the schematics depicting the locations P1, C1, P2, and C2 along the membrane of the cell. (E) The mean normalized intensity profiles of Mcp5perm (green, n = 25 cells) and Mcp5rest in experimental cells shifted to restrictive temperature 3–4 h before nuclear oscillations phase (magenta, n = 37 cells) along the positions P1, C1, P2, and C2 are plotted. The lighter shaded regions depict the SEM of the intensity profiles. The numbers in parentheses below the plot indicate the bin number (SI Materials and Methods for details). (F) Autocorrelation analysis of control Mcp5perm signal (green) shows a spatial periodicity that is absent in the Mcp5rest signal (magenta). Cross-correlation analysis (black) reveals improper correlation between the two signals upon shift to restrictive temperature. The asterisk marks the position of the SPB with respect to the nucleus (gray). Note that the SPB position is unknown in the PLC-PHrest and Mcp5rest cell, as nuclear oscillations were not apparent. (Scale bar, 2 µm.)
Fig. S3.
Fig. S3.
Mcp5 localization and clustering are unaffected in cells lacking its3-1 mutation grown at 36 °C. (A) Confocal microscope images showing the maximum intensity projection of the Hoechst-stained nucleus (Left), the summed intensity projection (Center), and intensity map (Right) of a cell expressing fluorescent Mcp5 at 36 °C (“Mcp5*,” strain FY16854 × FY16855; see Table S1) and the schematics depicting the locations P1, C1, P2, and C2 along the membrane of the cell. (B) Confocal microscope images showing the maximum intensity projection of the Hoechst-stained nucleus (Left), the summed intensity projection (Center), and intensity map (Right) of a cell expressing fluorescent Mcp5 at 36 °C (“Mcp5**,” strain FY16854 × KP167; see Table S1) and the schematics depicting the locations P1, C1, P2, and C2 along the membrane of the cell. The intensity range is shown below the images. (C) The mean normalized intensity profiles of Mcp5* (green, n = 13 cells) and Mcp5** (blue, n = 53 cells) along the positions P1, C1, P2, and C2 are plotted. The lighter shaded regions depict the SEM of the intensity profiles. The numbers in parentheses below the plot indicate the bin number (see SI Materials and Methods for details). Note that even though the Mcp5** signal is from a cross with the its3-1 strain at restrictive temperature, the FY16854 cell in the cross contains wild-type levels of PI(4, 5)P2 and hence displays Mcp5 profile similar to that of wild-type cells. (D) Cross-correlation analyses of Mcp5* signal (green) and Mcp5** signal (blue) with wild-type Mcp5 (see Fig. 2B) show high correlation at zero lag. (E) Confocal microscope images showing the maximum intensity projection of the Hoechst-stained nucleus (Left), the summed intensity projection (Center), and intensity map (Right) of a cell expressing fluorescent PLC-PH at 36 °C (“PLC-PH*,” strain AJC-D40 × L972; see Table S1) alongside the schematics depicting the locations P1, C1, P2, and C2 on the membrane of the cell. (F) The mean normalized intensity profile of PLC-PH* (magenta, n = 37 cells) along the positions P1, C1, P2, and C2 is plotted. The lighter shaded region depicts the SEM of the intensity profile. The numbers in parentheses below the plot indicate the bin number (see SI Materials and Methods for details). (G) Cross-correlation analysis of PLC-PH* with wild-type PLC-PH (magenta, see Fig. 2B) shows highest correlation at zero lag, and that with wild-type Mcp5 (black, see Fig. 2B) shows inverse correlation at zero lag similar to that seen in Fig. 2C. The asterisk marks the position of the SPB with respect to the nucleus (gray). (Scale bar, 2 µm.) (H) Histogram of number of Mcp5 foci counted per cell versus number of cells with given number of foci in cells expressing fluorescent Mcp5 grown at 36 °C (strain FY16854 × FY16855; see Table S1). The mean ± SD of the number of foci per cell was estimated to be 27 ± 8 (n = 11 cells).
Fig. S4.
Fig. S4.
Mcp5 clustering is perturbed in PI(4,5)P2-depleted cells. (A) Histograms of number of Mcp5 foci counted per cell versus number of cells with given number of foci in its3-1 cells grown at 27 °C (Left) and at 36 °C (Right) (strain KP167 × VA026; see Table S1). The mean ± SD of the number of foci per cell in control cells (Left) was estimated to be 28 ± 4 (n = 12 cells), and that in cells where PI(4,5)P2 was depleted (Right) was estimated to be 7 ± 5 (n = 27 cells). (B) Bright-field image (“BF”; Top and Bottom Left) and the maximum intensity projections of Mcp5-GFP (Top and Bottom Right) of a control cell (strain FY15622 transformed with plasmid FYP2932; see Table S1) imaged using confocal microscopy at permissive temperature of 27 °C (Top) and restrictive temperature of 36 °C (Bottom), alongside the schematic of a cell with line ab, along which the intensity profile of the interphase cell is plotted. (C) The mean normalized intensity profile of Mcp5-GFP along the positions a–b is plotted at permissive (green, n = 31 cells) and restrictive (magenta, n = 32 cells) temperatures. The lighter shaded regions depict the SEM of the intensity profiles. (D) Bright-field image (BF; Top and Bottom Left) and the maximum intensity projections of Mcp5-GFP (Top and Bottom Right) of an its3-1 cell (strain KP167 transformed with plasmid FYP2932; see Table S1) imaged using confocal microscopy at permissive temperature of 27 °C (Top) and restrictive temperature of 36 °C (Bottom), alongside the schematic of a cell with line ab along which the intensity profile of the interphase cell is plotted. (E) The mean normalized intensity profile of Mcp5-GFP expressed in its3-1 zygotes along the positions a–b is plotted at permissive (green) and restrictive (magenta) temperatures (n = 37 and 36 cells, respectively). The lighter shaded regions depict the SEM of the intensity profiles. Although Mcp5 showed robust localization to the membrane at permissive temperatures (green arrows), perturbation of PI(4,5)P2 displaced Mcp5 from the cortex at restrictive temperature. (F) Bright-field image (BF; Top and Bottom Left) and the maximum intensity projections of Mcp5-PH-GFP (Top and Bottom Right) of a control cell (strain FY15622 transformed with plasmid FYP2934; see Table S1) imaged using confocal microscopy at permissive temperature of 27 °C (Top) and restrictive temperature of 36 °C (Bottom), alongside the schematic of a cell with the line ab, along which the intensity profile of the interphase cell is plotted. (G) The mean normalized intensity profile of Mcp5-PH-GFP along the positions a–b at permissive (green, n = 29 cells) and restrictive temperatures (magenta, n = 22 cells) is plotted. The lighter shaded regions depict the SEM of the intensity profiles. Note that there is no significant change in the localization of either Mcp5 or Mcp5-PH-GFP at restrictive temperatures in this control background. (H) Bright-field image (BF; Top and Bottom Left) and the maximum intensity projections of Mcp5-PH-GFP (Top and Bottom Right) of an its3-1 cell (strain KP167 transformed with plasmid FYP2934; see Table S1) imaged using confocal microscopy at permissive temperature of 27 °C (Top) and restrictive temperature of 36 °C (Bottom), alongside the schematic of the cell with line ab along which the intensity profile of the interphase cell is plotted. At restrictive temperature, Mcp5-PH-GFP showed increased localization at the nucleus; therefore, a line running just below the nucleus was chosen so as to avoid interference. (I) The mean normalized intensity profile of Mcp5-PH-GFP along the positions a–b at permissive (green) and restrictive temperatures (magenta) is plotted (n = 27 and 34 cells, respectively). The lighter shaded regions depict the SEM of the intensity profiles. Two distinct peaks (green arrows) can be seen at the its3-1 cell boundaries where PH-GFP accumulates at permissive temperatures, whereas these peaks disappear at restrictive temperature due to relocalization of Mcp5-PH-GFP to the cell interior. (Scale bar, 2 µm.)
Fig. 5.
Fig. 5.
Myo1 is required for proper localization of PLC-PH and Mcp5 to the membrane. (A) Fluorescence microscope images of the Hoechst-stained nucleus (Left), fluorescent Myo1 (green, Second From Left), fluorescent Mcp5 (magenta, Third From Left), and the merge of the three signals (Right) (strain VA046; Table S1). A representative region of colocalization of Myo1 and Mcp5 signal is marked with the white arrowhead. (B) Fluorescence microscope images showing the maximum intensity projection of the Hoechst-stained nucleus (Top and Bottom Left), the summed intensity projection (Top and Bottom Center), and the intensity map (Top and Bottom Right) of Myo1Δ zygotes expressing fluorescent PLC-PH and Mcp5 (Top and Bottom, respectively, strain VA050 and strain VA044xVA045; Table S1), and the schematics depicting the locations P1, C1, P2, and C2 along the membrane of the cell. The intensity range is shown below the images. (C) The mean normalized intensity profiles of Myo1Δ-Mcp5 (green, n = 27 cells) and Myo1Δ-PLC-PH (magenta, n = 11 cells) along the positions P1, C1, P2, and C2 are plotted. The lighter shaded regions depict the SEM of the intensity profiles. The numbers in parentheses below the plot indicate the bin number (SI Materials and Methods for details). (D) Autocorrelation analyses of Myo1Δ-Mcp5 (green) and Myo1Δ-PLC-PH signal (magenta) show spatial periodicity that is different from wild-type Mcp5 and PLC-PH signals (Fig. 2C). Cross-correlation analysis (black) between wild-type Mcp5 and Myo1Δ-Mcp5 intensities yields an aberrant correlation. (E) Fluorescence microscope images showing the maximum intensity projection of the Hoechst-stained nucleus (Top and Bottom Left), the summed intensity projection (Top and Bottom Center), and the intensity map (Top and Bottom Right) of AMP–PNP-treated zygotes (SI Materials and Methods for details) expressing fluorescent Myo1 and Mcp5 (Top and Bottom, respectively, strain FY13579xL975 and strain FY16854xFY16855; Table S1) and the schematics depicting the locations P1, C1, P2, and C2 along the membrane of the cell. (F) The mean normalized intensity profiles of AMP–PNP-treated Mcp5 (SV91, magenta, n = 13 cells) along the positions P1, C1, P2, and C2 are plotted. The lighter shaded regions depict the SEM of the intensity profiles. The numbers in parentheses below the plot indicate the bin number (SI Materials and Methods for details). (G) Cross-correlation analysis (magenta) between wild-type Mcp5 and Mcp5 in AMP–PNP-treated cells. (Scale bar, 2 µm.)
Fig. S5.
Fig. S5.
Myo1 and Mcp5 do not exhibit significant colocalization. (A) Plots of normalized Myo1 (green) and Mcp5 (magenta) signal along the membrane of eight different cells (strain VA046; see Table S1). Colocalization of the signals was seen in some instances, and representative examples are marked with black arrows. (B) The mean normalized intensity profiles of Mcp5 (magenta) and Myo1 (green) along the membrane, expressed in the same cell, are plotted (n = 10 cells, strain VA046; see Table S1). The lighter shaded regions depict the SEM of the intensity profiles. The numbers in parentheses below the plot indicate the bin number (see SI Materials and Methods for details). (C) Cross-correlation of Mcp5 and Myo1 intensities (black) indicated low correlation value at zero lag—that is, low colocalization.
Fig. S6.
Fig. S6.
Mcp5’s preferential localization at the poles does not require Myo1’s motor activity. (A) Histogram of number of Mcp5 foci counted per cell versus number of cells with given number of foci in Myo1Δ zygotes (strain VA044xVA045; see Table S1). The mean ± SD of the number of foci per cell was estimated to be 9 ± 3 (n = 23 cells). (B) Fluorescence microscope images showing the maximum intensity projection of the Hoechst-stained nucleus (Left), the summed intensity projection (Center), and intensity map (Right) of a Myo1-H/TH1 cell expressing fluorescent Mcp5 (strain VA053; see Table S1) and the schematics depicting the locations P1, C1, P2, and C2 along the membrane of the cell. The intensity range is shown below the images. (C) The mean normalized intensity profile of Mcp5 in Myo1-H/TH1 background (magenta, n = 9 cells) along the positions P1, C1, P2, and C2 is plotted. The lighter shaded regions depict the SEM of the intensity profiles. The numbers in parentheses below the plot indicate the bin number (see SI Materials and Methods for details). (D) Autocorrelation of wild-type Mcp5 signal [strain AY277; see Table S1, “Mcp5 (WT),” green] shows spatial periodicity as observed before. Cross-correlation analysis of wild-type Mcp5 signal and that of Mcp5 signal in Myo1-H/TH1 strain (magenta) shows a similar trend as that seen in the wild-type Mcp5 autocorrelation. (E) Fluorescence microscope images showing the maximum intensity projection of the Hoechst-stained nucleus (Left), the summed intensity projection (Second From Left), and intensity map (Third From Left) of Cam2Δ cells expressing fluorescent Myo1 (Top, strain FY16951; see Table S1) and Mcp5 (Bottom, magenta) and dynein (Bottom, yellow, strain VA051; see Table S1) and the schematics depicting the locations P1, C1, P2, and C2 along the membrane of the cell. (F) The mean normalized intensity profile of Mcp5 in Cam2Δ cells (green, n = 13 cells) along the positions P1, C1, P2, and C2 is plotted. The lighter shaded regions depict the SEM of the intensity profile. The numbers in parentheses below the plot indicate the bin number (see SI Materials and Methods for details). (G) Cross-correlation analysis of wild-type Mcp5 signal and that of Mcp5 signal in Cam2Δ background (green) shows a similar trend as that seen in the wild-type Mcp5 autocorrelation in D. (H) Montage of spindle elongation in cells with fluorescent tubulin (strain KI001; see Table S1) treated with TritonX-100 (Top) and AMP–PNP (Bottom) and imaged for 24 min. The numbers below the montages depict time (mm:ss). (I) Plot of spindle elongation rate in control (WT, n = 8 cells), TritonX-100–treated (TritonX, n = 4 cells), and AMP–PNP-treated (AMP–PNP, n = 7 cells) cells. The TritonX-100–treated cells elongate at a rate that is not significantly different from that of control cells, whereas the elongation of the spindle in AMP–PNP-treated cells is severely reduced. (J) Fluorescence image of the Hoechst-stained nucleus (Left), maximum intensity projection of the fluorescently labeled dynein (Center, strain SV91; see Table S1), and intensity map of the dynein fluorescence (Right) depicting the complete loss of cortical dynein foci in AMP–PNP-treated cells (n= 13 cells). In the schematics, the asterisk marks the position of the SPB with respect to the nucleus (gray). (Scale bar, 2 µm.)
Fig. 6.
Fig. 6.
Dynein dissociates from the cortex in cells lacking Myo1. Fluorescence images of Hoechst-stained nucleus (Top and Bottom Left), fluorescent Dhc1 (“Dynein,” Top and Bottom Center), and the intensity map of Dhc1 in wild-type (Top) and Myo1Δ (Bottom) fission yeast zygotes (strain SV111 and strain VA049, respectively; Table S1). The intensity range is shown below the images. The schematics that appear alongside the images depict the localization of dynein at different locations in the cell. In a Myo1Δ background, dynein is absent from the cortex and the microtubules and appears almost exclusively on the SPB. (Scale bar, 2 µm.)
Fig. 7.
Fig. 7.
Nuclear oscillations are affected in cells depleted of PI(4,5)P2 and lacking Myo1. (A) Image of the nucleus stained with Hoechst (Left) and the maximum intensity projection onto the y axis along time (Right) of a representative control cell (strain FY16854xKP167; Table S1), showing robust nuclear oscillations. The amplitude and period of oscillations are quantified in Fig. S7A. (B) Image of the nucleus stained with Hoechst (Left) and the maximum intensity projection onto the y axis along time (Right) of a representative its3-1 cell shifted to restrictive temperature 3–4 h before the nuclear oscillations phase (strain KP167xAJC-D40; Table S1), showing impaired nuclear oscillations. (C) Image of the nucleus stained with Hoechst (Left) and the maximum intensity projection onto the y axis along time (Right) of a representative Myo1Δ cell (strain FY13572; Table S1), showing cessation of nuclear oscillations. (D) Image of the nucleus stained with Hoechst (Left) and the maximum intensity projection onto the y axis along time (Right) of a representative Mcp5Δ cell (strain VA024; Table S1), showing abrogation of nuclear oscillations.
Fig. S7.
Fig. S7.
Horsetail nuclear oscillations are perturbed in cells without PI(4,5)P2 or Myo1. (A) Bar plots showing the comparison of the period of oscillations normalized to cell length (Left, in units of s µm−1) and amplitude of oscillations (Right, as a percentage of cell length) in different strains in which cells were grown at permissive temperature and PI(4,5)P2 levels were not depleted. The number of oscillations that were considered for each dataset is indicated above the bars, and the number of cells analyzed for each dataset is indicated below the plots. The legend for the cross performed for each dataset is as indicated (see Table S1 for more details). (B) Montage of nuclear oscillations in a Hoechst-stained control zygote (Top, strain FY16854xKP167; see Table S1). Nuclear oscillations are prominently absent in zygotes with PI(4,5)P2 depletion [its3 (Restrictive), Second From Top, strain KP167xAJC-D40; see Table S1], with deletion of Myo1 (Myo1Δ, Third From Top, strain FY13572; see Table S1) or Mcp5 (Mcp5Δ, Bottom, strain VA024; see Table S1). The duration of each time lapse from which the montages were made was 60 min (n > 3 cells per dataset). The numbers below the montages depict time (mm:ss). (Scale bar, 2 µm.)

Similar articles

Cited by

References

    1. Yamamoto A, Tsutsumi C, Kojima H, Oiwa K, Hiraoka Y. Dynamic behavior of microtubules during dynein-dependent nuclear migrations of meiotic prophase in fission yeast. Mol Biol Cell. 2001;12(12):3933–3946. - PMC - PubMed
    1. Yamamoto A, West RR, McIntosh JR, Hiraoka Y. A cytoplasmic dynein heavy chain is required for oscillatory nuclear movement of meiotic prophase and efficient meiotic recombination in fission yeast. J Cell Biol. 1999;145(6):1233–1249. - PMC - PubMed
    1. Ding DQ, Chikashige Y, Haraguchi T, Hiraoka Y. Oscillatory nuclear movement in fission yeast meiotic prophase is driven by astral microtubules, as revealed by continuous observation of chromosomes and microtubules in living cells. J Cell Sci. 1998;111(Pt 6):701–712. - PubMed
    1. Chikashige Y, et al. Telomere-led premeiotic chromosome movement in fission yeast. Science. 1994;264(5156):270–273. - PubMed
    1. Vogel SK, Pavin N, Maghelli N, Jülicher F, Tolić-Nørrelykke IM. Self-organization of dynein motors generates meiotic nuclear oscillations. PLoS Biol. 2009;7(4):0918–0928. - PMC - PubMed

Publication types