. 2017 Mar 14;10(470):eaag3326.
doi: 10.1126/scisignal.aag3326.

PSMA redirects cell survival signaling from the MAPK to the PI3K-AKT pathways to promote the progression of prostate cancer

Affiliations

PSMA redirects cell survival signaling from the MAPK to the PI3K-AKT pathways to promote the progression of prostate cancer

Leslie Ann Caromile et al. Sci Signal. .

Abstract

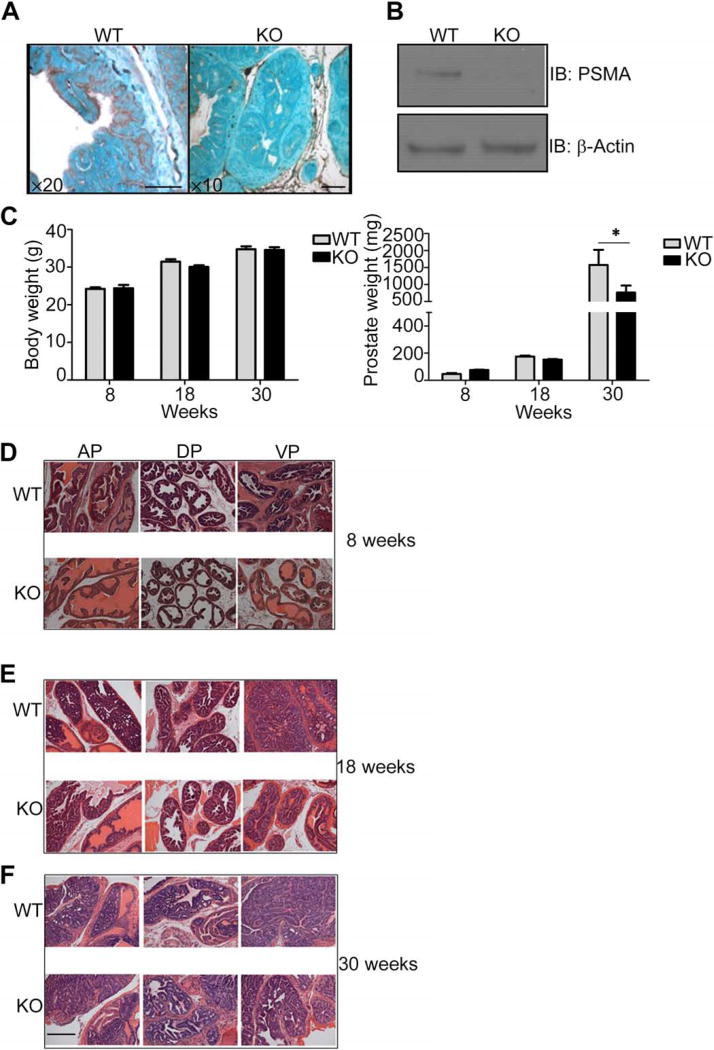
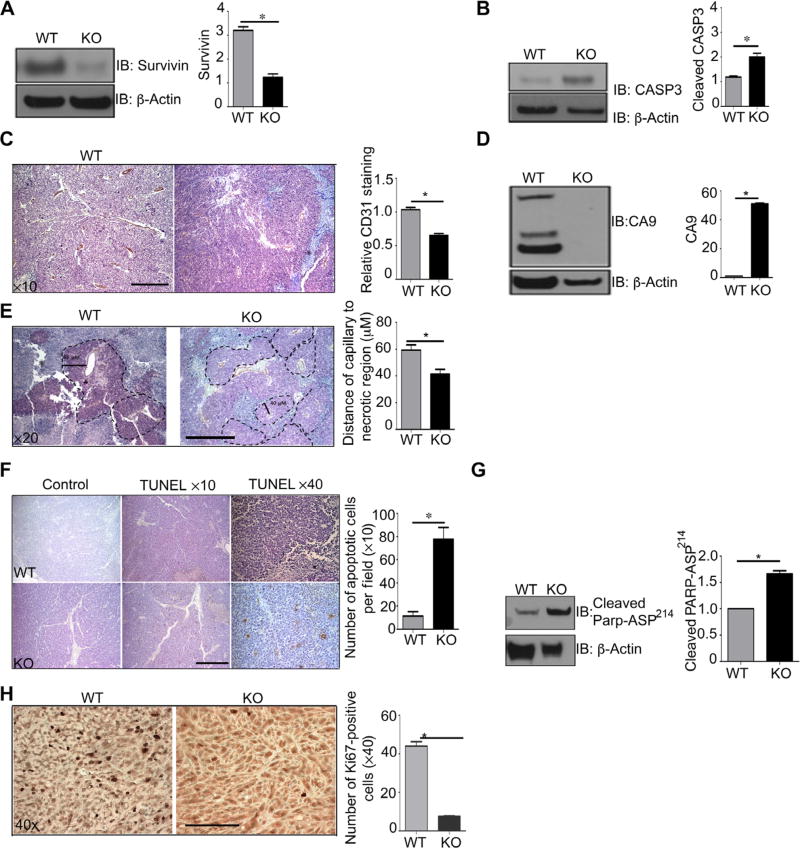
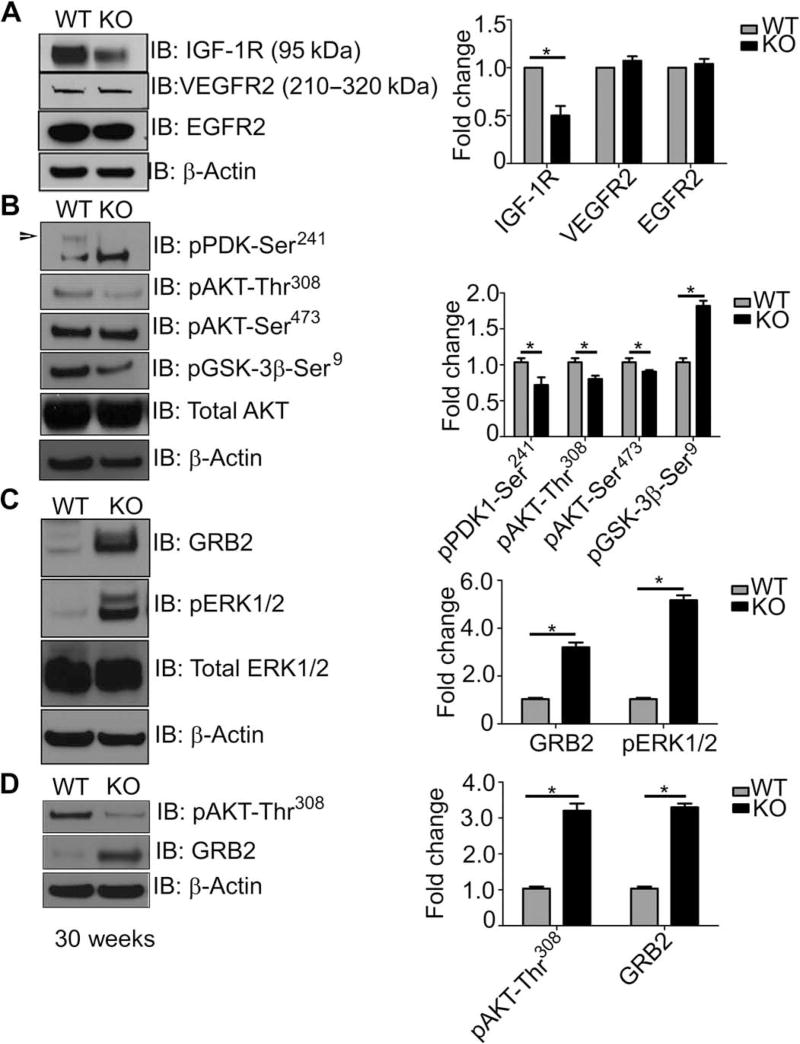
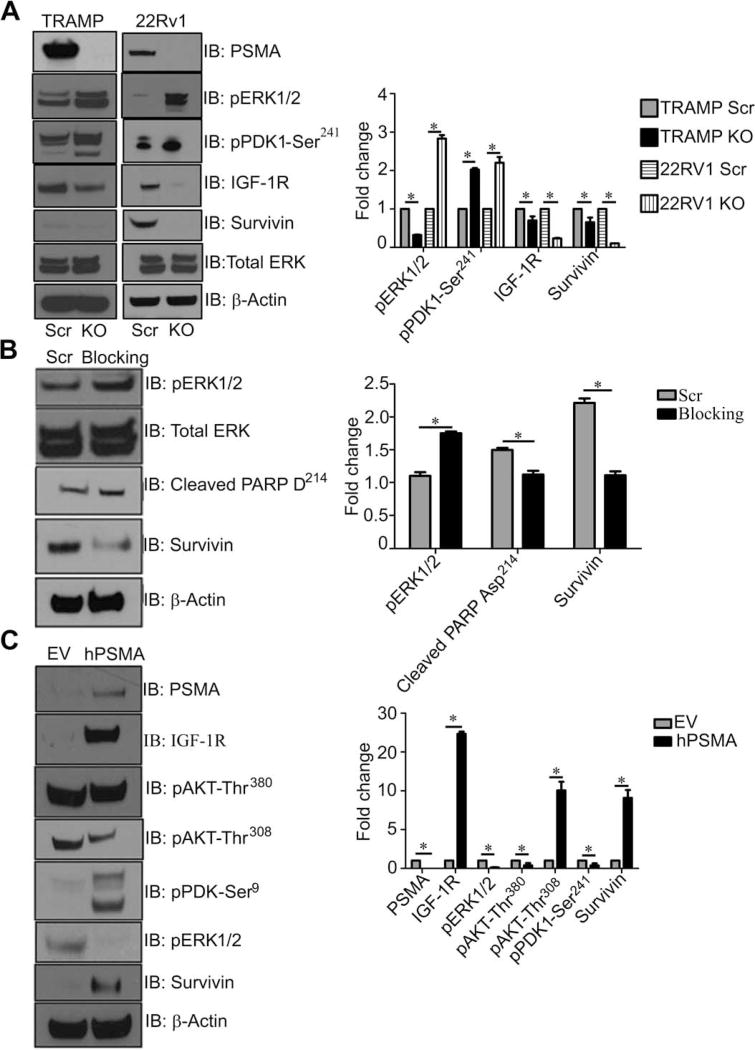
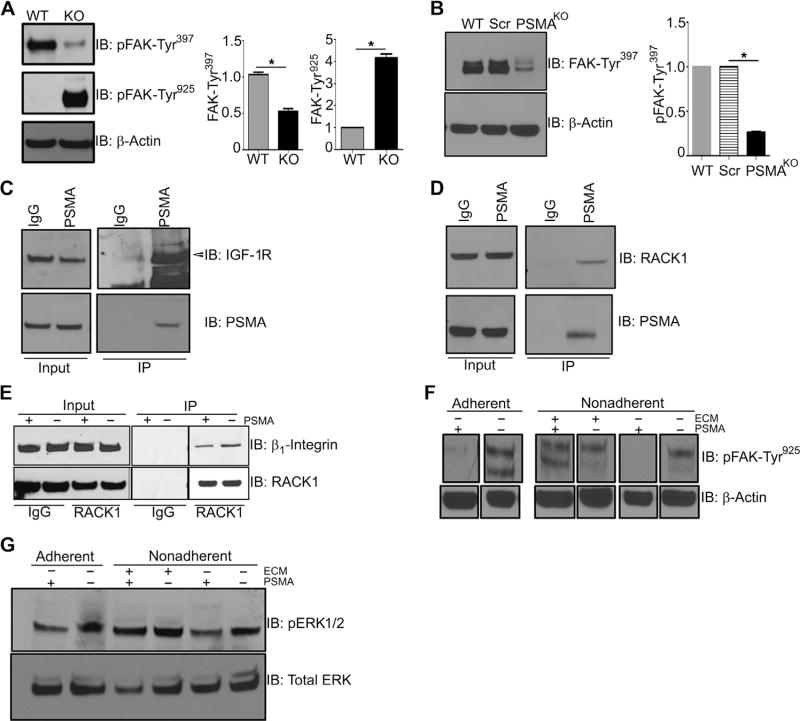
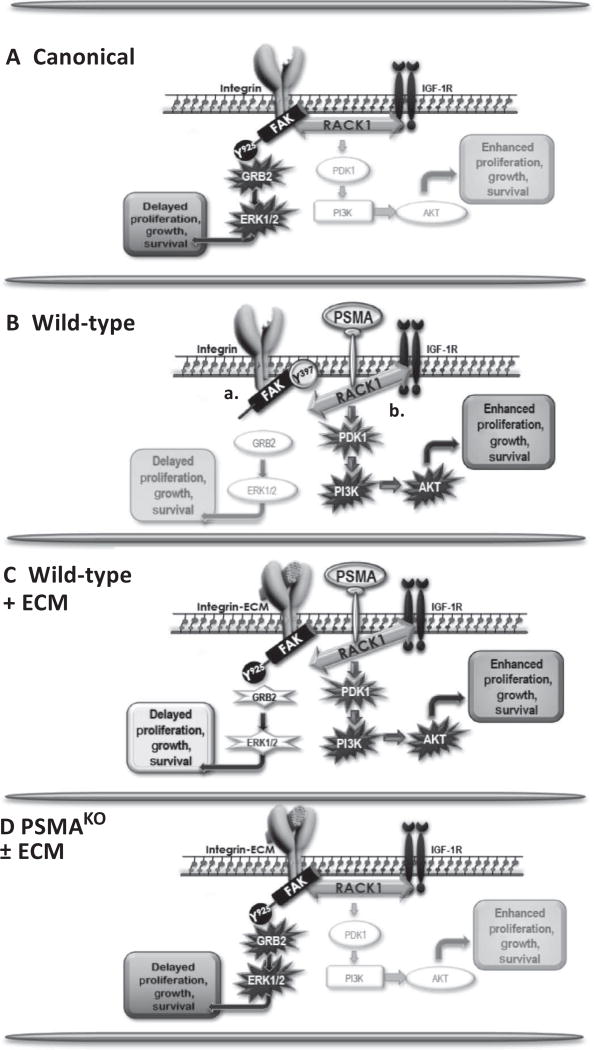
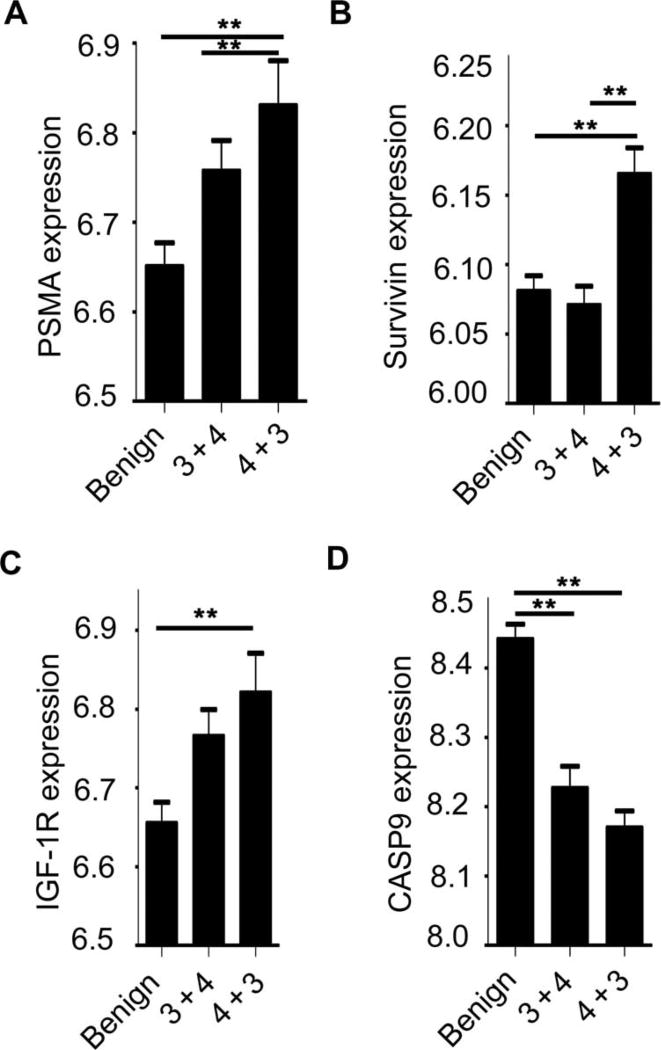
Increased abundance of the prostate-specific membrane antigen (PSMA) on prostate epithelium is a hallmark of advanced metastatic prostate cancer (PCa) and correlates negatively with prognosis. However, direct evidence that PSMA functionally contributes to PCa progression remains elusive. We generated mice bearing PSMA-positive or PSMA-negative PCa by crossing PSMA-deficient mice with transgenic PCa (TRAMP) models, enabling direct assessment of PCa incidence and progression in the presence or absence of PSMA. Compared with PSMA-positive tumors, PSMA-negative tumors were smaller, lower-grade, and more apoptotic with fewer blood vessels, consistent with the recognized proangiogenic function of PSMA. Relative to PSMA-positive tumors, tumors lacking PSMA had less than half the abundance of type 1 insulin-like growth factor receptor (IGF-1R), less activity in the survival pathway mediated by PI3K-AKT signaling, and more activity in the proliferative pathway mediated by MAPK-ERK1/2 signaling. Biochemically, PSMA interacted with the scaffolding protein RACK1, disrupting signaling between the β1 integrin and IGF-1R complex to the MAPK pathway, enabling activation of the AKT pathway instead. Manipulation of PSMA abundance in PCa cell lines recapitulated this signaling pathway switch. Analysis of published databases indicated that IGF-1R abundance, cell proliferation, and expression of transcripts for antiapoptotic markers positively correlated with PSMA abundance in patients, suggesting that this switch may be relevant to human PCa. Our findings suggest that increase in PSMA in prostate tumors contributes to progression by altering normal signal transduction pathways to drive PCa progression and that enhanced signaling through the IGF-1R/β1 integrin axis may occur in other tumors.


Figures

Fig. 1
Fig. 1. Characterization of tumors from WT and PSMA KO TRAMP mice
(A) Immunohistological characterization of PSMA distribution (brown strain) in prostate tumors from 18-week-old PSMA wild-type (WT) or knockout (KO) TRAMP mice. Tissues were counterstained with methyl green. Magnification, ×20 (WT) and ×10 (KO); scale bars, 100 µm. (B) Western blot (IB) analysis of PSMA abundance (monoclonal antibody 3E2) in whole prostate tumor lysates from 18-week-old PSMA WT or KO TRAMP mice. (C) Total body and prostate weights in WT and PSMA KO TRAMP mice at 8,18, and 30 weeks of age. Data are means ± SE from 10 WT and 10 KO mice per group. *P < 0.05, paired Student’s t test. (D to F) Representative images of H&E-stained sections of anterior prostate (AP), ventral prostate (VP), and dorsal prostate (DP) lobes from PSMA WT and PSMA KO mice at 8 (D), 18 (E), and 30 (F) weeks of age. n = 30 for each experimental group. Magnification, ×25; scale bar, 100 µm.
Fig. 2
Fig. 2. PSMA WT prostate tumors display a more vascularized, hypoxia-tolerant, antiapoptotic phenotype
(A and B) Western blotting for survivin and caspase-3 (CASP3) in whole prostate tumor lysates from 18-week-old PSMA WT and KO TRAMP mice. (C) Immunohistochemical analysis of tumor vasculature by CD31 staining, quantified for CD31+ pixel area sum from five nonoverlapping fields per sample using Image-Pro Plus software (hematoxylin counterstain). Scale bar, 50 µm. (D) Western blot analysis for CA9, a marker of hypoxia, in whole prostate tumor lysate from 18-week-old PSMA WT and KO mouse tumors. (E) Thickness of viable layer of tumor cells from CD31-stained capillaries. PSMA WT (65 µM) and KO (40 µM). Tissue was counterstained with hematoxylin, and images are shown at ×20 magnification. Scale bar, 100 µm. (F) Representative TUNEL stain to detect apoptotic cells (brown) in PSMA WT and KO tumor sections from 18-week-old mice. Sections were counterstained with hematoxylin. Analysis is representative of the number of apoptotic cells per field. Images are shown at ×10 and ×40 magnifications. Scale bar, 50 µm. (G) Western blot anaylis of cleaved PARP Asp214, a marker of apoptosis, in PSMA WT tumors compared to PSMA KO tumors. (H) Immunohistochemical analysis of cell proliferation (Ki67 staining) in PSMA WT and PSMA KO tumor sections. Scale bar, 100 µm. All Western blots were normalized to β-actin and are presented as fold change relative to WT. Data are means ± SE from n = 4 animals for each experimental group, with at least three experimental replicates. *P < 0.05, paired Student’s t test.
Fig. 3
Fig. 3. PSMA within the prostate tumor epithelium shifts cell signaling from an “active GRB2-ERK1/2 pathway–inactive PI3K-AKT pathway” state to an “active PI3K-AKT pathway–inactive GRB2-ERK1/2 pathway” state
(A to C) Western blotting of whole prostate tumor lysates from 18-week-old PSMA WT or KO TRAMP mice for various RTKs (A), AKT pathway markers (B), and MAPK pathway markers (C). (D) Blotting for the indicated markers in tumors from 30-week-old PSMA WT and KO mice. Blots are representative of three experiments from n = 3 WT and 3 KO mice, normalized to β-actin and presented as fold change relative to WT. *P < 0.05, paired Student’s t test.
Fig. 4
Fig. 4. Manipulation of PSMA in both mouse TRAMP-C1 and human 22RV1 and PC-3 PCa cell lines mimic pathway switch
(A) CRISPR knockdown of PSMA in both the mouse TRAMP-C1 cell line (TRAMP-PSMAKO) and the human 22Rv1 cell line (22RV1-PSMAKO). Western blot analysis of both CRISPR cell lines to examine changes in PDK-Ser241, IGF-1R, survivin, and pERK1/2 compared to controls (Scr). (B) TRAMP-C1 cells transiently transfected with peptides blocking the PSMA NH2-terminal cytoplasmic tail. Western blot at 24 hours for pERK1/2, cleaved PARP Asp214, and survivin at 24 hours compared to the control (Scr). (C) Western blot analysis of PC-3 cells expressing human PSMA (hPSMA) and empty vector (EV) control cell lysates to investigate changes in the previously identified signaling pathways (PSMA, IGF-1R, AKT-Ser380, AKT-Thr308, PDK1-Ser241, pERK1/2, survivin, and β-actin). All data are representative images from the mean ± SE of n = 3 for each experimental condition and three experimental replicates normalized to β-actin and presented as fold change, where WT is equal to 1. *P < 0.05, paired Student’s t test.
Fig. 5
Fig. 5. PSMA expression markedly alters FAK phosphorylation, and PSMA is in a complex with RACK1 and IGF-1R
(A) Western analysis for FAK-Tyr397 and FAK-Tyr925 in tumor lysates from 18-week-old WT and KO mice. (B) Western blot analysis for FAK-Tyr397 in parental WT, control scramble 22Rv1 cells (Scr), and 22Rv1-PSMAKO cells. (C) Immunoprecipitation (IP) of PSMA in WT 22Rv1 cells using PSMA monoclonal antibody or rabbit immunoglobulin G (IgG) control and Western blot for IGF-1R (arrow indicates band). Input refers to unbound fraction. (D) Immunoprecipitation of PSMA in WT 22Rv1 cells using PSMA rabbit monoclonal antibody or rabbit IgG control and Western blot for RACK1. (E) Immunoprecipitation of RACK1 in both 22Rv1-PSMAScr and 22Rv-PSMAKO cells and Western blot analysis for β1 integrin. (F and G) Both 22Rv1-PSMAScr and 22Rv-PSMAKO cells were put either not in suspension (adherent) or in suspension (nonadherent) for 2 hours and assayed by Western blot for the direct activation of FAK-Tyr925 (F) and ERK (G) by addition of extracellular matrix (ECM) for 30 min. All data are representative images from the means ± SE of n = 3 for each experimental conditions and three experimental replicates normalized to β-actin and presented as fold change, where WT is equal to 1. *P < 0.05, paired Student’s t test.
Fig. 6
Fig. 6. Schematic of PSMA regulation of PCa signaling
(A) In the canonical pathway, a stable scaffolding complex containing β1 integrin, RACK1, and IGF-1R activates the FAK-Tyr925/GRB2/ERK pathway, leading to tumor cell proliferation, growth, and migration. (B) In WT cells, PSMA expression disrupts two pathways, both of which contribute to activation of the more aggressive, protumor PI3K-AKT pathway. PSMA physically associates with IGF-1R and RACK1, consistent with PSMA disrupting the scaffolding complex, which leads to FAK-Tyr397 hyperphosphorylation (“a”), and PSMA expression reverses the phosphorylation of FAK-Tyr925, which is required for FAK/GRB2 interactions, thus inactivating ERK signal transduction (“b”). (C) Bypassing PSMA interference by directly activating FAK-Tyr925 with extracellular matrix (ECM) rescues activation of FAK-Tyr925 and the GRB2/ERK signaling pathway. (D) The absence of PSMA allows stable IGF-1R/RACK1/β1 integrin complex formation and activation of the FAK-GRB2-ERK canonical pathway, producing less aggressive tumors.
Fig. 7
Fig. 7. PSMA levels in human prostate tumors are significantly associated with an increase in Gleason score
(A) GEO data set GSE32571 analyzed 59 PCa and 39 matched benign tissue samples for transcriptional differences between tumor samples with higher Gleason score (4 + 3 and higher) against samples of lower Gleason score (3 + 4 and lower). High PSMA gene expression is concurrent with high Gleason score in human tumor samples. (B and C) Abundances of survivin and IGF-1R are high in more aggressive tumors. (D) Abundance of caspase-9 (CASP9) decreases with tumor aggressiveness. Subgroup labels are along the bottom of the chart. Benign: n = 39; “3 + 4”: tumors with a low Gleason score, n = 32; “4 + 3”: tumors with a high Gleason score, n = 27. Groups that reach **P < 0.005 are indicated on the graph. Gene expression on the y axis is presented as the relative expression of the gene of interest compared to all the other genes in the array. A distribution analysis of all selected samples determined that all selected samples were suitable for comparison. Data analysis was completed using GEO2R, for which the R script is provided in data file S1.

References

    1. Siegel R, DeSantis C, Virgo K, Stein K, Mariotto A, Smith T, Cooper D, Gansler T, Lerro C, Fedewa S, Lin C, Leach C, Cannady RS, Cho H, Scoppa S, Hachey M, Kirch R, Jemal A, Ward E. Cancer treatment and survivorship statistics, 2012. CA Cancer J. Clin. 2012;62:220–241. - PubMed
    1. Chen Y, Sawyers CL, Scher HI. Targeting the androgen receptor pathway in prostate cancer. Curr. Opin. Pharmacol. 2008;8:440–448. - PMC - PubMed
    1. Roudier MP, True LD, Higano CS, Vesselle H, Ellis W, Lange P, Vessella RL. Phenotypic heterogeneity of end-stage prostate carcinoma metastatic to bone. Hum. Pathol. 2003;34:646–653. - PubMed
    1. Jones HE, Goddard L, Gee JMW, Hiscox S, Rubini M, Barrow D, Knowlden JM, Williams S, Wakeling AE, Nicholson RI. Insulin-like growth factor-I receptor signalling and acquired resistance to gefitinib (ZD1839; Iressa) in human breast and prostate cancer cells. Endocr. Relat. Cancer. 2004;11:793–814. - PubMed
    1. Warshamana-Greene GS, Litz J, Buchdunger E, García-Echeverría C, Hofmann F, Krystal GW. The insulin-like growth factor-I receptor kinase inhibitor, NVP-ADW742, sensitizes small cell lung cancer cell lines to the effects of chemotherapy. Clin. Cancer Res. 2005;11:1563–1571. - PubMed

MeSH terms

Substances