. 2017 Mar 14;8(2):e02020-16.
doi: 10.1128/mBio.02020-16.

Plaques Formed by Mutagenized Viral Populations Have Elevated Coinfection Frequencies

Affiliations

Plaques Formed by Mutagenized Viral Populations Have Elevated Coinfection Frequencies

Elizabeth R Aguilera et al. mBio. .

Abstract

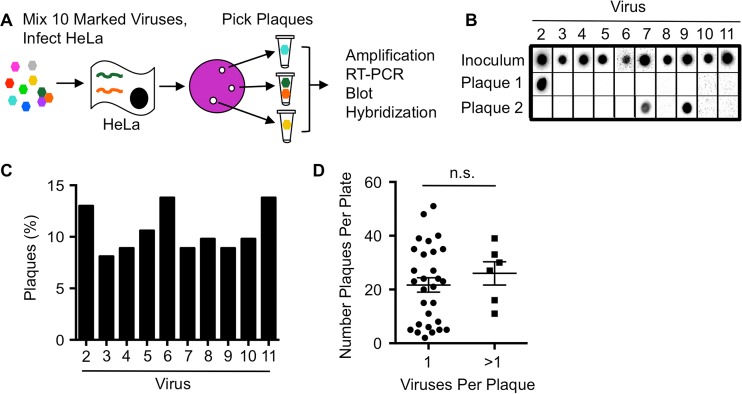
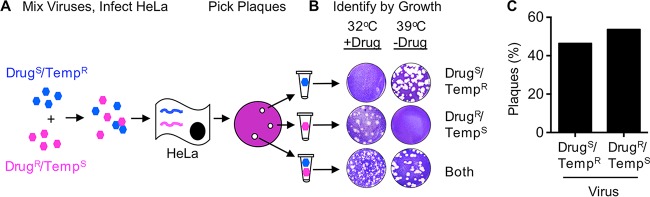
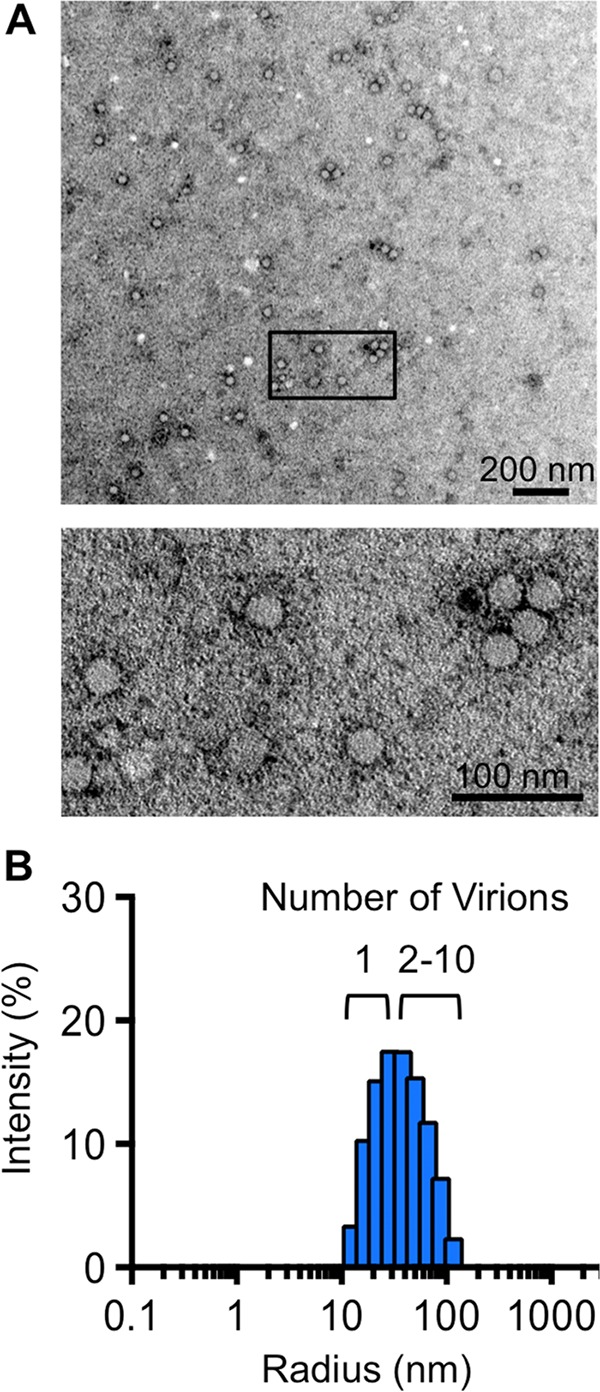
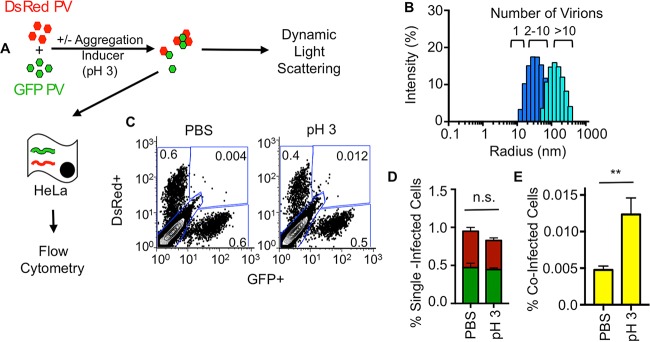
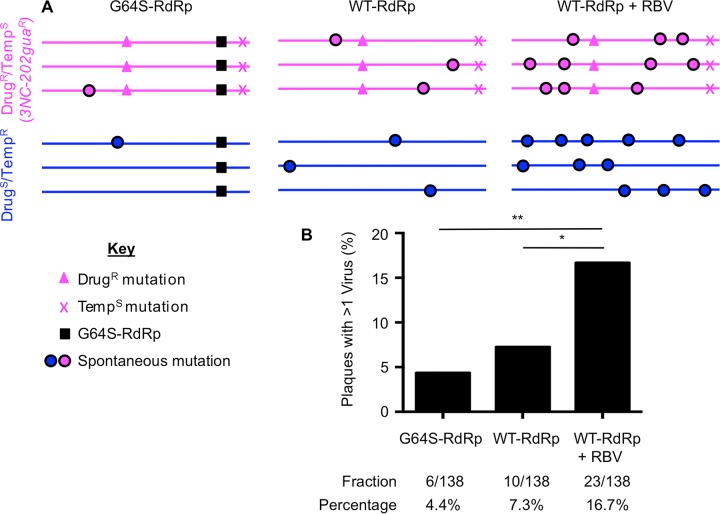
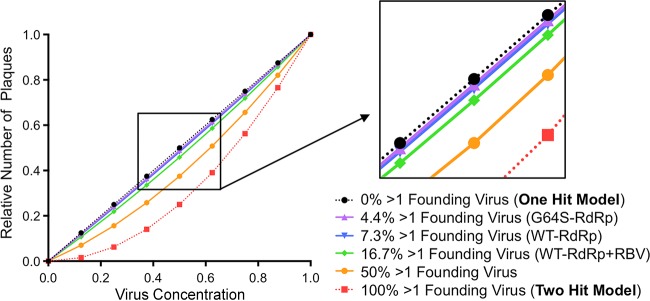
The plaque assay is a common technique used to measure virus concentrations and is based upon the principle that each plaque represents a single infectious unit. As such, the number of plaques is expected to correlate linearly with the virus dilution plated, and each plaque should be formed by a single founder virus. Here, we examined whether more than one virus can contribute to plaque formation. By using genetic and phenotypic assays with genetically marked polioviruses, we found that multiple parental viruses are present in 5 to 7% of plaques, even at an extremely low multiplicity of infection. We demonstrated through visual and biophysical assays that, like many viral stocks, our viral stocks contain both single particles and aggregates. These data suggest that aggregated virions are capable of inducing coinfection and chimeric plaque formation. In fact, inducing virion aggregation via exposure to low pH increased coinfection in a flow cytometry-based assay. We hypothesized that plaques generated by viruses with high mutation loads may have higher coinfection frequencies due to processes restoring fitness, such as complementation and recombination. Indeed, we found that coinfection frequency correlated with mutation load, with 17% chimeric plaque formation for heavily mutagenized viruses. Importantly, the frequency of chimeric plaques may be underestimated by up to threefold, since coinfection with the same parental virus cannot be scored in our assay. This work indicates that more than one virus can contribute to plaque formation and that coinfection may assist plaque formation in situations where the amount of genome damage is high.IMPORTANCE One of the most common methods to quantify viruses is the plaque assay, where it is generally presumed that each plaque represents a single infectious virus. Using genetically marked polioviruses, we demonstrate that a plaque can contain more than one parental virus, likely due to aggregates within virus stocks that induce coinfection of a cell. A relatively small number of plaques are the products of coinfection for our standard virus stocks. However, mutagenized virus stocks with increased genome damage give rise to a higher amount of plaques that are chimeric. These results suggest that coinfection may aid plaque formation of viruses with genome damage, possibly due to processes such as complementation and recombination. Overall, our results suggest that the relationship between viral dilution and plaque number may not be linear, particularly for mutagenized viral populations.

Keywords: coinfection; evolution; mutagen; poliovirus.


Figures

FIG 1
FIG 1
Genotypic assay reveals coinfection of polioviruses. (A) Schematic of assay design. HeLa cells were infected at an MOI of ~0.00001 with a mixture of equal amounts of 10 genetically marked viruses. Hypothetical genomes are depicted in a HeLa cell. Plaques were picked from the agar overlays after incubation at 37°C for 48 h. Plaque-forming viruses were amplified by infecting new cells and RT-PCR products were blotted and probed on a membrane to identify the virus(es) present. (B) Representative plaque virus samples detected by probes. The number of viruses present within each plaque was quantified. Plaques were scored as having a single parent virus (Plaque 1) or more than one parent virus (Plaque 2). (C) Distribution of the 10 marked viruses among all plaques. (D) Frequency of coinfected or non-coinfected plaque viruses versus the number of plaques per plate, with the mean ± standard error of the mean (error bar) shown (the difference was not significant [n.s.] as determined by Student’s t test).
FIG 2
FIG 2
Phenotypic assay reveals coinfection of polioviruses. (A) Schematic of coinfection assay using DrugS/TempR and DrugR/TempS viruses. The two parental viruses were mixed, the cells were incubated, and HeLa cells were infected with the viral mixture at an MOI of ~0.00001. Hypothetical viral genomes are depicted in a HeLa cell. Plaques were picked 4 or 5 days after adding agar overlay at 32°C in the absence of guanidine (permissive conditions). (B) Representative plaques in the phenotypic scoring assay. Plaque-forming viruses were plated on HeLa cells under dual selective conditions as indicated. (C) Distribution of the two parental viruses among all plaques.
FIG 3
FIG 3
Stocks of poliovirus contain aggregates. (A) Transmission electron microscopy of a representative poliovirus stock. Viral particles were imaged at a magnification of ×13,000 (top image) or ×30,000 (bottom image [a detail of the boxed region in the top image]). (B) Dynamic light scattering analysis of a representative poliovirus stock. Virus stock was diluted to 5 × 10⁴ PFU/ml and centrifuged for 10 min prior to analysis on a Protein Solutions DynaPro instrument. The poliovirus radius is 15 nm.
FIG 4
FIG 4
Flow cytometry-based assay demonstrates correlation between aggregation and coinfection. (A) Schematic of flow cytometry-based assay. GFP- and DsRed-expressing polioviruses were mixed in the presence or absence of aggregation-inducing conditions (with or without exposure to pH 3 solution for 4 h) prior to analysis by dynamic light scattering or infection of HeLa cells at an MOI of 0.01. At 16 hpi, infection was quantified using flow cytometry. (B) Dynamic light-scattering analysis of viruses exposed to PBS (royal blue data are the same data shown in Fig. 3B) or viruses exposed to glycine-HCl buffer at pH 3 for 4 h (turquoise). Samples were processed as described in the legend to Fig. 3. (C) Representative FACS plots showing quantification of DsRed, GFP, or dual-positive cells. The units for the x and y axes are GFP and DsRed fluorescence intensity, respectively. The numbers in each gate indicate the percentage positive of the total cell population of 2 × 10⁵ cells counted. Gates were drawn from FACS plots of HeLa cells exposed to glycine-HCl at pH 3 in the absence of PV (bottom left gate), infected with 1 × 10⁴ PFU GFP-PV (bottom right gate), infected with 1 × 10⁴ PFU DsRed-PV (top left gate) or infected with 1 × 10⁴ PFU GFP-PV and 1 × 10⁴ PFU DsRed-PV (top right gate). (D) Percentage of cells infected by single viruses (labeled with GFP or DsRed). (E) Percentage of coinfected cells, positive for both GFP and DsRed (top right gate in panel C). Results are presented as mean ± standard error of the mean (n = 9). Statistical significance was determined by Student’s t test as follows: **, P < 0.005; n.s., not significant.
FIG 5
FIG 5
Coinfection frequency of poliovirus correlates with genome damage. (A) Schematic of viral genomes showing engineered versus representative spontaneous mutations. (B) Coinfection frequencies of high-fidelity/low-mutation viruses (G64S-RdRp), intermediate-mutation viruses (WT-RdRp), and high-mutation viruses (WT-RdRp+RBV) were performed as described for the phenotypic assay (Fig. 2). The value of coinfection for WT-RdRp virus is the same as presented in Table 1 for the phenotypic assay. Statistically significant differences were observed between WT-RdRp and WT-RdRp+RBV viruses (*, P = 0.0248), and between G64S-RdRp and WT-RdRp+RBV viruses (**, P = 0.0013) using Fisher’s exact test.
FIG 6
FIG 6
Theoretical relationship between virus dilution and plaque numbers at different coinfection frequencies. Plaque assays are based on the dose-response curve of a one-hit model (calculation depicted by the dotted black line) where each plaque is formed by one infectious unit. Certain plant and fungal viruses have two-hit kinetics (calculation depicted by the dotted red line), where two viral genomes per cell are required for productive infection and plaque formation. Purple, blue, and green lines represent calculations using data obtained in Fig. 5 for G64S-RdRp, WT-RdRp, and WT-RdRp+RBV viruses, respectively. The solid orange line represents the theoretical curve for a coinfection frequency of 50%. At low coinfection frequencies (e.g., 3.2% and 7.3%), the curvatures of the lines are minimal, and therefore, the relationship between dilution and the number of plaques is nearly linear (see the inset).

Comment in

References

    1. Dulbecco R, Vogt M. 1953. Some problems of animal virology as studied by the plaque technique. Cold Spring Harb Symp Quant Biol 18:273–279. doi:10.1101/SQB.1953.018.01.039. - DOI - PubMed
    1. Muller HJ. 1964. The relation of recombination to mutational advance. Mutat Res 106:2–9. doi:10.1016/0027-5107(64)90047-8. - DOI - PubMed
    1. Duarte E, Clarke D, Moya A, Domingo E, Holland J. 1992. Rapid fitness losses in mammalian RNA virus clones due to Muller’s ratchet. Proc Natl Acad Sci U S A 89:6015–6019. doi:10.1073/pnas.89.13.6015. - DOI - PMC - PubMed
    1. Yuste E, Sánchez-Palomino S, Casado C, Domingo E, López-Galíndez C. 1999. Drastic fitness loss in human immunodeficiency virus type 1 upon serial bottleneck events. J Virol 73:2745–2751. - PMC - PubMed
    1. Ghabrial SA, Suzuki N. 2009. Viruses of plant pathogenic fungi. Annu Rev Phytopathol 47:353–384. doi:10.1146/annurev-phyto-080508-081932. - DOI - PubMed

Publication types

LinkOut - more resources