. 2017 Feb 28:8:324.
doi: 10.3389/fmicb.2017.00324. eCollection 2017.

Dysbiosis of Gut Microbiota Associated with Clinical Parameters in Polycystic Ovary Syndrome

Affiliations

Dysbiosis of Gut Microbiota Associated with Clinical Parameters in Polycystic Ovary Syndrome

Rui Liu et al. Front Microbiol. .

Abstract

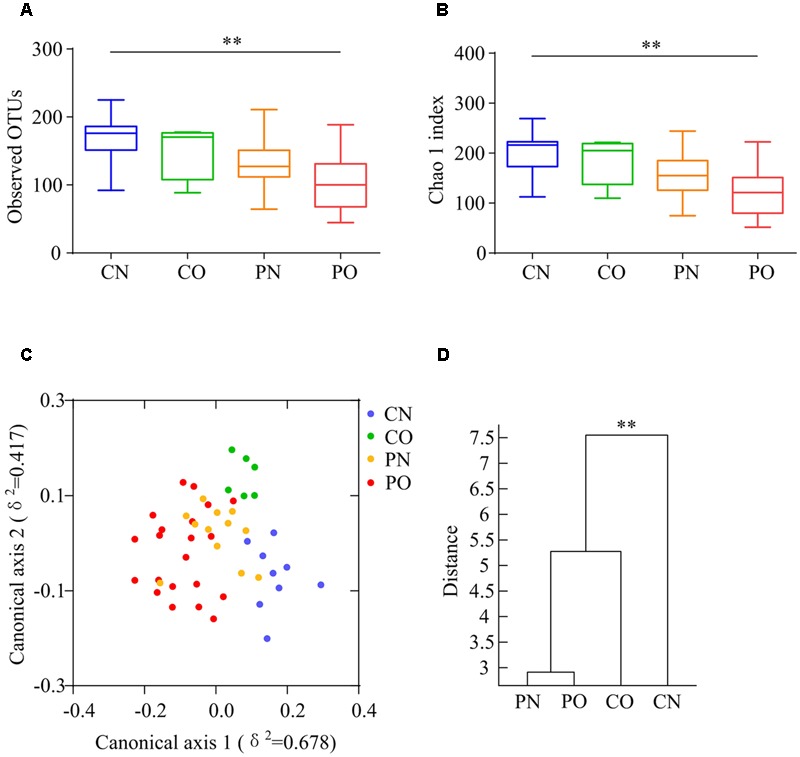
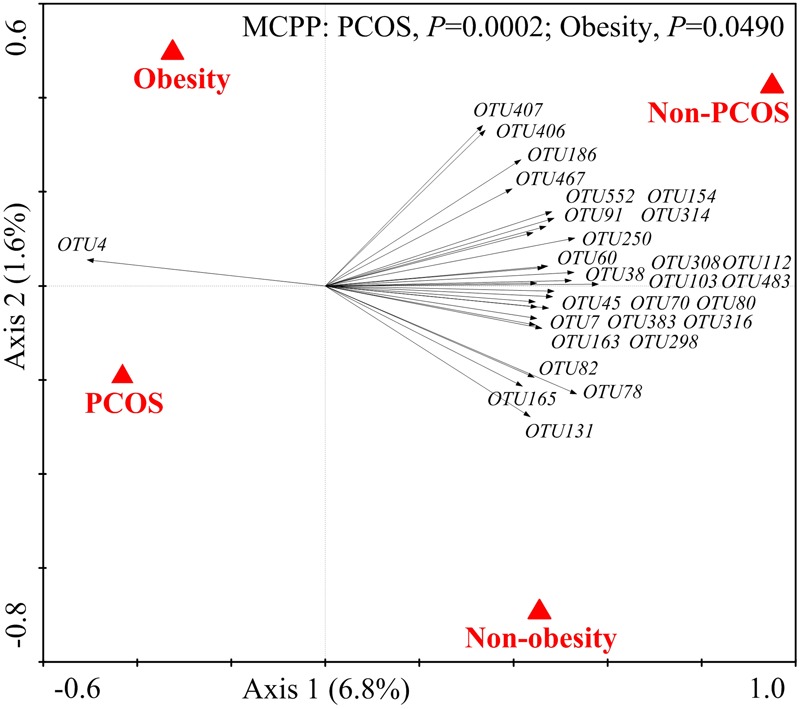
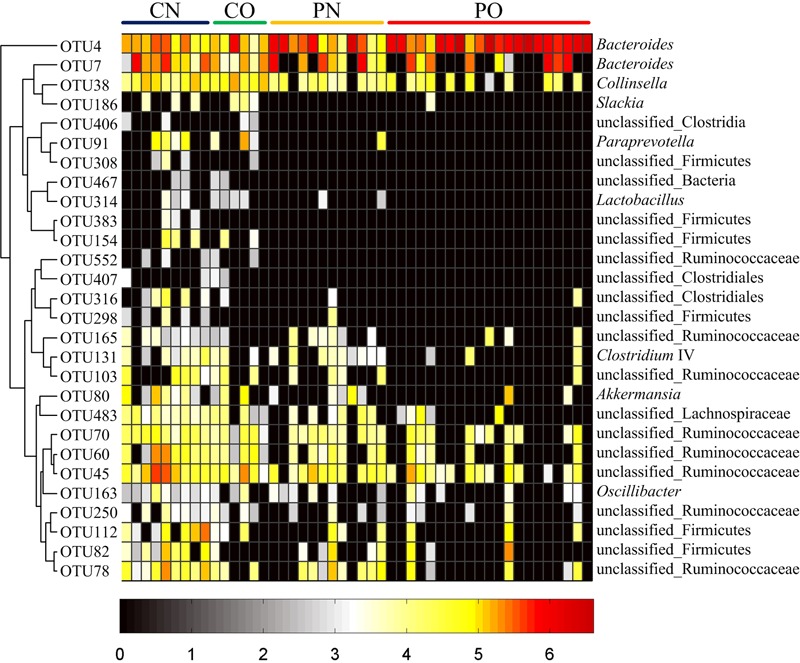
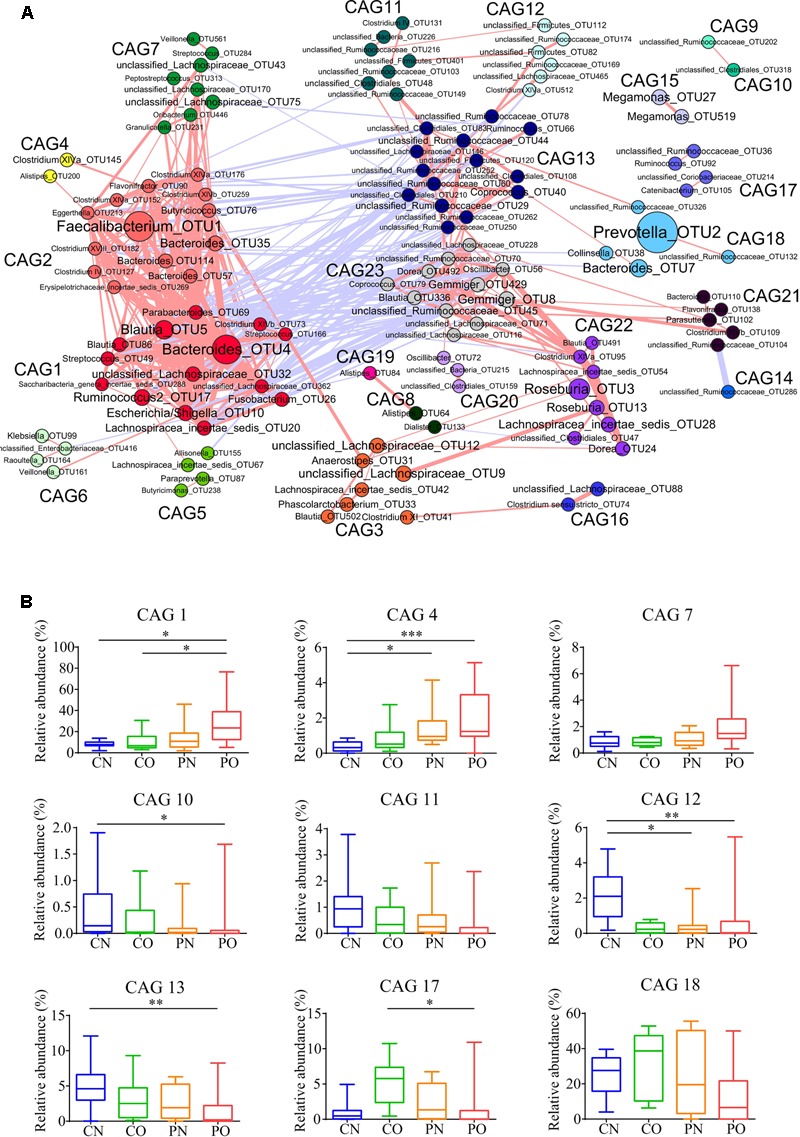
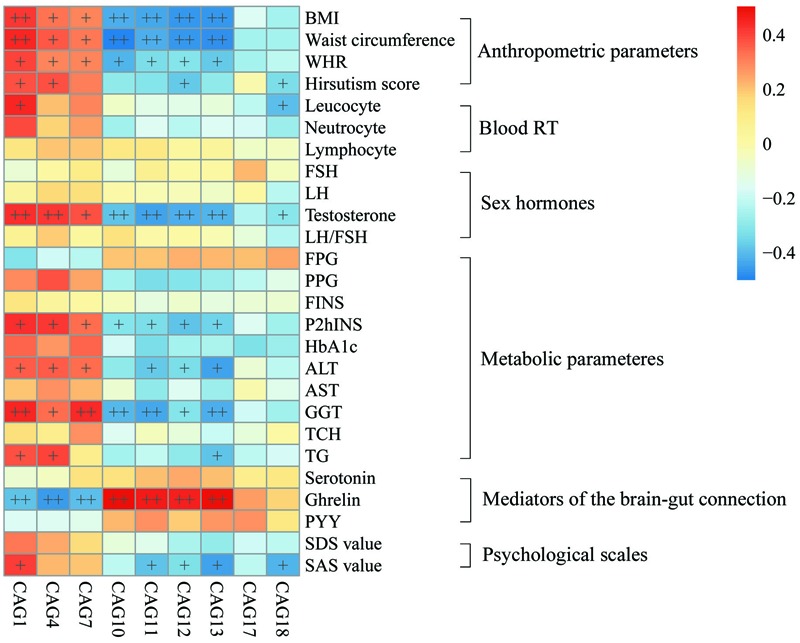
Polycystic ovary syndrome (PCOS) is a common endocrine and metabolic disorder in women. Gut microbiota has been implicated to play a critical role in metabolic diseases and may modulate the secretion of mediators of the brain-gut axis. Interaction between gut microbiota and the endocrine and biochemical disturbances in PCOS still remains elusive. Here, we showed an altered gut microbiota significantly correlated with PCOS phenotype. There were 33 patients with PCOS (non-obese PCOS individuals, PN, n = 12; obese PCOS individuals, PO, n = 21) as well as 15 control subjects (non-obese control individuals, CN, n = 9; obese control individuals, CO, n = 6) enrolled in our study. The plasma levels of serotonin, ghrelin, and peptide YY (PYY) were significantly decreased in patients with PCOS compared with controls, and have a significantly negative correlation with waist circumference and testosterone. Sequencing of the V3-V4 region of the 16S rRNA gene in fecal samples revealed the substantial differences of gut microbial species between the PCOS and non-obese controls. Bacterial species were clustered into 23 co-abundance groups (CAGs) based on the SparCC correlation coefficients of their relative abundance. The CAGs increased in PCOS, including the bacteria belonging to Bacteroides, Escherichia/Shigella and Streptococcus, were negatively correlated with ghrelin, and positively correlated with testosterone and BMI. Furthermore, the CAGs that were decreased in PCOS, including the bacteria from Akkermansia and Ruminococcaceae, showed opposite relationship with body-weight, sex-hormone, and brain-gut peptides. In conclusion, gut microbial dysbiosis in women with PCOS is associated with the disease phenotypes.

Keywords: ghrelin; gut microbiota; obesity; polycystic ovary syndrome; serotonin; testosterone.


Figures

FIGURE 1
FIGURE 1
Overall structural differentiation of gut microbiota based on UniFrac distance between four groups. (A) OTU-level rarefaction (observed OTUs). (B) Chao 1 index. Values are shown by box-plot. Box represents the interquartile range. The line inside the box represents the median. And whiskers denote the minimum and maximum value. ∗∗Adjusted P < 0.01 (Kruskal–Wallis test). (C) Bray–Curtis CAP using the first 13 PCs (accounting for 80.67% of the total variation). (D) Clustering of gut microbiota based on Bray–Curtis distance calculated with MANOVA using the first 13 PCs. ∗∗P < 0.01. CN: non-obese control group, n = 9. CO: obese control group, n = 6. PN: non-obese PCOS group, n = 12. PO: obese PCOS group, n = 21.
FIGURE 2
FIGURE 2
The 28 key OTUs selected by RDA responding to PCOS or obesity. PCOS and obesity were conducted as environmental variables. Relative abundances (after log transformation) of all OTUs were used as response variables, and responding OTUs that had at least 20% of the variability explained by all canonical axes were selected and exhibited by black arrows. Statistical significance was assessed by Monte Carlo test with 9999 permutations.
FIGURE 3
FIGURE 3
Heat map of the relative abundances of 28 key OTUs related to the alteration of gut microbiota between the four groups. The color of the spots represents the relative abundance (normalized and log-transformed) of the OTUs. OTUs are ordered by spearman correlation analysis based on relative abundance. The genus-level taxonomic assignment is shown on the right. For CN, n = 9; for PN, n = 12; for CO, n = 6; and for PO, n = 21.
FIGURE 4
FIGURE 4
Bacterial correlation based on relative abundance in women with or without PCOS. (A) Co-abundance groups interaction network. Network shows correlation relationships between 23 CAGs of 225 OTUs from all samples. Node size represents the average abundance of each OTU. Lines between nodes represent correlations of each other, with the line width representing the correlation magnitude. The red ones represent positive correlations, and the blue ones represent negative correlations. Only lines whose absolute value of correlation coefficient greater than 0.50 are drawn, and unconnected nodes are omitted. (B) Group-level abundance differentiation of CAGs. Data are visualized by box-plot. Box represents the interquartile range. The line inside the box represents the median. And whiskers denote the minimum and maximum value. adjusted P < 0.05, ∗∗adjusted P < 0.01, and ∗∗∗adjusted P < 0.001 (multiple comparisons of Kruskal–Wallis test). For CN, n = 9; For PN, n = 12; For CO, n = 6; For PO, n = 21.
FIGURE 5
FIGURE 5
Associations between clinical parameters and gut microbiota. The color of spots represents R value of Spearman correlation between each CAG and clinical parameter. +FDR < 0.05, ++FDR < 0.01. For leucocyte, neutrocyte, lymphocyte and hirsutism, n = 46; for the other parameters, n = 48. BMI, body mass index; WHR, Waist hip ratio; Blood RT, blood routine test; FSH, follicular stimulating hormone; LH, luteinizing hormone; FPG, fasting plasma glucose; PPG, 2h postprandial plasma glucose; FINS, fasting plasma insulin; P2hINS, 2h postprandial plasma insulin; HOMA-IR, homeostasis model assessment for insulin resistance index; HOMA-beta, homeostasis model assessment for beta cell function; HbA1c, hemoglobin A1c; ALT, alanine aminotransferase; AST, aspartate transaminase; GGT, γ-glutamyltransferase; TCH, total cholesterol; TG, triglyceride; PYY, peptide YY; SDS, self-rating depression scale; SAS, self-rating anxiety scale.

References

    1. Abbott D. H., Dumesic D. A., Eisner J. R., Colman R. J., Kemnitz J. W. (1998). Insights into the development of polycystic ovary syndrome (PCOS) from studies of prenatally androgenized female rhesus monkeys. Trends Endocrinol. Metab. 9 62–67. 10.1016/S1043-2760(98)00019-8 - DOI - PubMed
    1. Anderson M. (2004). CAP: A FORTRAN Computer Program for Canonical Analysis of Principal Coordinates. Auckland: University of Auckland; 14.
    1. Anderson M. J., Willis T. J. (2003). Canonical analysis of principal coordinates: a useful method of constrained ordination for ecology. Ecology 84 511–525. 10.1890/0012-9658(2003)084[0511:CAOPCA]2.0.CO;2 - DOI
    1. Barber T. M., Dimitriadis G. K., Andreou A., Franks S. (2015). Polycystic ovary syndrome: insight into pathogenesis and a common association with insulin resistance. Clin. Med. 15 s72–s76. 10.7861/clinmedicine.15-6-s72 - DOI - PubMed
    1. Behboudigandevani S., Tehrani F. R., Dovom M. R., Farahmand M., Khomami M. B., Noroozzadeh M., et al. (2016). Insulin resistance in obesity and polycystic ovary syndrome: systematic review and meta-analysis of observational studies. Gynecol. Endocrinol. 32 1–11. 10.3109/09513590.2015.1117069 - DOI - PubMed