. 2016 Mar 15;3(2):ofw037.
doi: 10.1093/ofid/ofw037. eCollection 2016 Mar.

Proteome and Protein Network Analyses of Memory T Cells Find Altered Translation and Cell Stress Signaling in Treated Human Immunodeficiency Virus Patients Exhibiting Poor CD4 Recovery

Affiliations

Proteome and Protein Network Analyses of Memory T Cells Find Altered Translation and Cell Stress Signaling in Treated Human Immunodeficiency Virus Patients Exhibiting Poor CD4 Recovery

Sausan Azzam et al. Open Forum Infect Dis. .

Abstract

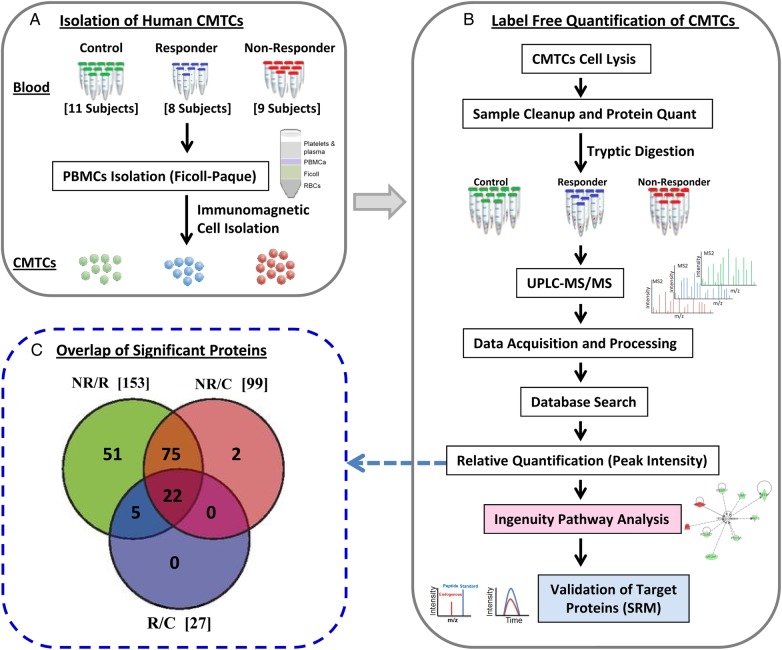
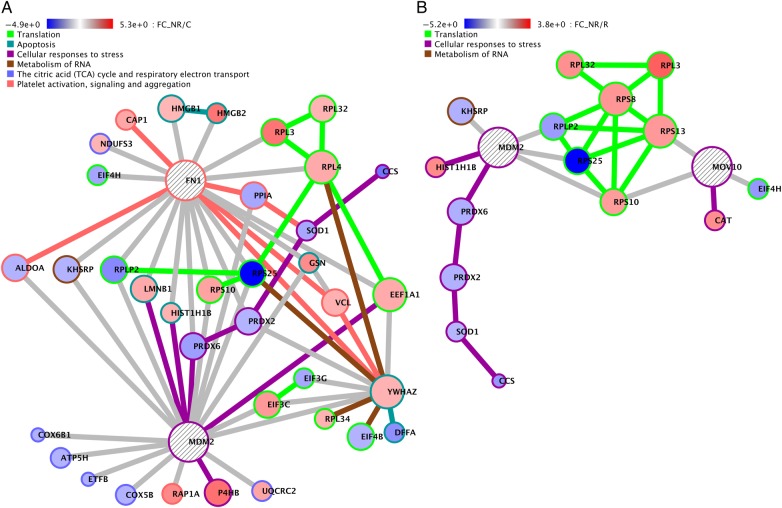
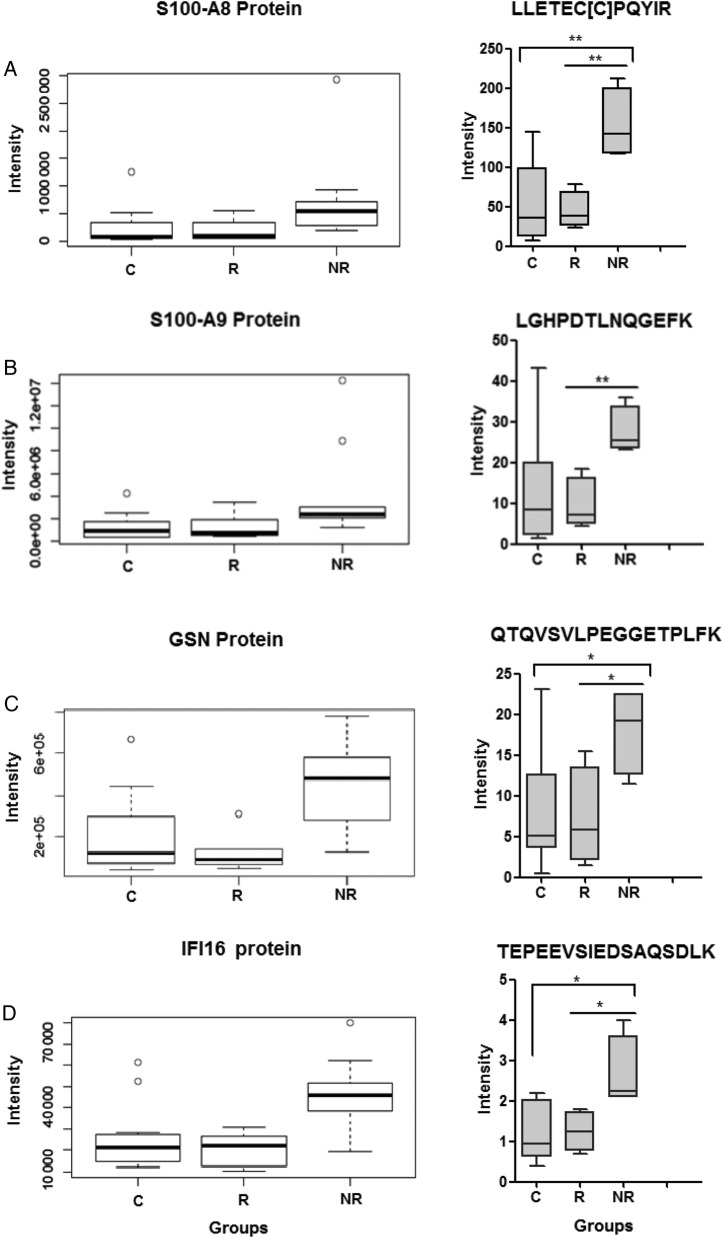
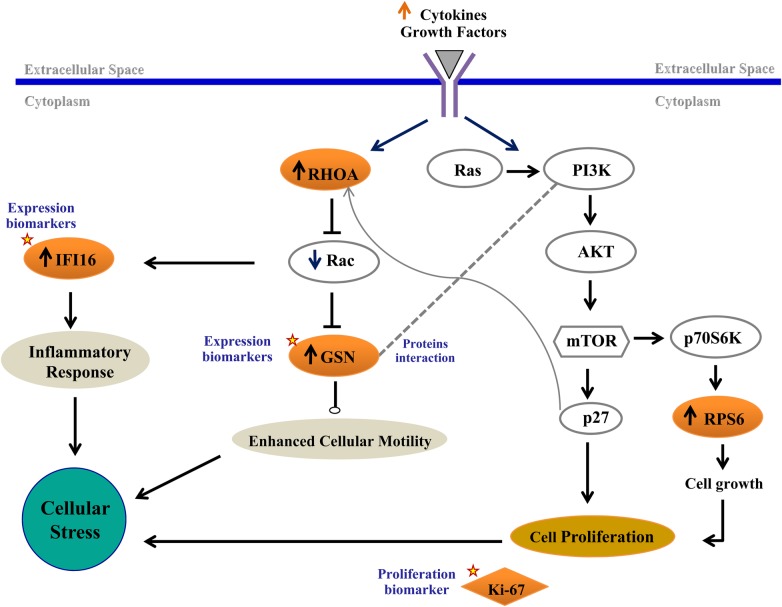
Background. Human immunodeficiency virus (HIV) patients who experience poor CD4 T-cell recovery despite viral suppression during antiretroviral therapy (ART) are known as immunological nonresponders. The molecular mechanism(s) underlying incomplete immune restoration during ART is not fully understood. Methods. Label-free quantitative proteomics on single-cell type central memory T cells were used to reveal relative protein abundance changes between nonresponder, responder (good CD4 recovery during ART), and healthy individuals. Proteome changes were analyzed by protein pathway and network analyses and verified by selected reaction monitoring mass spectrometry. Results. Proteomic analysis across groups detected 155 significant proteins from 1500 nonredundant proteins. Pathway and network analyses revealed dysregulation in mammalian target of rapamycin and protein translation-related proteins and decreases in stress response-related proteins for nonresponder subjects compared with responders and controls. Actin cytoskeleton signaling was increased for HIV responders and nonresponders alike. Conclusions. Memory T cells from immunologic nonresponders have increases in proteins related to motility and protein translation and decreases in proteins capable of responding to cellular stresses compared with responders and controls. The potential for T cells to manage stress and modulate metabolism may contribute to their capacity to reconstitute a lymphopenic host.

Keywords: ART; CMTC; HIV; SRM; proteomics.


Figures

Figure 1.
Figure 1.
Assessing immune activation. Freshly isolated peripheral blood mononuclear cells were examined by flow cytometry to assess frequencies of activated (CD38+) memory T cells and frequencies of proliferating (Ki-67+) T cells. (A) Box-and-whisker plots show the median, interquartile range (box), range (whiskers), and outliers (symbols). The frequencies of CD38+ cells among the CD4+CD45RO+CD62L+ population were increased in human immunodeficiency virus-positive donors but not significantly different across groups. (B) The frequencies of Ki-67+ cells were significantly increased among memory CD4+CD45RO+CD62L+ T cells from nonresponder (NR) subjects compared with healthy controls (Cs) or responder (R) subjects. (C) The spontaneous apoptosis was more frequent among memory CD4+CD62L+CD45RO+ T cells from NR compared with cells from healthy Cs or from R subjects. Statistical analyses were performed with the Kruskal–Wallis test for multigroup comparisons and the Mann–Whitney U test between specific groups.
Figure 2.
Figure 2.
Workflow for quantitative proteomics profiling of central memory T cell (CMTC) for nonresponder (NR), responder (R), and control (C) subjects. Three groups were analyzed in this work: C (n = 11), R (n = 8), and NR (n = 9). (A) Enrichment and isolation of CMTC from blood samples using Ficoll-Paque and immunomagnetic bead isolation technique. (B) Label-free quantitative proteomic approach based on the comparison of the peak intensity of the same peptide, followed by validation of the target proteins by liquid chromatography (LC)-selected reaction monitoring (SRM). (C) Venn diagram indicating the intersections of the identified 155 significant proteins (P ≤ .05, fold change ± 1.5, and 2 or more peptides per protein) across groups: NR/C, R/C, and NR/R. Abbreviation: UPLC, ultra performance LC.
Figure 3.
Figure 3.
Significant protein networks of differentially expressed proteins in nonresponders (NRs) on antiretroviral therapy. Crosstalker networks for the NR/control (C) and NR/responder (R) groups visualize the interactions of proteins in the top enriched pathways. Node circle color indicates relative fold change, and node outline color indicates the pathway within which the protein participates. (A) Three hundred four proteins were input to Crosstalker from the NR/C group, and 284 were mapped to proteins in BioGRID. The analysis removed 82 input proteins, added 6 new proteins, and generated the largest connected network of 140 proteins; 38 of these proteins are in the top enriched pathways and are visualized. (B) Two hundred seventy proteins were input to Crosstalker from the NR/R group, and 249 were mapped to BioGRID. The analysis removed 66, added 6 new proteins, and generated a largest connected network of 133 proteins; 17 of these proteins are in the top enriched pathways and are visualized.
Figure 4.
Figure 4.
Validation of target proteins. Five target proteins were selected for validation via selected reaction monitoring (SRM)-targeted proteomic technique. For each protein, a target peptide was selected, including the following: (A) S100A8 (LLETEC[C]PQYIR), (B) S100A9 (LGHPDTLNQGEFK), (C) GSN (QTQVSVLPEGGETPLFK), and (D) IFI16 (TEPEEVSIEDSAQSDLK). The left panel highlights the peptide intensity-based quantification via label-free analysis for the 5 selected proteins across groups (nonresponder [NR] = 9, responder [R] = 8, and control [C] = 11). Statistical analysis on the normalized data was performed using analysis of variance (ANOVA) model (P ≤ .05) and was visualized using boxplots. The right panel illustrates box-and-whisker plots of the abundance of each peptide via targeted SRM analysis. Statistical analysis on the SRM data was performed using one-way ANOVA, and it is represented by red box for NRs (n = 4), blue box for R (n = 4), and green box for C (n = 8) subjects. *P ≤ .05 and **P ≤ .01 by 2-tailed Student's t test.
Figure 5.
Figure 5.
Working model. Schematic drawing illustrating the network connections between pathways mediating the physiological effects observed in the nonresponder. Proteins highlighted in red correspond to an increase in abundance. Proteins marked by a star were validated in this study. Abbreviations: GSN, gelsolin; mTOR, mammalian target of rapamycin.

Similar articles

Cited by

References

    1. Hammer SM, Squires KE, Hughes MD et al. . A controlled trial of two nucleoside analogues plus indinavir in persons with human immunodeficiency virus infection and CD4 cell counts of 200 per cubic millimeter or less. AIDS Clinical Trials Group 320 Study Team. N Engl J Med 1997; 337:725–33. - PubMed
    1. Gulick RM, Mellors JW, Havlir D et al. . Treatment with indinavir, zidovudine, and lamivudine in adults with human immunodeficiency virus infection and prior antiretroviral therapy. N Engl J Med 1997; 337:734–9. - PubMed
    1. Powderly WG, Landay A, Lederman MM. Recovery of the immune system with antiretroviral therapy: the end of opportunism? JAMA 1998; 280:72–7. - PubMed
    1. Lewden C, Chene G, Morlat P et al. . HIV-infected adults with a CD4 cell count greater than 500 cells/mm3 on long-term combination antiretroviral therapy reach same mortality rates as the general population. J Acquir Immune Defic Syndr 2007; 46:72–7. - PubMed
    1. Torti C, Paiardini M, Gori A. Immunity to human immunodeficiency virus (HIV) infection. Clin Dev Immunol 2012; 2012:629356. - PMC - PubMed