. 2017 Mar 15:8:14796.
doi: 10.1038/ncomms14796.

Complex picture for likelihood of ENSO-driven flood hazard

Affiliations

Complex picture for likelihood of ENSO-driven flood hazard

R Emerton et al. Nat Commun. .

Abstract

El Niño and La Niña events, the extremes of ENSO climate variability, influence river flow and flooding at the global scale. Estimates of the historical probability of extreme (high or low) precipitation are used to provide vital information on the likelihood of adverse impacts during extreme ENSO events. However, the nonlinearity between precipitation and flood magnitude motivates the need for estimation of historical probabilities using analysis of hydrological data sets. Here, this analysis is undertaken using the ERA-20CM-R river flow reconstruction for the twentieth century. Our results show that the likelihood of increased or decreased flood hazard during ENSO events is much more complex than is often perceived and reported; probabilities vary greatly across the globe, with large uncertainties inherent in the data and clear differences when comparing the hydrological analysis to precipitation.


Conflict of interest statement

The authors declare no competing financial interests.

Figures

Figure 1
Figure 1. Time series of three key ERA-20CM-R variables and timing of El Niño and La Niña events.
(a) Three-month running mean sea surface temperature anomaly in the Niño3.4 region (SSTA3.4), and number of grid points globally in which monthly mean river flow (b) exceeds the top 25th percentile and (c) falls below the lower 25th percentile. Solid lines show the mean of the 10 ensemble members, while shading indicates the spread of the members. The SSTA3.4 is used to identify El Niño and La Niña years in the data set, highlighted here by the grey shaded and hatched bars, respectively.
Figure 2
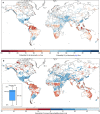
Figure 2. Historical probability of increased or decreased flood hazard during one month of an El Niño.
(a) Probability of abnormally high (blue) or low (red) monthly mean river discharge. Based on the mean of the 10 ERA-20CM-R ensemble members exceeding the 75th percentile, or falling below the 25th percentile, of the 110-year river discharge climatology. (b) Uncertainty around the probability shown in (a), i.e., the difference between the minimum and maximum of the 10 ensemble members (%). The boxplot (b, inset) gives an example graphical representation of the uncertainty range at one grid point, marked on the map by an ‘x', where the mean probability indicated in (a) is 63%. The range is given by the difference between the minimum and maximum of the 10 ensemble members; in this case 53 and 81%, giving a 28% range falling in the 20–40% bracket in (b). The month of February is chosen as, occurring shortly after the peak of an El Niño, it sees extensive spatial coverage of land areas influenced by El Niño.
Figure 3
Figure 3. Comparison of historical probabilities based on precipitation and river flow.
Regions where the difference in probability of abnormally high precipitation compared to probability of high river flow, in the month of February during an El Niño, is greater than 10% (based on the ensemble mean). Pink shading indicates that the probability of high precipitation is smaller than the probability of high river flow, while green shading indicates that probabilities are larger for precipitation.
Figure 4
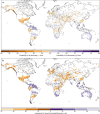
Figure 4. Historical probability of increased or decreased flood hazard during one month of a La Niña.
(a) Probability of abnormally high (purple) or low (orange) monthly mean river discharge in the month of February during a La Niña. Based on the mean of the 10 ERA-20CM-R ensemble members exceeding the 75th percentile, or falling below the 25th percentile, of the 110-year river discharge climatology. (b) Uncertainty around the probability shown in (a), i.e., the difference between the maximum and minimum of the 10 ensemble members (%).
Figure 5
Figure 5. Maximum probability of increased flood hazard during an ENSO event.
Maximum probability of abnormally high river flow in any month during (a) an El Niño event and (b) a La Niña event. Based on the mean of the 10 ERA-20CM-R ensemble members exceeding the 75th percentile, or falling below the 25th percentile, of the 110-year river discharge climatology during, or shortly after the decay of, an ENSO event. Stippling indicates where the uncertainty surrounding this probability is high, i.e., the range of the ensemble members exceeds 25% probability.

References

    1. McPhaden M. J., Zebiak S. E. & Glantz M. H. ENSO as an integrating concept in Earth science. Science 314, 1740–1745 (2006). - PubMed
    1. Chiew F. H. S. & McMahon T. A. Global ENSO-streamflow teleconnection, streamflow forecasting and interannual variability. Hydrolog. Sci. 47, 505–522 (2002).
    1. Ward P. J., Eisner S., Florke M., Dettinger M. D. & Kummu M. Annual flood sensitivities to El Nino-Southern Oscillation at the global scale. Hydrolog. Earth System Sci. 18, 47–66 (2014).
    1. Ward P. J. et al. Strong influence of El Nino southern oscillation on flood risk around the world. Proc. Natl Acad. Sci. 111, 15659–15664 (2014). - PMC - PubMed
    1. Ward P. J., Kummu M. & Lall U. Flood frequencies and durations and their response to El Niño Southern Oscillation: global analysis. J. Hydrol. 539, 358–378 (2016).

Publication types

LinkOut - more resources