Phosphodiesterase-5 inhibition preserves renal hemodynamics and function in mice with diabetic kidney disease by modulating miR-22 and BMP7
- PMID: 28294194
- PMCID: PMC5353686
- DOI: 10.1038/srep44584
Phosphodiesterase-5 inhibition preserves renal hemodynamics and function in mice with diabetic kidney disease by modulating miR-22 and BMP7
Abstract
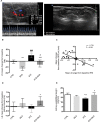
Diabetic Nephropathy (DN) is the leading cause of end-stage renal disease. Preclinical and experimental studies show that PDE5 inhibitors (PDE5is) exert protective effects in DN improving perivascular inflammation. Using a mouse model of diabetic kidney injury we investigated the protective proprieties of PDE5is on renal hemodynamics and the molecular mechanisms involved. PDE5i treatment prevented the development of DN-related hypertension (P < 0.001), the increase of urine albumin creatinine ratio (P < 0.01), the fall in glomerular filtration rate (P < 0.001), and improved renal resistive index (P < 0.001) and kidney microcirculation. Moreover PDE5i attenuated the rise of nephropathy biomarkers, soluble urokinase-type plasminogen activator receptor, suPAR and neutrophil gelatinase-associated lipocalin, NGAL. In treated animals, blood vessel perfusion was improved and vascular leakage reduced, suggesting preserved renal endothelium integrity, as confirmed by higher capillary density, number of CD31+ cells and pericyte coverage. Analysis of the mechanisms involved revealed the induction of bone morphogenetic protein-7 (BMP7) expression, a critical regulator of angiogenesis and kidney homeostasis, through a PDE5i-dependent downregulation of miR-22. In conclusion PDE5i slows the progression of DN in mice, improving hemodynamic parameters and vessel integrity. Regulation of miR-22/BMP7, an unknown mechanism of PDE5is in nephrovascular protection, might represent a novel therapeutic option for treatment of diabetic complications.
Conflict of interest statement
The authors declare no competing financial interests.
Figures


Similar articles
-
Urokinase plasminogen activator receptor and its soluble form in common biopsy-proven kidney diseases and in staging of diabetic nephropathy.Clin Biochem. 2015 Dec;48(18):1324-9. doi: 10.1016/j.clinbiochem.2015.07.001. Epub 2015 Jul 8. Clin Biochem. 2015. PMID: 26162494
-
Expression of Endothelial Cell Injury Marker Cd146 Correlates with Disease Severity and Predicts the Renal Outcomes in Patients with Diabetic Nephropathy.Cell Physiol Biochem. 2018;48(1):63-74. doi: 10.1159/000491663. Epub 2018 Jul 12. Cell Physiol Biochem. 2018. PMID: 30001528
-
Tissue expression of tubular injury markers is associated with renal function decline in diabetic nephropathy.J Diabetes Complications. 2017 Dec;31(12):1704-1709. doi: 10.1016/j.jdiacomp.2017.08.009. Epub 2017 Aug 24. J Diabetes Complications. 2017. PMID: 29037450
-
Soluble Urokinase Receptor and the Kidney Response in Diabetes Mellitus.J Diabetes Res. 2017;2017:3232848. doi: 10.1155/2017/3232848. Epub 2017 May 17. J Diabetes Res. 2017. PMID: 28596971 Free PMC article. Review.
-
[The effect of angiotensin-converting enzyme inhibitors on the progression of chronic renal failure].Presse Med. 2002 Nov 9;31(36):1714-20. Presse Med. 2002. PMID: 12467154 Review. French.
Cited by
-
Targeting the NO-cGMP-PDE5 pathway in COVID-19 infection. The DEDALO project.Andrology. 2021 Jan;9(1):33-38. doi: 10.1111/andr.12837. Epub 2020 Jul 3. Andrology. 2021. PMID: 32526061 Free PMC article.
-
Impact of tadalafil on cardiovascular and organ dysfunction induced by experimental sepsis.Acute Crit Care. 2025 Feb;40(1):46-58. doi: 10.4266/acc.002904. Epub 2025 Feb 12. Acute Crit Care. 2025. PMID: 39978956 Free PMC article.
-
Effects of furosemide and tadalafil in both conventional and nanoforms against adenine-induced chronic renal failure in rats.Eur J Med Res. 2022 Jul 11;27(1):117. doi: 10.1186/s40001-022-00747-3. Eur J Med Res. 2022. PMID: 35820963 Free PMC article.
-
Glycemic control by the SGLT2 inhibitor empagliflozin decreases aortic stiffness, renal resistivity index and kidney injury.Cardiovasc Diabetol. 2018 Jul 30;17(1):108. doi: 10.1186/s12933-018-0750-8. Cardiovasc Diabetol. 2018. PMID: 30060748 Free PMC article.
-
Current Concepts on the Reno-Protective Effects of Phosphodiesterase 5 Inhibitors in Acute Kidney Injury: Systematic Search and Review.J Clin Med. 2020 Apr 29;9(5):1284. doi: 10.3390/jcm9051284. J Clin Med. 2020. PMID: 32365529 Free PMC article. Review.
References
-
- Pofi R. et al.. Diabetic Nephropathy: Focus on Current and Future Therapeutic Strategies. Current drug metabolism 17, 497–502 (2016). - PubMed
Publication types
MeSH terms
Substances
LinkOut - more resources
Full Text Sources
Other Literature Sources
Medical
Miscellaneous

