. 2017 Jul;151(3):324-339.
doi: 10.1111/imm.12733. Epub 2017 Apr 18.

Suppression of murine tumour growth through CD8+ cytotoxic T lymphocytes via activated DEC-205+ dendritic cells by sequential administration of α-galactosylceramide in vivo

Affiliations

Suppression of murine tumour growth through CD8+ cytotoxic T lymphocytes via activated DEC-205+ dendritic cells by sequential administration of α-galactosylceramide in vivo

Hideki Kogo et al. Immunology. 2017 Jul.

Abstract

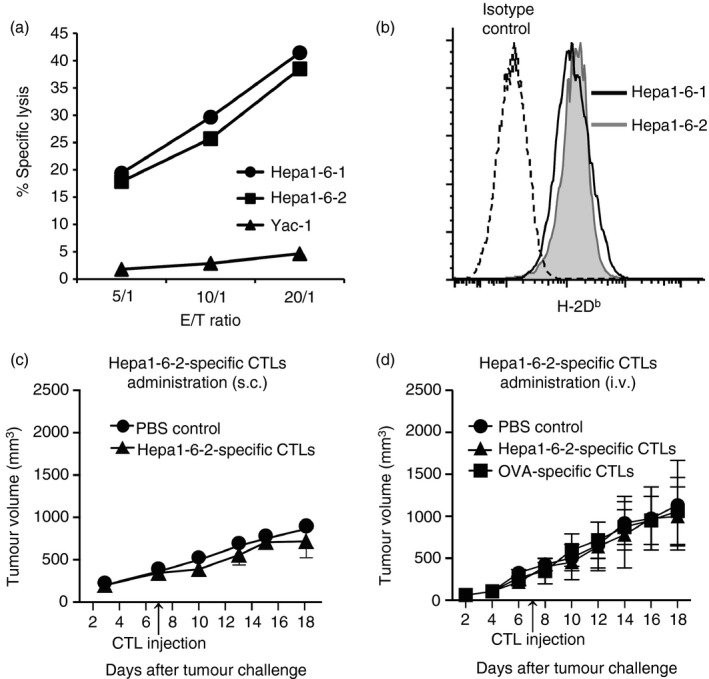
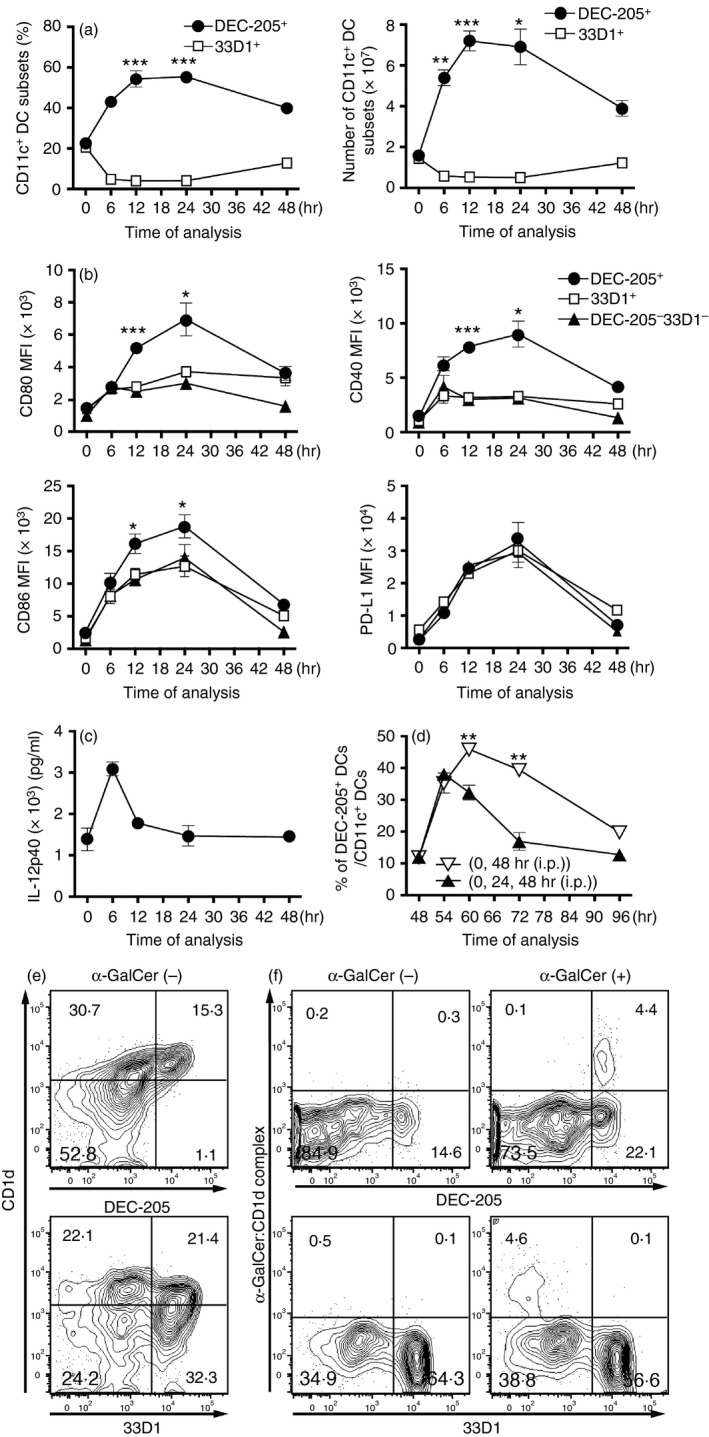
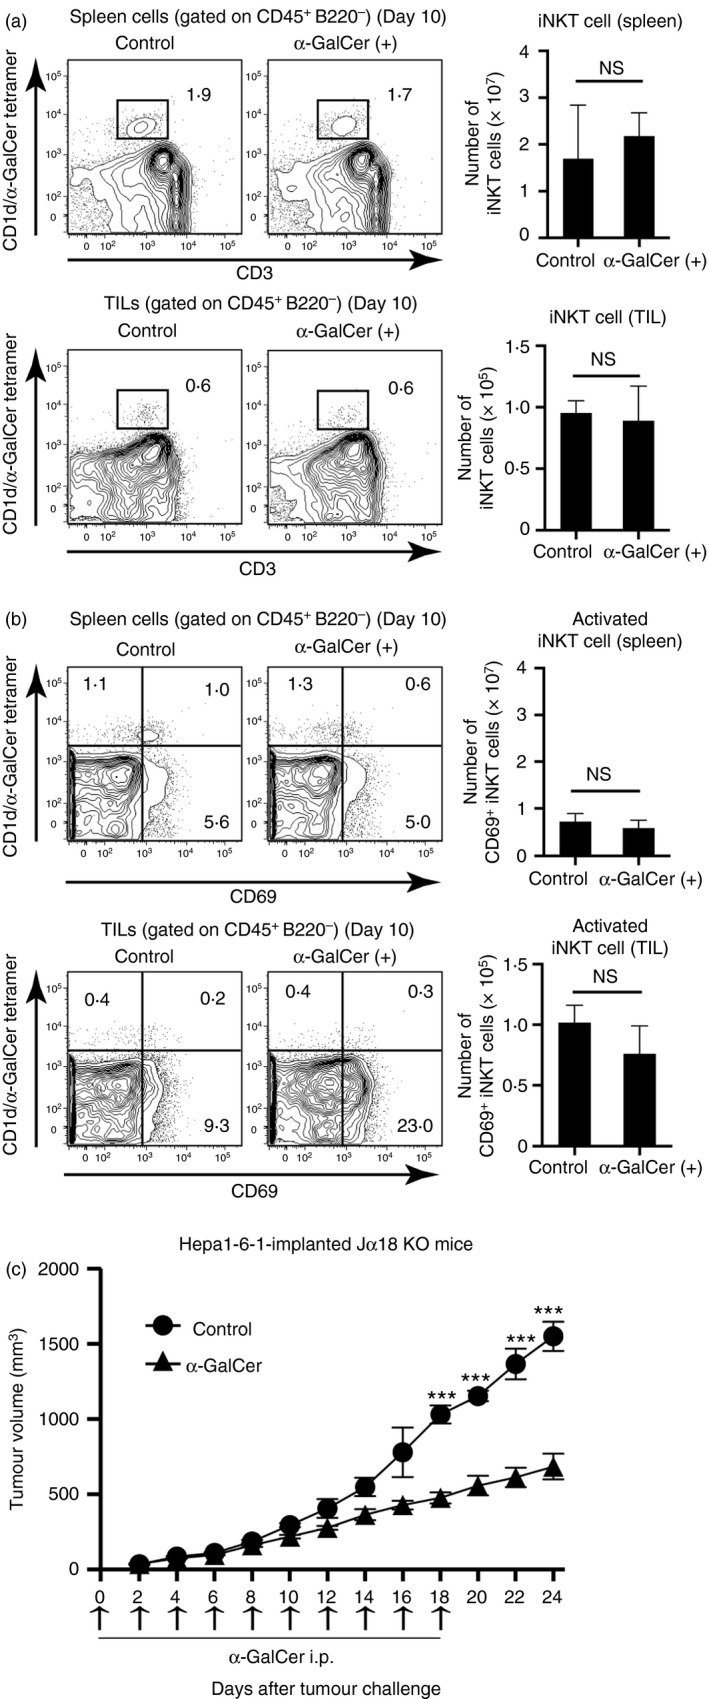
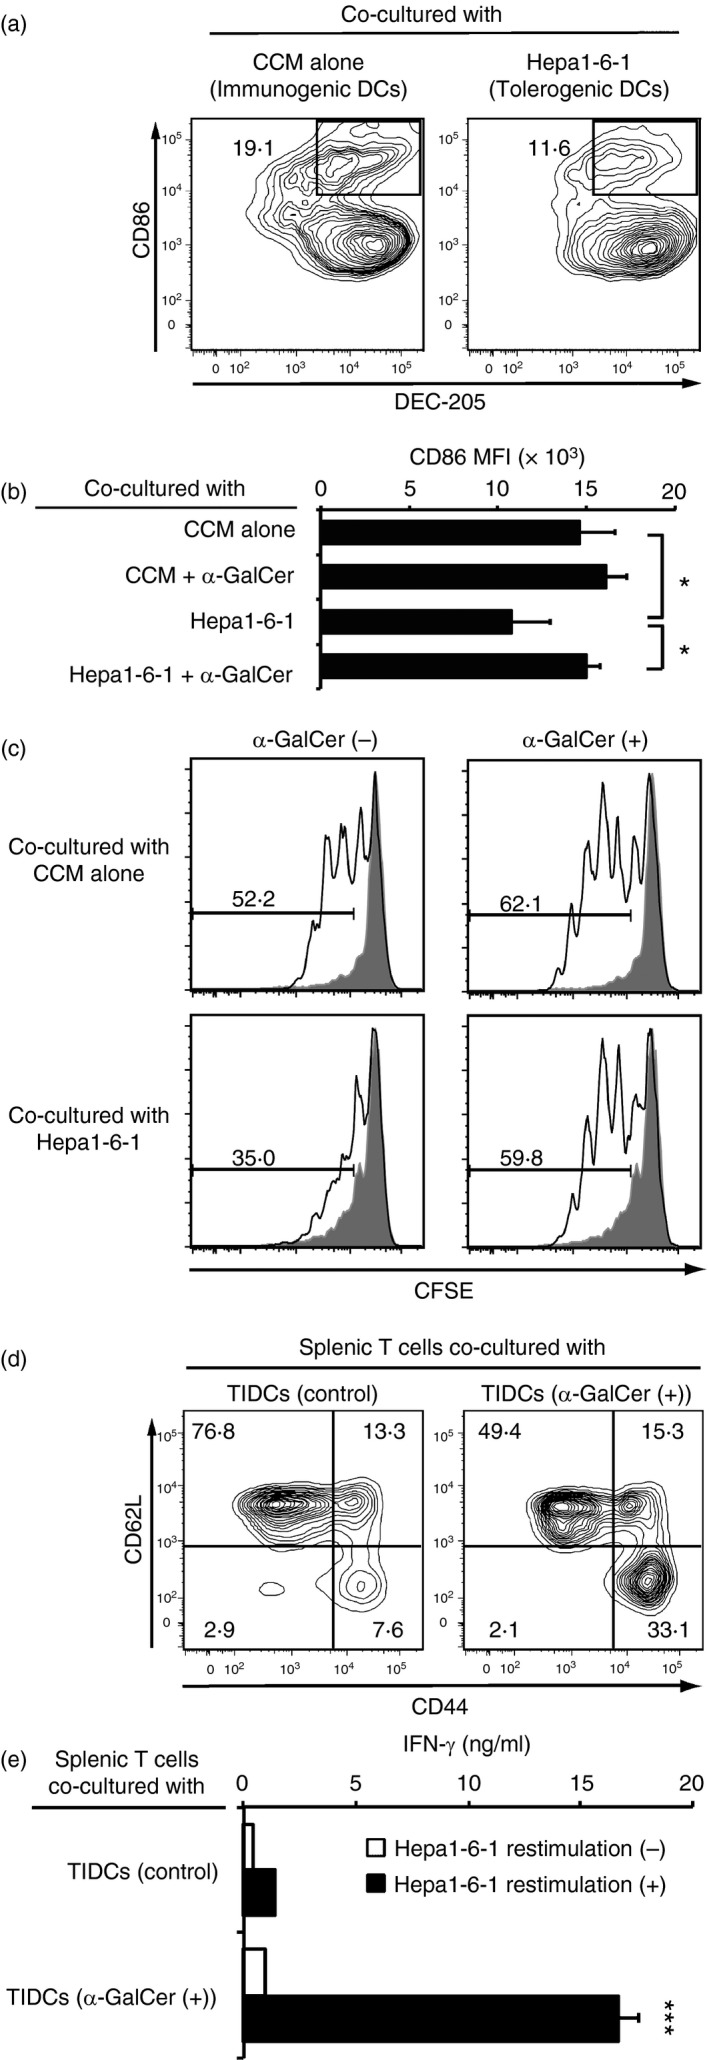
Cancer immunity is mediated through the effective priming and activation of tumour-specific class I MHC molecule-restricted CD8+ cytotoxic T lymphocytes (CTLs). DEC-205+ dendritic cells (DCs) can cross-present the epitope(s) of captured tumour antigens associated with class I MHC molecules alongside co-stimulatory molecules to prime and activate tumour-specific CD8+ CTLs. Immunosuppressive tolerogenic DCs with reduced co-stimulatory molecules may be a cause of impaired CTL induction. Hepa1-6-1 cells were established from the mouse hepatoma cell line Hepa1-6; these cells grow continuously after subcutaneous implantation into syngeneic C57BL/6 (B6) mice and do not prime CD8+ CTLs. In this study, we show that the growth of ongoing tumours was suppressed by activated CD8+ CTLs with tumour-specific cytotoxicity through the administration of the glycolipid α-galactosylceramide (α-GalCer), which is a compound known to stimulate invariant natural killer T (iNKT) cells and selectively activate DEC-205+ DCs. Moreover, we demonstrated that sequential repetitive intraperitoneal inoculation with α-GalCer every 48 hr appeared to convert tolerogenic DEC-205+ DCs into immunogenic DCs with a higher expression of co-stimulatory molecules and a stronger cross-presentation capacity, which primed CTL precursors and induced tumour-specific CD8+ CTLs within the tumour environment without activating iNKT cells. These findings provide a new basis for cancer immunotherapy to convert tolerogenic DEC-205+ DCs within tumours into immunogenic DCs through the sequential administration of an immuno-potent lipid/glycolipid, and then activated immunogenic DCs with sufficient expression of co-stimulatory molecules prime and activate tumour-specific CD8+ CTLs within the tumour to control tumour growth.

Keywords: co-stimulatory molecule; cytotoxic T lymphocytes; tumour-infiltrating dendritic cells; tumour-infiltrating lymphocytes; α-galactosylceramide.


Figures

Figure 1
Figure 1
Effect of the external administration of Hepa1‐6‐2‐specific CD8+ cytotoxic T lymphocytes (CTLs) on Hepa1‐6‐1 tumour growth in vivo. (a) To determine whether Hepa1‐6‐1 or Hepa1‐6‐2 tumour cells could be eliminated by Hepa1‐6‐2‐specific CD8+ CTLs in vitro, a standard chromium‐51 release assay was performed. (b) H‐2Db expression on the Hepa1‐6‐1 and Hepa1‐6‐2 cells evaluated by flow cytometry. (c) Effects of subcutaneous (s.c.) administration of Hepa1‐6‐2‐specific CD8+ CTLs (1 × 10⁶) on a Hepa1‐6‐1 tumour growth were examined. (d) Effects of intravenous (i.v.) administration of Hepa1‐6‐2‐specific CD8+ CTLs (1 × 10⁶) on a Hepa1‐6‐1 tumour growth were examined. Hepa1‐6‐2‐specific CD8+ CTLs were obtained from B6 mice immunized with Hepa1‐6‐2. Ovalbumin (OVA) ‐specific CD8+ CTLs were also examined as a control for i.v. administration. The diameter of the length (a) and the width (b) were measured every day until day 18 after the implantation, and the tumour volume (V) was calculated according to the formula V = ab 2/2. The data are shown as the mean ± SEM of the mice per group (n = 3).
Figure 2
Figure 2
Activation of DEC‐205+ dendritic cells (DCs) in vivo by an intraperitoneal (i.p.) injection of α‐GalCer in B6 mice. (a) Spleen cells were prepared from normal B6 mice 6, 12, 24 and 48 hr after an i.p. injection with 2 μg/mouse α‐GalCer, and the kinetics of the percentage (left panel) and the number (right panel) of the DEC‐205+ or 33D1+ cells among the CD11c+ DCs were analysed by flow cytometry and haemocytometer. The data are shown as the mean ± SEM of the mice per group (n = 3), *P < 0·05, **P < 0·01 and ***P < 0·005, Student's t‐test. (b) Similarly, spleen cells were prepared from the B6 mice 6, 12, 24 and 48 hr after an i.p. injection with 2 μg/mouse α‐GalCer, and the expression of CD80, CD86, CD40 and PD‐L1 on either the DEC‐205+, the 33D1+, or the DEC‐20533D1 DCs was analysed by flow cytometry. The data are shown as the mean ± SEM of the mice per group (n = 3), *P < 0·05, **P < 0·01 and ***P < 0·005, Student's t‐test, which compared the expression of co‐stimulatory molecules on DEC‐205+ DCs with that of 33D1+ DCs. (c) The amount of interleukin‐12p40 (IL‐12p40) secretion in the serum from B6 mice 6, 12, 24 and 48 hr after an i.p. injection with 2 μg/mouse α‐GalCer was determined by ELISA. The data are shown as the mean ± SEM of the mice per group (n = 5). (d) Spleen cells were prepared from B6 mice 6, 12, 24 and 48 hr after i.p. administration with 2 μg/mouse α‐GalCer at 0 hr, 24 hr and 48 hr (every 24 hr; closed triangle) or at 0 hr and 48 hr (every 48 hr; open triangle), and the kinetics in the percentages of DEC‐205+ cells among the CD11c+ DCs was analysed by flow cytometry. The data are shown as the mean ± SEM of the mice in each group (n = 3), **P < 0·05, Student's t‐test. (e) CD1d expression on splenic DEC‐205+ DCs and 33D1+ DCs obtained from B6 mice. (f) α‐GalCer:CD1d complex expression on splenic DEC‐205+ DCs and 33D1+ DCs obtained from B6 mice 6 hr after i.p. injection with 2 μg/mouse α‐GalCer.
Figure 3
Figure 3
Effects of the selective activation of tumour‐infiltrating dendritic cells (TIDCs) within the Hepa1‐6‐1 tumour mass from sequential administration of α‐GalCer every other day on tumour regression. (a) To determine the effect of the selective activation of TIDCs within the Hepa1‐6‐1 tumour mass from a Day 0 single intraperitoneal (i.p.) administration of 20 μg/mouse α‐GalCer on tumour regression, the diameters of the length (a) and the width (b) of the tumours was measured every day until day 20 after the implantation, and the tumour volume (V) was calculated according to the formula V = ab 2/2. The data are shown as the mean ± SEM of the mice per group (n = 3). (b) To estimate the effect of the selective activation of TIDCs within the Hepa1‐6‐1 tumour mass from an i.p. administration of 2 μg/mouse α‐GalCer every other day on tumour regression, the diameter of the length (a) and the width (b) of the tumour was measured daily until day 24 after the implantation, and the tumour volume (V) was calculated according to the formula V = ab 2/2 . The data are shown as the mean ± SEM of the mice per group (n = 21). (c) Observation of the growth kinetics of the treated or untreated mice until day 24 after the Hepa1‐6‐1 cells implantation. Scale bars, 10 mm. (d) We measured and plotted the volume of each tumour 24 days after the implantation (n = 21). The data are shown as the mean ± SEM of mice per group (n = 21), ***P < 0·005, Student's t‐test. (e) Tumour volume in CD8+ T cell, CD4+ T cell, and natural killer (NK) cell deletion mice with an i.p. administration of 2 μg/mouse α‐GalCer every other day. For interleukin‐12 (IL‐12) treatment of mice, 100 ng of IL‐12p70 was injected i.p. every other day from day 0 to day 18. The data are shown as the mean ± SEM of the mice per group (n = 6 to n = 8). (f) Serum IL‐12 level in α‐GalCer‐administered mice. The data are shown as the mean ± SEM of the mice per group (n = 6).
Figure 4
Figure 4
Effect of the sequential intraperitoneal (i.p.) administration of α‐GalCer into the Hepa1‐6‐1 tumour‐bearing mice on the activation of CD8+ tumour‐infiltrating lymphocytes (TILs) and tumour‐infiltrating dendritic cells (TIDCs). (a) CD69 expression on the TILs of the α‐GalCer‐treated B6 mice was analysed by flow cytometry 7, 10 and 14 days after the Hepa1‐6‐1 cell implantation. CD69 expression on TILs (first lane), the percentage of CD8+ T cells (second lane), CD69 expression on CD8+ T cells (third lane), and the CD69 expression on NK1.1+ NK cells among TILs (fourth lane) were examined. The data are representative of n = 4 mice per group. (b and c) Administration of α‐GalCer to the tumour‐bearing mice altered the level of co‐stimulatory molecule expression on the TIDCs. The phenotype and expression of the co‐stimulatory molecules on the TIDCs in the tumour‐bearing mice treated with α‐GalCer were examined. The expression of the co‐stimulatory molecules CD80 and CD86 on the DEC205+ CD11c+ MHC‐II+ TIDCs or 33D1+ CD11c+ MHC‐II+ TIDCs from the B6 mice injected with/without α‐GalCer 10 days after the Hepa1‐6‐1 cell implantation was analysed by flow cytometry. The data are shown as the mean + SEM of the mice per group (n = 4), *P < 0·05, Student's t‐test. n.s., not significant.
Figure 5
Figure 5
Comparison of the number and activation of invariant natural killer T (iNKT) cells between the α‐GalCer‐treated and untreated mice. (a) The percentage of CD1d/α‐GalCer tetramer+ CD3+ cells in the spleen and the tumour‐infiltrating lymphocytes (TILs) from B6 mice injected with/without α‐GalCer 10 days after Hepa1‐6‐1 cell implantation were analysed by flow cytometry. The data are shown as the mean + SEM of the mice per group (n = 4), Student's t‐test. (b) The percentage of CD69+ iNKT cells in the spleen or in the TILs of the mice treated with α‐GalCer was analysed by flow cytometry. The data are shown as the mean + SEM of the mice per group (n = 4), Student's t‐test. n.s., not significant. (c) Tumour volume in iNKT‐deficient Jα18(–/–) (Jα18 KO) mice15 with sequential intraperitoneal (i.p.) administration of 2 μg/mouse α‐GalCer every other day. Hepa1‐6‐1 tumour cells were implanted on day 0. The data are shown as the mean ± SEM of the mice per group (n = 5), ***P < 0·005, Student's t‐test.
Figure 6
Figure 6
Sequential administration of α‐GalCer in vivo every other day induced the priming of Hepa1‐6‐1‐specific CD8+ cytotoxic T lymphocytes (CTLs) and tumour‐infiltrating lymphocytes (TILs). (a) Four million spleen cells from sequentially α‐GalCer‐treated mice implanted with Hepa‐1‐6‐1 cells 25 days before were re‐stimulated in vitro, and a standard chromium‐51‐release assay was performed. The data are shown as the mean ± SEM of the cells per group (n = 4). (b) CFSE‐labelled splenic CD8+ T cells from the primed mice were stimulated for 4 days with complete culture medium alone, with tumour‐infiltrating dendritic cells (TIDCs) from untreated mice 20 days after Hepa1‐6‐1 cell implantation, or with TIDCs from α‐GalCer‐treated mice 20 days after Hepa1‐6‐1 cell implantation. The co‐cultured cells were then harvested and analysed to determine the number of cell divisions using flow cytometry. The data are representative of n = 3 mice per group. (c) The ex vivo cytotoxic activity of the CD8+ TILs within the Hepa1‐6‐1‐derived tumour mass of the α‐GalCer‐treated mice implanted with Hepa1‐6‐1 cells 24 days before was determined by a standard chromium‐51‐release assay. The data are shown as the mean + SEM of the number of cells per group (n = 3).
Figure 7
Figure 7
Effects of α‐GalCer on converting tolerogenic DEC‐205+ DCs+ induced by Hepa1‐6‐1 tumour cells into immunogenic dendritic cells (DCs) in vitro. (a) The DCs were incubated with Hepa1‐6‐1 cells for 5 days in the trans‐well system and their expression of CD86 was analysed by flow cytometry. The data are representative of n = 3 mice per group. (b) Those tolerated DCs were treated with complete culture medium (CCM) containing 100 ng/ml α‐GalCer in the presence of Hepa1‐6‐1 cells using a trans‐well system for an additional 24 hr, and their expression of CD86 was analysed by flow cytometry. The data are shown as the mean + SEM of the cells per group (n = 3), *P < 0·05, Student's t‐test. (c) 5 × 10⁴ of α‐GalCer‐treated recovered DCs were re‐stimulated with the lysate of 5 × 10³ Hepa1‐6‐1 cells and 100 ng/ml α‐GalCer for an additional 48 hr and the antigen‐loaded DCs were washed extensively to remove the free tumour lysate. Then the cells were co‐cultured with 1 × 10⁵ Hepa1‐6‐2‐primed splenic CD8+ T cells labelled with CFSE for 4 days after and analysed by flow cytometry. Shaded portions indicate the number of division of primed T cells co‐cultured with antigen unloaded DCs. The data are representative of n = 3 mice per group. (d) 5 × 10⁵ splenic naive T cells from normal B6 mice were co‐cultured with 1 × 10⁵ TIDCs from Hepa1‐6‐1‐bearing mice injected intraperitoneally (i.p.) with 2 μg/mouse α‐GalCer every other day for 14 days, and their surface expression of CD44 and CD62L was examined by flow cytometry. (e) The amount of secreted interferon‐γ (IFN‐γ) after stimulation with Hepa1‐6‐1 cells for a further 48 hr was measured by ELISA. The data are shown as the mean + SEM of the cells per group (n = 3), ***P < 0·005, Student's t‐test.

References

    1. Buller RM, Holmes KL, Hugin A, Frederickson TN, Morse HC 3rd. Induction of cytotoxic T‐cell responses in vivo in the absence of CD4 helper cells. Nature 1987; 328:77–9. - PubMed
    1. Germain RN. MHC‐dependent antigen processing and peptide presentation: providing ligands for T lymphocyte activation. Cell 1994; 76:287–99. - PubMed
    1. Takahashi H. Antigen presentation in vaccine development. Comp Immunol Microbiol Infect Dis 2003; 26:309–28. - PubMed
    1. Takahashi H, Takeshita T, Morein B, Putney S, Germain RN, Berzofsky JA. Induction of CD8+ cytotoxic T cells by immunization with purified HIV‐1 envelope protein in ISCOMs. Nature 1990; 344:873–5. - PubMed
    1. Takahashi H, Nakagawa Y, Yokomuro K, Berzofsky JA. Induction of CD8+ cytotoxic T lymphocytes by immunization with syngeneic irradiated HIV‐1 envelope derived peptide‐pulsed dendritic cells. Int Immunol 1993; 5:849–57. - PubMed

Publication types

MeSH terms