. 2017 Aug;6(4):e00461.
doi: 10.1002/mbo3.461. Epub 2017 Mar 15.

Nitric oxide-enhanced Shiga toxin production was regulated by Fur and RecA in enterohemorrhagic Escherichia coli O157

Affiliations

Nitric oxide-enhanced Shiga toxin production was regulated by Fur and RecA in enterohemorrhagic Escherichia coli O157

Kimitoshi Ichimura et al. Microbiologyopen. 2017 Aug.

Abstract

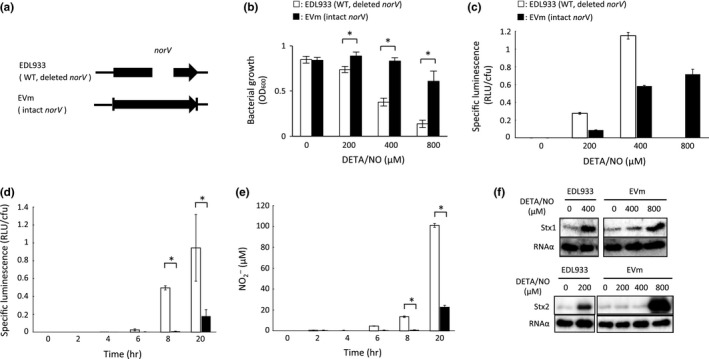
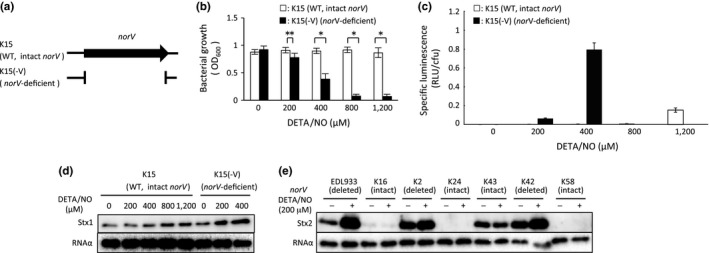
Enterohemorrhagic Escherichia coli (EHEC) produces Shiga toxin 1 (Stx1) and Shiga toxin 2 (Stx2). Nitric oxide (NO), which acts as an antimicrobial defense molecule, was found to enhance the production of Stx1 and Stx2 in EHEC under anaerobic conditions. Although EHEC O157 has two types of anaerobic NO reductase genes, an intact norV and a deleted norV, in the deleted norV-type EHEC, a high concentration of NO (12-29 μmol/L, maximum steady-state concentration) is required for enhanced Stx1 production and a low concentration of NO (~12 μmol/L, maximum steady-state concentration) is sufficient for enhanced Stx2 production under anaerobic conditions. These results suggested that different concentration thresholds of NO elicit a discrete set of Stx1 and Stx2 production pathways. Moreover, the enhancement of Shiga toxin production in the intact norV-type EHEC required treatment with a higher concentration of NO than was required for enhancement of Shiga toxin production in the deleted norV-type EHEC, suggesting that the specific NorV type plays an important role in the level of enhancement of Shiga toxin production in response to NO. Finally, Fur derepression and RecA activation in EHEC were shown to participate in the NO-enhanced Stx1 and Stx2 production, respectively.

Keywords: Fur; NO reductase; RecA; Shiga toxin; enterohemorrhagic Escherichia coli; nitric oxide.


Figures

Figure 1
Figure 1
Real‐time quantification of NO concentration and growth of EHEC in the presence of various NO donors under anaerobic conditions. (a) The NO steady‐state levels in LB broth (pH 7.0) in the presence of various NO donors were measured using an amiNO‐2000 NO electrode at 37°C under anaerobic conditions. Representative NO electrode data are shown (= 3). (b, c) EHEC strains grown overnight were diluted with LB broth containing various concentrations of NO donor and grown statically for 24 hr at 37°C under anaerobic conditions. The OD 600 in culture was measured by spectrophotometer at the indicated times. Data are the means ± standard deviations of values from three experiments. Results are shown for the deleted norV‐type wild EHEC EDL933 (b) and the intact norV‐type wild EHEC K15 (c).
Figure 2
Figure 2
NO enhances Shiga toxin production and RecA expression in the deleted norV‐type EHEC under anaerobic conditions. EHEC EDL933 grown overnight was diluted with LB broth containing DETANONOate (DETA/NO) and then grown statically at 37°C under anaerobic conditions. (a) EHEC strains were fractionated into the cell‐associated fractions at the indicated times. A 0.2 μg sample of each protein of the cell‐associated fraction was analyzed by Immunoblot analysis using anti‐Stx1 antiserum, anti‐RecA antibody, and anti‐RNA α antibody as an internal control. (b) EHEC strains were fractionated into the cell‐associated fractions at 18 hr. A 0.2 μg sample of each protein of the cell‐associated fraction was analyzed by Immunoblot analysis using anti‐Stx1 antiserum and anti‐RNA α antibody as an internal control. (c) EHEC strains were fractionated into the cell‐associated fractions and the culture supernatant fractions at the indicated times. A 0.2 μg sample of each protein of the cell‐associated fraction was analyzed by Immunoblot analysis using anti‐RecA antibody and anti‐RNA α antibody as an internal control. Each volume, which corresponds to 0.2 μg of protein of the cell‐associated fraction, of the supernatant fraction was analyzed by Immunoblot analysis using anti‐Stx2 antiserum. (d) EHEC strains were fractionated into the cell‐associated fraction and the culture supernatant fractions at 18 hr. A 0.2 μg sample of each protein of the cell‐associated fraction was analyzed by Immunoblot analysis using anti‐RecA antibody and anti‐RNA α antibody as an internal control. Each volume, which corresponds to 0.2 μg of protein of the cell‐associated fraction, of the supernatant fraction was analyzed by Immunoblot analysis using anti‐Stx2 antiserum.
Figure 3
Figure 3
Effect of two kinds of NO donors, inactivated NO donor and NO metabolite, on Shiga toxin production in the deleted norV‐type EHEC under anaerobic conditions. EHEC EDL933 grown overnight were diluted with LB broth containing various concentrations of NO donors [NOC12 (a) or Spermine‐NONOate (Sper/NO) (a)], inactivated NO donor (b) or NO metabolite (c, d) and then grown statically for 18 hr at 37°C under anaerobic conditions. The culture supernatant fractions and cell‐associated fractions from the culture of EHEC strains were collected. The cell‐associated fractions were analyzed by Immunoblot analysis using anti‐Stx1 antiserum and anti‐RNA α antibody as an internal control. The culture supernatant fractions were analyzed by Immunoblot analysis using anti‐Stx2 antiserum. The relative amounts of Stx1 and Stx2 were quantified by densitometry and normalized to internal control RNA α . Data are the means ± standard deviations of values from four experiments. *p < 0.01; N. S., not significant.
Figure 4
Figure 4
Effect of NO on Stx2 production in wild and hmpA‐deficient mutant EHEC strains under aerobic conditions. The deleted norV‐type wild EDL933 and the deleted norV‐type hmpA‐deficient EH grown overnight were diluted with LB broth containing various concentrations of DETANONOate (DETA/NO) and grown statically for 18 hr at 37°C under aerobic conditions. (a) The optical density at 600 nm (OD 600) was determined. NO level in the deleted norV‐type wild EDL933 in medium. EHEC strains harboring the NO reporter plasmid pRPL3 were cultured in LB medium containing a various concentrations of DETA/NO for 18 hr at 37°C under aerobic conditions. Relative light units (RLU) and the number of bacteria were measured by a luminometer and bacteria plate counts (cfu), respectively. Data are the means ± standard deviations of values from three experiments. *p < 0.01. (b) EHEC strains were fractionated into the supernatant fraction and cell‐associated fractions. They were then analyzed by Immunoblot analysis using anti‐Stx2 antiserum and anti‐RNA α antibody, respectively. The relative amounts of Stx2 were quantified by densitometry and normalized to internal control RNA α. The inductions of hmpA in wild‐type EHEC were analyzed by real‐time qRTPCR. Data are the means ± standard deviations of values from five experiments. *p < 0.01
Figure 5
Figure 5
Role of intact NorV in NO‐mediated anaerobic growth inhibition, NO level in bacterial cells and Shiga toxin production in EHEC under anaerobic conditions. (a) Gene structure of the norV in the deleted norV‐type wild EHEC EDL933 and the intact norV‐replacement mutant EHEC EVm. (b) Comparison of NO‐mediated anaerobic growth inhibition between the deleted norV‐type EDL933 and the intact norV‐type EVm. EHEC strains were cultured in LB medium containing various concentrations of DETANONOate (DETA/NO) for 18 hr at 37°C under anaerobic conditions. The optical density at 600 nm (OD 600) was measured. Data are the means ± standard deviations of values from five experiments. *p < 0.01. (c) Comparison of the NO level in bacterial cells in medium between the deleted norV‐type EDL933 and the intact norV‐type EVm. EHEC strains harboring the NO reporter plasmid pRPL3 were cultured in LB medium containing various concentrations (200 or 400 μmol/L for EDL933; 200, 400 or 800 μmol/L for EVm) of DETA/NO for 18 hr at 37°C under anaerobic conditions. Relative light units (RLU) and the number of bacteria were measured by a luminometer and bacteria plate counts (cfu), respectively. Data are the means ± standard deviations of values from three experiments. (d, e) NO level in the deleted norV‐type EDL933 within macrophages and the concentration of the NO metabolite NO 2 in the culture medium of infected macrophages. The EHEC strain harboring the NO reporter plasmid pRPL3 was added to the monolayer of RAW264.7 cells, and incubated for 20 min (0 hr). The medium was changed to include 100 μg/ml gentamicin. After 2 hr, the cells were washed, and the medium was changed to include 12 μg/ml gentamicin with (black) or without (white) 4 mM NOS inhibitor, L‐NMMA. The infected monolayers were either lysed or further incubated. The RLU and number of surviving bacteria were determined by luminometry and bacteria plate counts (cfu) (d). The concentrations of NO metabolite NO 2 in medium were determined by Griess assay (e). Data are the means ± standard deviations of values from three experiments. *p < 0.01. (f) Comparison of NO‐enhanced Shiga toxin production between the deleted norV‐type EDL933 and the intact norV‐type EVm. EHEC strains were cultured in LB medium containing various concentrations of DETA/NO for 18 hr at 37°C under anaerobic conditions. EHEC strains were fractionated into culture supernatant fractions and cell‐associated fractions. A 0.2 μg sample of each protein of the cell‐associated fraction was analyzed by Immunoblot analysis using anti‐Stx1 antiserum and anti‐RNA α antibody as an internal control. Each volume, which corresponds to 0.2 μg of protein of the cell‐associated fraction, of the supernatant fraction was analyzed by Immunoblot analysis using anti‐Stx2 antiserum.
Figure 6
Figure 6
Comparison of NO‐mediated anaerobic growth inhibition, the NO level in bacterial cells and NO‐induced Shiga toxin production between intact norV‐type EHEC and norV‐deficient EHEC under anaerobic conditions. (a) Gene structure of the norV in the intact norV‐type wild EHEC K15 and norV‐deficient mutant EHEC K15(‐V). (b) Comparison of NO‐mediated anaerobic growth inhibition between the intact norV‐type K15 and norV‐deficient K15(‐V). EHEC strains were grown with LB medium containing various concentrations of DETANONOate (DETA/NO) for 18 hr at 37°C under anaerobic conditions. The optical density at 600 nm (OD 600) was monitored. Data are the means ± standard deviations of values from five experiments. *p < 0.01; **p < 0.05. (c) Comparison of the NO level in bacterial cells in medium between the intact norV‐type K15 and the norV‐deficient K15(‐V). EHEC strains harboring the NO reporter plasmid pRPL3 were cultured in LB medium containing various concentrations [200, 400, 800, or 1200 μmol/L for K15; 200 or 400 μmol/L for K15(‐V)] of DETA/NO for 18 hr at 37°C under anaerobic conditions. Relative light units (RLU) and the number of bacteria were measured by a luminometer and bacteria plate counts (cfu), respectively. (d) Comparison of NO‐enhanced Shiga toxin production between the intact norV‐type K15 and norV‐deficient K15(‐V). EHEC strains grown containing various concentrations of DETA/NO for 18 hr at 37°C under anaerobic conditions. EHEC strains were fractionated into culture supernatant fractions and cell‐associated fractions. A 0.2 μg sample of each protein of the cell‐associated fraction was analyzed by Immunoblot analysis using anti‐Stx1 antiserum and anti‐RNA α antibody as an internal control. (e) E. coli strains were cultured with LB broth containing 200 μmol/L DETA/NO for 18 hr at 37°C under anaerobic conditions. EHEC strains were fractionated into culture supernatant fractions and cell‐associated fractions. Each volume, which corresponds to 0.2 μg of protein of the cell‐associated fraction, of the supernatant fraction was analyzed by Immunoblot analysis using anti‐Stx2 antiserum. A 0.2 μg sample of each protein of the cell‐associated fraction was analyzed by Immunoblot analysis using anti‐RNA α antibody as an internal control.
Figure 7
Figure 7
Effects of NO on Stx1 and Stx2 production in various mutant EHEC under anaerobic conditions. (a) Effects of NO on Stx1 production in wild EHEC EDL933, Q‐deficient mutant EHEC E1Q1 and P stx1‐deficient mutant EHEC EP under anaerobic conditions. EHEC were cultured in medium containing 400 μmol/L DETANONOate (DETA/NO) for 18 hr at 37°C under anaerobic conditions. EHEC were fractionated into cell‐associated fractions. A 0.2 μg sample of each protein of the cell‐associated fraction was analyzed by Immunoblot analysis using anti‐Stx1 antiserum and anti‐RNA α antibody as an internal control. (b) Promoter sequence of stx1 and schematic representation of various stx1 promoter‐luxCDABE fusion genes utilized in the mutation analysis. The arrows indicate a Fur box, and the boxed region within the Fur box is a mutated site. The −35 and −10 regions of the proposed promoter are underlined. The number indicates the nucleotide position with base pairs upstream of the start codon (+1) of stx1. (c) Comparison of the specific luminescence of EDL933 harboring an stx1 reporter plasmid, pluxStx1P2, fur‐deficient EDLf harboring pluxStx1P2 and EDL933 harboring a mutated stx1 reporter plasmid, pluxStx1PGG6. Reporters were cultured in LB broth supplemented with or without 100 μmol/L PROLINONOate (PROLI/NO) or 200 μmol/L deferoxamine at 37°C and then were collected after 20 min for the estimation of specific luminescence. Data are the means ± standard deviations of values from three experiments. *p < 0.01; N.S., not significant. (d) Effects of NO on Stx2 production in the EHEC EDL933, recA‐deficient mutant EHEC ERA1‐1 and recA point‐mutant EHEC strains under anaerobic conditions. EHEC strains were grown with LB broth containing 200 μmol/L DETANONOate (DETA/NO) for 18 hr at 37°C under anaerobic conditions. EHEC strains were fractionated into culture supernatant fractions and cell‐associated fractions. Each volume, which corresponds to 0.2 μg of protein of the cell‐associated fraction, of the supernatant fraction was analyzed by Immunoblot analysis using anti‐Stx2 antiserum. The cell‐associated fraction protein was analyzed by Immunoblot analysis using anti‐RecA antibody and anti‐RNA α antibody as an internal control.

Similar articles

Cited by

References

    1. Adikesavan, A. K. , Katsonis, P. , Marciano, D. C. , Lua, R. , Herman, C. , & Lichtarge, O. (2011). Separation of recombination and SOS response in Escherichia coli RecA suggests LexA interaction sites. PLoS Genetics, 7, e1002244. - PMC - PubMed
    1. Bogdan, C. (2001). Nitric oxide and the immune response. Nature Immunology, 2, 907–916. - PubMed
    1. Branchu, P. , Matrat, S. , Vareille, M. , Garrivier, A. , Durand, A. , Crepin, S. , … Gobert, A. P. (2014). NsrR, GadE, and GadX interplay in repressing expression of the Escherichia coli O157:H7 LEE pathogenicity island in response to nitric oxide. PLoS Pathogens, 10, e1003874. - PMC - PubMed
    1. Calderwood, S. B. , Auclair, F. , Donohue‐Rolfe, A. , Keusch, G. T. , & Mekalanos, J. J. (1987). Nucleotide sequence of the Shiga‐like toxin genes of Escherichia coli . Proceedings of the National Academy of Sciences USA, 84, 4364–4368. - PMC - PubMed
    1. Calderwood, S. B. , & Mekalanos, J. J. (1987). Iron regulation of Shiga‐like toxin expression in Escherichia coli is mediated by the fur locus. Journal of Bacteriology, 169, 4759–4764. - PMC - PubMed

Publication types

MeSH terms

LinkOut - more resources