

Phenotypical analysis of ectoenzymes CD39/CD73 and adenosine receptor 2A in CD4+ CD25high Foxp3+ regulatory T-cells in psoriasis
- PMID: 28295154
- PMCID: PMC5811786
- DOI: 10.1111/ajd.12561
Phenotypical analysis of ectoenzymes CD39/CD73 and adenosine receptor 2A in CD4+ CD25high Foxp3+ regulatory T-cells in psoriasis
Abstract
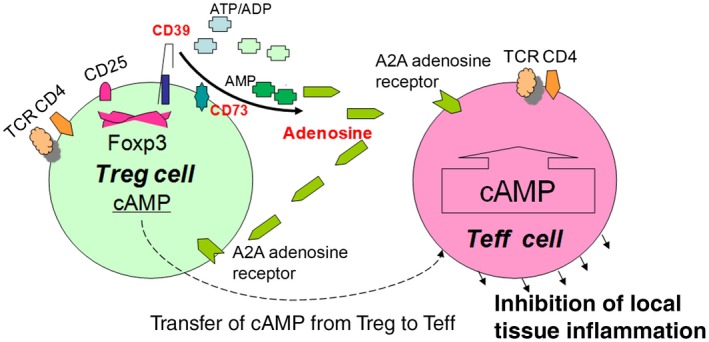
Background: CD39 and CD73 are two novel cell surface markers of CD25high Foxp3+ regulatory T-cells (Tregs). Concordant expression of these two ectoenzymes not only discriminate Tregs from other cell populations, but also generates pericellular adenosine, which has been reported to suppress proliferation of activated T effector (Teff) cells. Because it is currently unclear whether human ectoenzymes (CD39/CD73) are involved in the impaired suppressive activity of Tregs in psoriasis, we examined the frequencies and phenotypes of CD39/CD73-expressing Tregs and related receptor adenosine receptor 2A (A2A R) in peripheral blood of patients with different types of psoriasis.
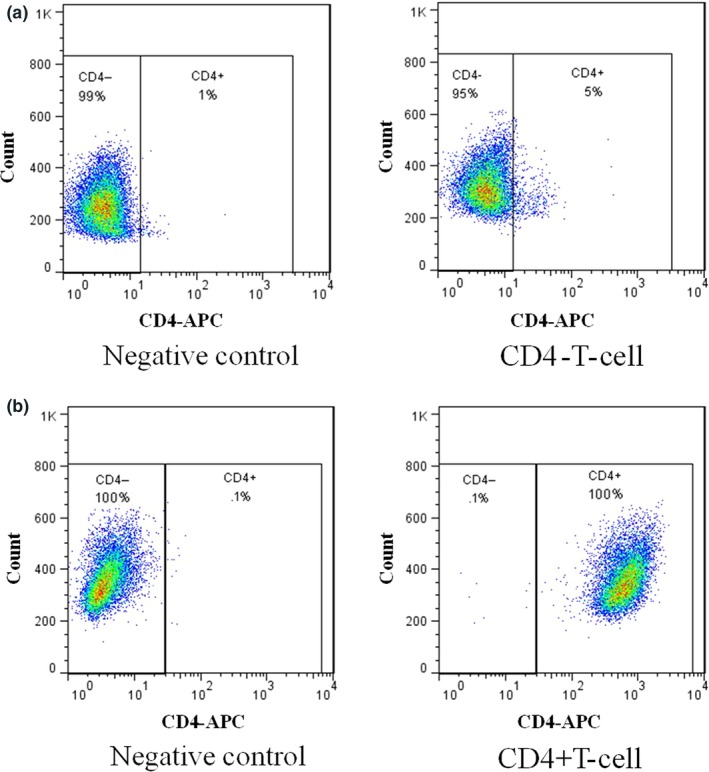
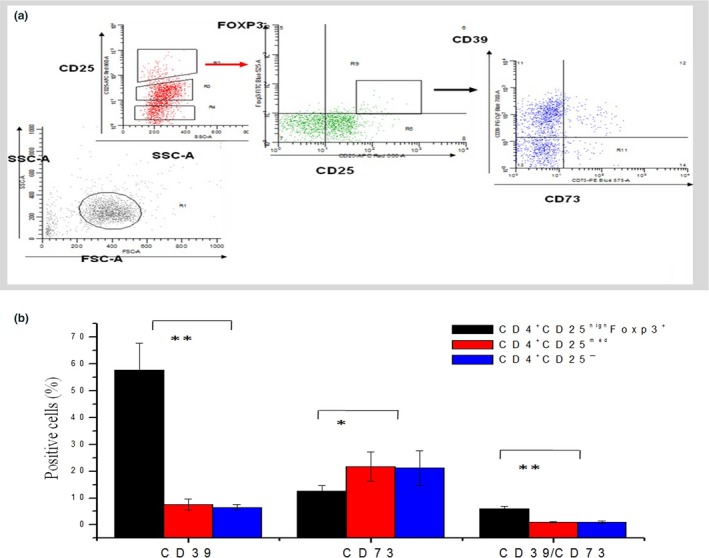
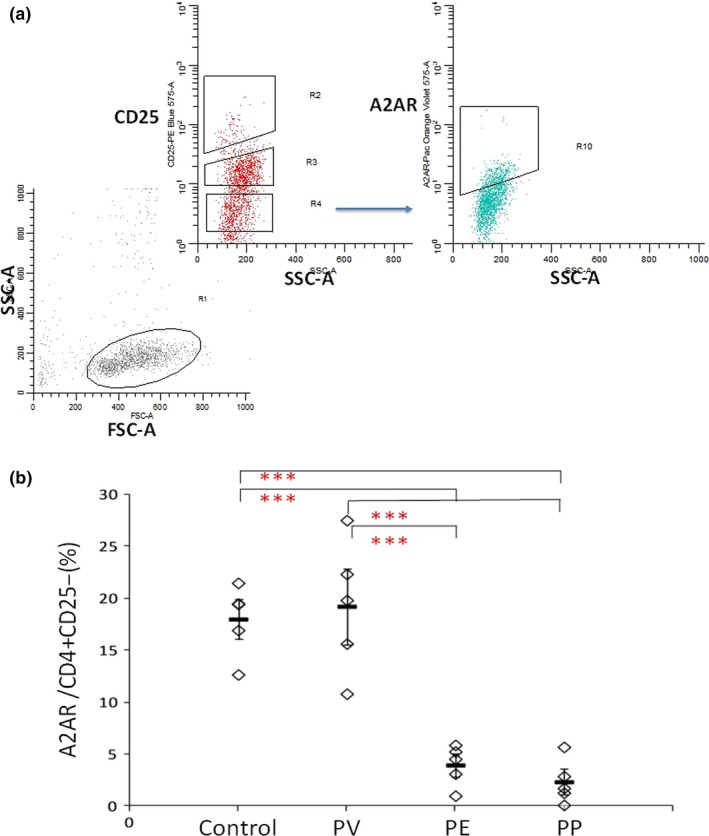
Methods: Peripheral blood mononuclear cells (PMBC) were prepared from patients with three different types of psoriasis (psoriasis vulgaris, pustular psoriasis and erythrodermic psoriasis). CD4+ cells were separated from PBMC by negative selection on midiMACS columns, and the frequencies and phenotypes of CD39 and CD73 expressing Tregs, and A2A R expressing Teff were all determined by flow cytometry analysis. Blood from healthy volunteers served as controls.
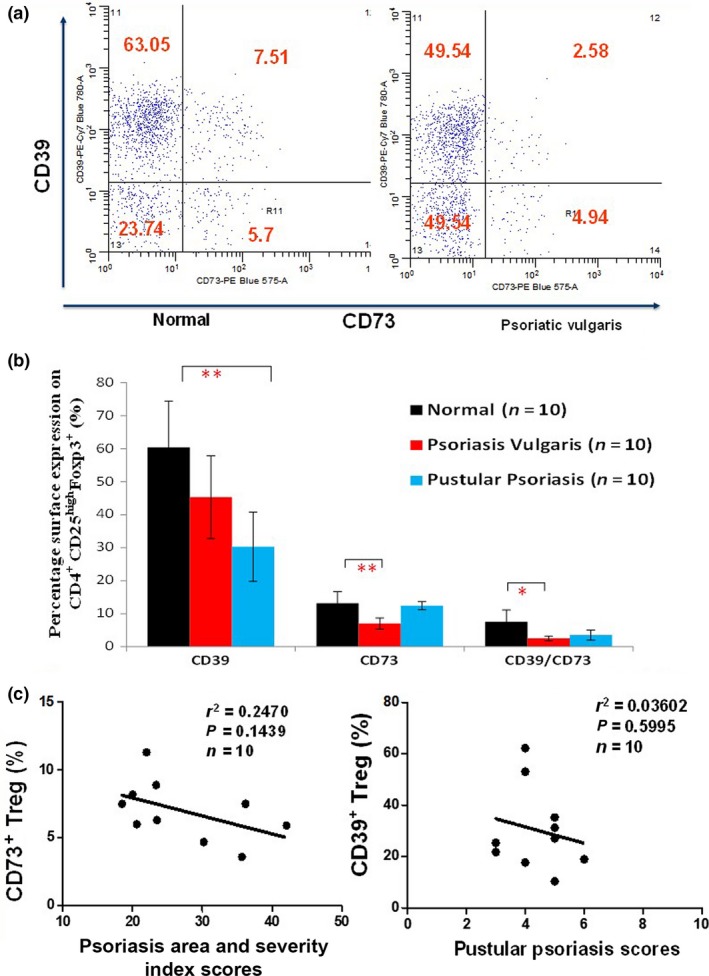
Results: The expression of single CD73+ Tregs was markedly reduced (approximately 50%) in psoriasis vulgaris, compared to normal controls. In pustular psoriasis, the mean numbers of CD39+ Tregs and A2A R+ Teff was significantly lower than in normal controls. Among three different types of psoriasis, CD39 expression was strikingly reduced in the blood Treg population of pustular psoriasis patients. Decreased CD73+ Tregs levels were observed in psoriasis vulgaris compared to pustular psoriasis and erythrodermic psoriasis.
Conclusions: The differences in the expression of CD39- and CD73- Tregs may be a factor in the pathogenesis of psoriasis.
Keywords: A2AR; CD39; CD73; Tregs; ectoenzymes; psoriasis.
© 2017 The Authors. Australasian Journal of Dermatology published by Wiley Publishing Asia Pty Ltd on behalf of The Australasian College of Dermatologists.
Figures
Similar articles
-
Target tissue ectoenzyme CD39/CD73-expressing Foxp3+ regulatory T cells in patients with psoriasis.Clin Exp Dermatol. 2015 Mar;40(2):182-91. doi: 10.1111/ced.12497. Epub 2014 Oct 4. Clin Exp Dermatol. 2015. PMID: 25284153
-
Foxp3+CD39+CD73+ regulatory T-cells are decreased in the peripheral blood of women with deep infiltrating endometriosis.Clinics (Sao Paulo). 2024 May 22;79:100390. doi: 10.1016/j.clinsp.2024.100390. eCollection 2024. Clinics (Sao Paulo). 2024. PMID: 38781760 Free PMC article.
-
Adenosine Generated by Regulatory T Cells Induces CD8+ T Cell Exhaustion in Gastric Cancer through A2aR Pathway.Biomed Res Int. 2019 Dec 14;2019:4093214. doi: 10.1155/2019/4093214. eCollection 2019. Biomed Res Int. 2019. PMID: 31930120 Free PMC article.
-
Systemic pharmacological treatments for chronic plaque psoriasis: a network meta-analysis.Cochrane Database Syst Rev. 2021 Apr 19;4(4):CD011535. doi: 10.1002/14651858.CD011535.pub4. Cochrane Database Syst Rev. 2021. Update in: Cochrane Database Syst Rev. 2022 May 23;5:CD011535. doi: 10.1002/14651858.CD011535.pub5. PMID: 33871055 Free PMC article. Updated.
-
Regulatory T-cells and preeclampsia: an overview of literature.Expert Rev Clin Immunol. 2016;12(2):209-27. doi: 10.1586/1744666X.2016.1105740. Epub 2015 Nov 18. Expert Rev Clin Immunol. 2016. PMID: 26580672
Cited by
-
Adenosine Signaling in Autoimmune Disorders.Pharmaceuticals (Basel). 2020 Sep 22;13(9):260. doi: 10.3390/ph13090260. Pharmaceuticals (Basel). 2020. PMID: 32971792 Free PMC article. Review.
-
CD4+FoxP3+CD73+ regulatory T cell promotes cardiac healing post-myocardial infarction.Theranostics. 2022 Mar 6;12(6):2707-2721. doi: 10.7150/thno.68437. eCollection 2022. Theranostics. 2022. PMID: 35401839 Free PMC article.
-
The role of platelets in immune-mediated inflammatory diseases.Nat Rev Immunol. 2023 Aug;23(8):495-510. doi: 10.1038/s41577-023-00834-4. Epub 2023 Jan 27. Nat Rev Immunol. 2023. PMID: 36707719 Free PMC article. Review.
-
Ectonucleotidase Modulation of Lymphocyte Function in Gut and Liver.Front Cell Dev Biol. 2021 Jan 21;8:621760. doi: 10.3389/fcell.2020.621760. eCollection 2020. Front Cell Dev Biol. 2021. PMID: 33553158 Free PMC article. Review.
-
ATP as a Pathophysiologic Mediator of Bacteria-Host Crosstalk in the Gastrointestinal Tract.Int J Mol Sci. 2018 Aug 12;19(8):2371. doi: 10.3390/ijms19082371. Int J Mol Sci. 2018. PMID: 30103545 Free PMC article. Review.
References
-
- Sakaguchi S, Sakaguchi N, Asano M et al Immunologic self‐tolerance maintained by activated T cells expressing IL‐2 receptor alpha‐chains (CD25): breakdown of a single mechanism of self‐tolerance causes various autoimmune diseases. J. Immunol. 1995; 155: 1151–64. - PubMed
-
- Bach J‐F. Regulatory T cells under scrutiny. Nat. Rev. Immunol. 2003; 3: 189–98. - PubMed
-
- Sakaguchi S. Naturally arising Foxp3‐expressing CD25+CD4+ regulatory T cells in immunological tolerance to self and non‐self. Nat. Immunol. 2005; 6: 345–52. - PubMed
-
- Su H, Longhi MS, Wang P et al Human CD4+CD25 (high) CD127 (low/neg) regulatory T cells. Methods Mol. Biol. 2012; 806: 287–99. - PubMed
MeSH terms
Substances
Grants and funding
LinkOut - more resources
Full Text Sources
Other Literature Sources
Medical
Research Materials
Miscellaneous
