

Optimal reconstruction and quantitative image features for computer-aided diagnosis tools for breast CT
- PMID: 28295405
- PMCID: PMC5467730
- DOI: 10.1002/mp.12214
Optimal reconstruction and quantitative image features for computer-aided diagnosis tools for breast CT
Abstract
Purpose: The purpose of this study is to determine the optimal representative reconstruction and quantitative image feature set for a computer-aided diagnosis (CADx) scheme for dedicated breast computer tomography (bCT).
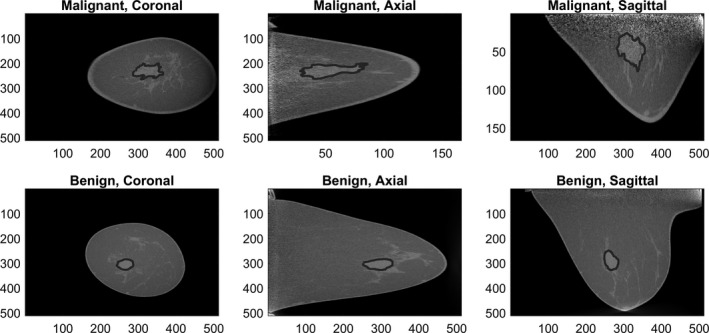
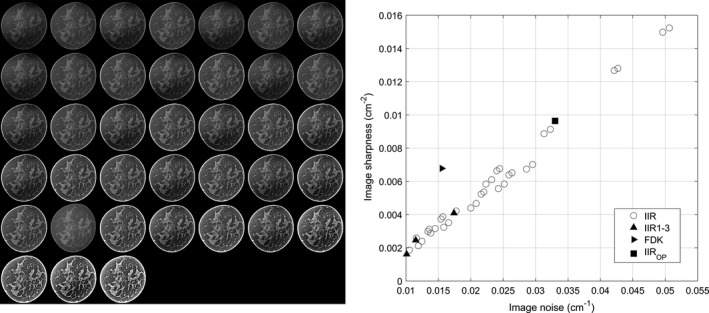
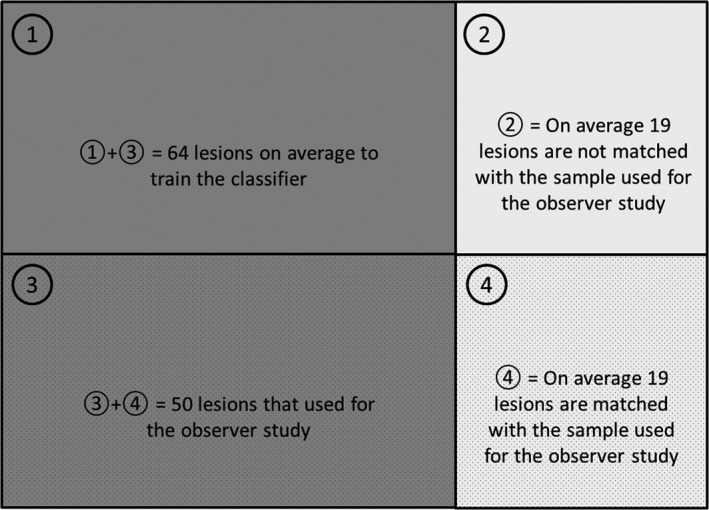
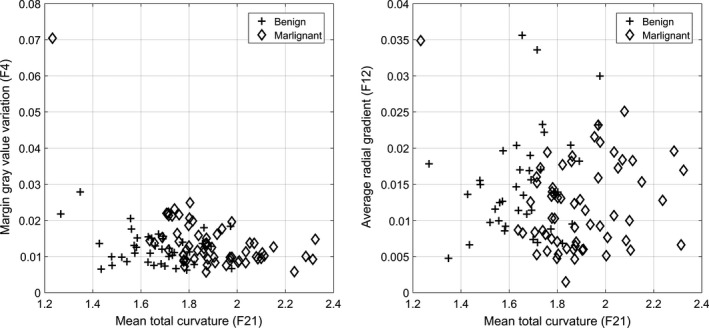
Method: We used 93 bCT scans that contain 102 breast lesions (62 malignant, 40 benign). Using an iterative image reconstruction (IIR) algorithm, we created 37 reconstructions with different image appearances for each case. In addition, we added a clinical reconstruction for comparison purposes. We used image sharpness, determined by the gradient of gray value in a parenchymal portion of the reconstructed breast, as a surrogate measure of the image qualities/appearances for the 38 reconstructions. After segmentation of the breast lesion, we extracted 23 quantitative image features. Using leave-one-out-cross-validation (LOOCV), we conducted the feature selection, classifier training, and testing. For this study, we used the linear discriminant analysis classifier. Then, we selected the representative reconstruction and feature set for the classifier with the best diagnostic performance among all reconstructions and feature sets. Then, we conducted an observer study with six radiologists using a subset of breast lesions (N = 50). Using 1000 bootstrap samples, we compared the diagnostic performance of the trained classifier to those of the radiologists.
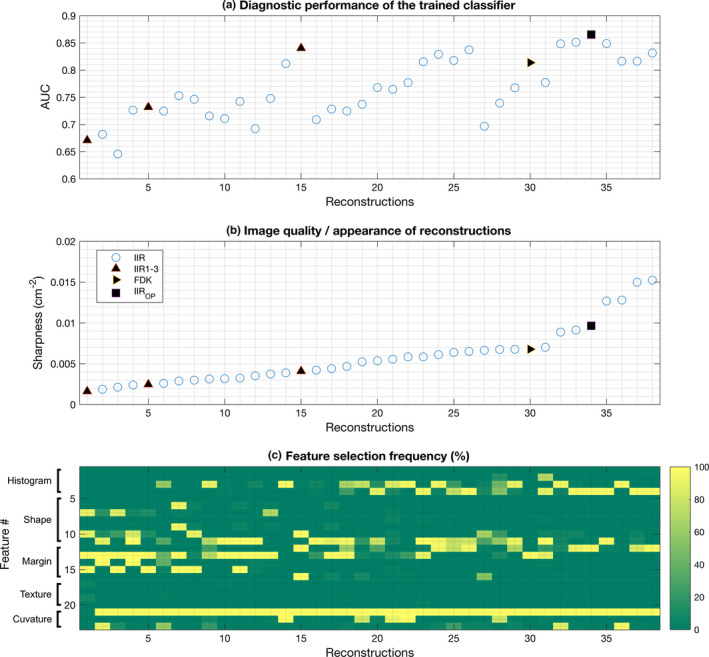
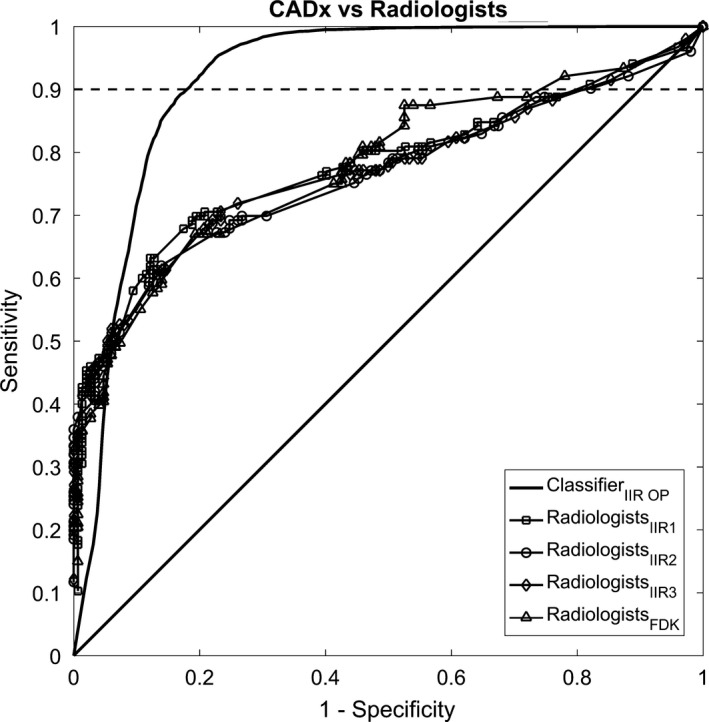
Result: The diagnostic performance of the trained classifier increased as the image sharpness of a given reconstruction increased. Among combinations of reconstructions and quantitative image feature sets, we selected one of the sharp reconstructions and three quantitative image feature sets with the first three highest diagnostic performances under LOOCV as the representative reconstruction and feature set for the classifier. The classifier on the representative reconstruction and feature set achieved better diagnostic performance with an area under the ROC curve (AUC) of 0.94 (95% CI = [0.81, 0.98]) than those of the radiologists, where their maximum AUC was 0.78 (95% CI = [0.63, 0.90]). Moreover, the partial AUC, at 90% sensitivity or higher, of the classifier (pAUC = 0.085 with 95% CI = [0.063, 0.094]) was statistically better (P-value < 0.0001) than those of the radiologists (maximum pAUC = 0.009 with 95% CI = [0.003, 0.024]).
Conclusion: We found that image sharpness measure can be a good candidate to estimate the diagnostic performance of a given CADx algorithm. In addition, we found that there exists a reconstruction (i.e., sharp reconstruction) and a feature set that maximizes the diagnostic performance of a CADx algorithm. On this optimal representative reconstruction and feature set, the CADx algorithm outperformed radiologists.
Keywords: CADx; breast CT; classification; curvature; image feature analysis.
© 2017 American Association of Physicists in Medicine.
Figures
Similar articles
-
Relationship between computer segmentation performance and computer classification performance in breast CT: A simulation study using RGI segmentation and LDA classification.Med Phys. 2018 Jun 19:10.1002/mp.13054. doi: 10.1002/mp.13054. Online ahead of print. Med Phys. 2018. PMID: 29920684 Free PMC article.
-
Local curvature analysis for classifying breast tumors: Preliminary analysis in dedicated breast CT.Med Phys. 2015 Sep;42(9):5479-89. doi: 10.1118/1.4928479. Med Phys. 2015. PMID: 26328996 Free PMC article.
-
Computer-aided diagnosis of lung cancer: the effect of training data sets on classification accuracy of lung nodules.Phys Med Biol. 2018 Feb 5;63(3):035036. doi: 10.1088/1361-6560/aaa610. Phys Med Biol. 2018. PMID: 29311420
-
Computer-aided diagnosis of ground-glass opacity pulmonary nodules using radiomic features analysis.Phys Med Biol. 2019 Jul 5;64(13):135015. doi: 10.1088/1361-6560/ab2757. Phys Med Biol. 2019. PMID: 31167172
-
Statistical nuclear texture analysis in cancer research: a review of methods and applications.Crit Rev Oncog. 2008;14(2-3):89-164. doi: 10.1615/critrevoncog.v14.i2-3.10. Crit Rev Oncog. 2008. PMID: 19409060 Review.
Cited by
-
Deep learning-based segmentation of breast masses in dedicated breast CT imaging: Radiomic feature stability between radiologists and artificial intelligence.Comput Biol Med. 2020 Mar;118:103629. doi: 10.1016/j.compbiomed.2020.103629. Epub 2020 Jan 27. Comput Biol Med. 2020. PMID: 32174316 Free PMC article.
-
Relationship between computer segmentation performance and computer classification performance in breast CT: A simulation study using RGI segmentation and LDA classification.Med Phys. 2018 Jun 19:10.1002/mp.13054. doi: 10.1002/mp.13054. Online ahead of print. Med Phys. 2018. PMID: 29920684 Free PMC article.
-
Neutrosophic segmentation of breast lesions for dedicated breast computed tomography.J Med Imaging (Bellingham). 2018 Jan;5(1):014505. doi: 10.1117/1.JMI.5.1.014505. Epub 2018 Mar 6. J Med Imaging (Bellingham). 2018. PMID: 29541650 Free PMC article.
References
-
- Elter M, Horsch A. CADx of mammographic masses and clustered microcalcifications: A review. Med Phys. 2009;36:2052–2068. - PubMed
-
- Rangayyan RM, Ayres FJ, Leo Desautels JE. A review of computer‐aided diagnosis of breast cancer: Toward the detection of subtle signs. J Franklin Inst. 2007;344:312–348.
-
- Eadie LH, Taylor P, Gibson AP. A systematic review of computer‐assisted diagnosis in diagnostic cancer imaging. Eur J Radiol. 2012;81:e70–e76. - PubMed
MeSH terms
Grants and funding
LinkOut - more resources
Full Text Sources
Other Literature Sources
Medical
