Clinical Trial
. 2017 Jul;66(1):57-68.
doi: 10.1002/hep.29148. Epub 2017 Jun 7.

Immune phenotype and function of natural killer and T cells in chronic hepatitis C patients who received a single dose of anti-MicroRNA-122, RG-101

Affiliations
Clinical Trial

Immune phenotype and function of natural killer and T cells in chronic hepatitis C patients who received a single dose of anti-MicroRNA-122, RG-101

Femke Stelma et al. Hepatology. 2017 Jul.

Abstract

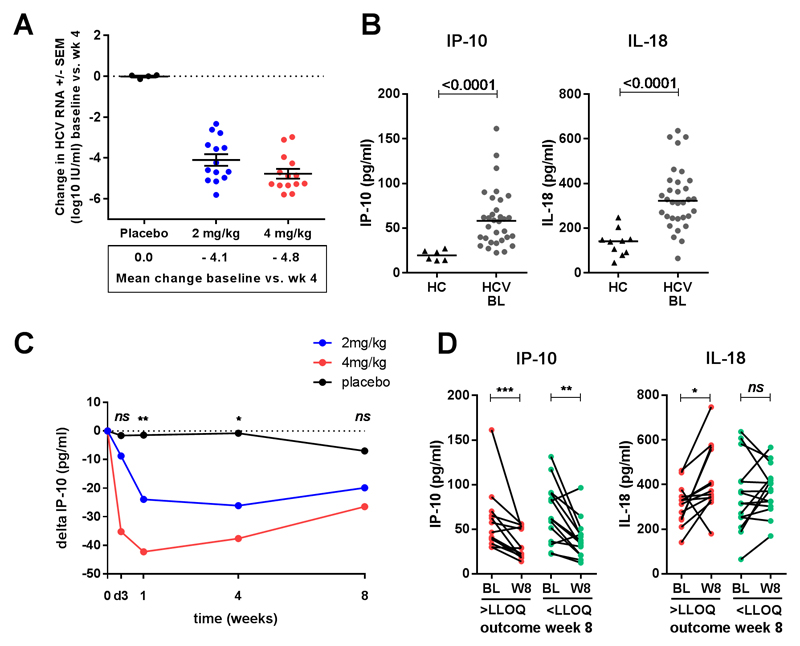
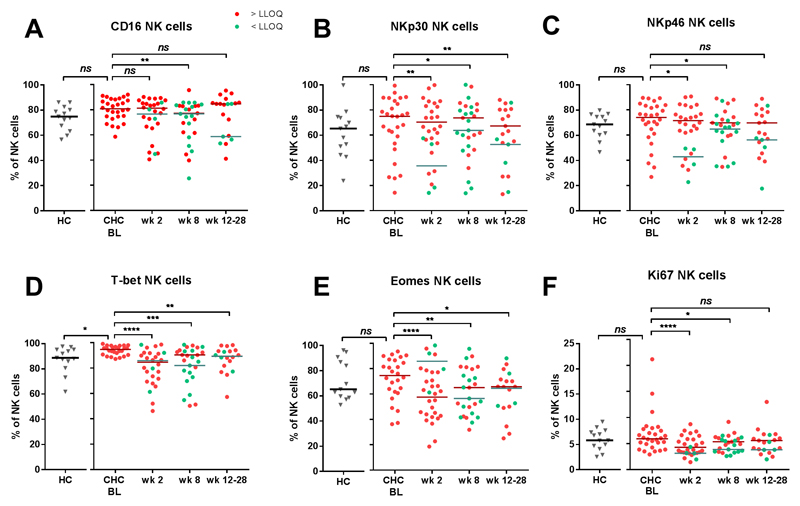
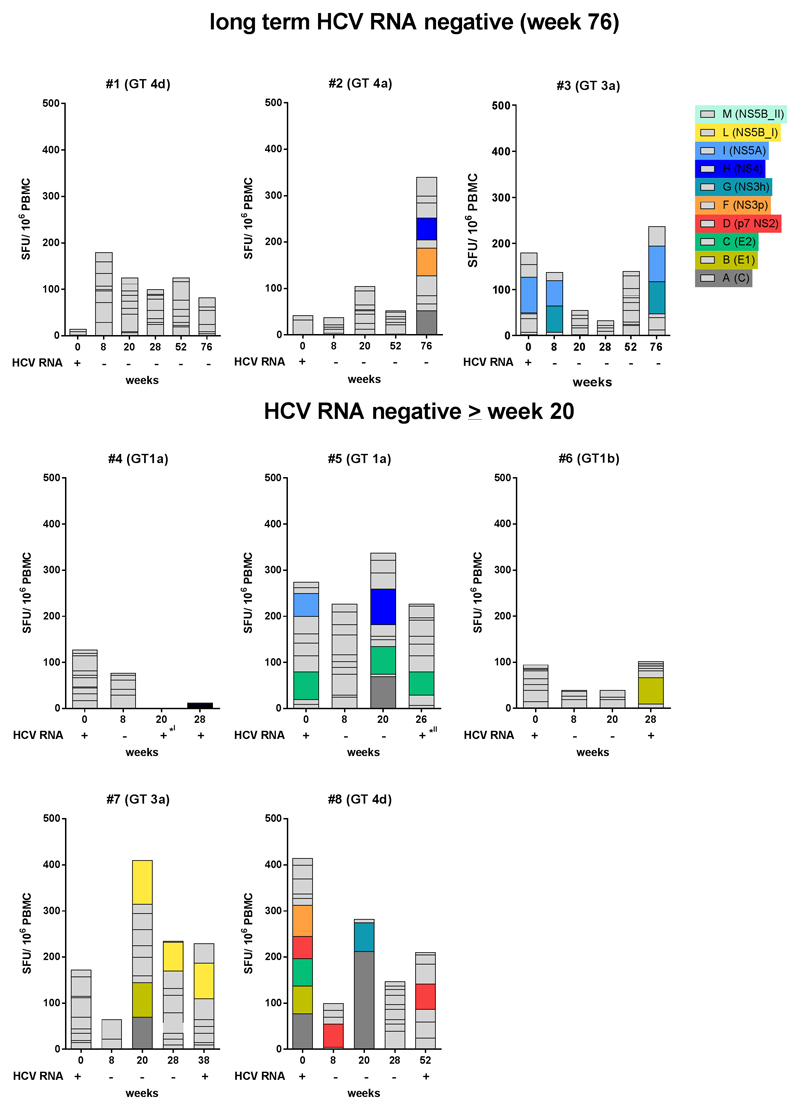
MicroRNA-122 is an important host factor for the hepatitis C virus (HCV). Treatment with RG-101, an N-acetylgalactosamine-conjugated anti-microRNA-122 oligonucleotide, resulted in a significant viral load reduction in patients with chronic HCV infection. Here, we analyzed the effects of RG-101 therapy on antiviral immunity. Thirty-two chronic HCV patients infected with HCV genotypes 1, 3, and 4 received a single subcutaneous administration of RG-101 at 2 mg/kg (n = 14) or 4 mg/kg (n = 14) or received a placebo (n = 2/dosing group). Plasma and peripheral blood mononuclear cells were collected at multiple time points, and comprehensive immunological analyses were performed. Following RG-101 administration, HCV RNA declined in all patients (mean decline at week 2, 3.27 log10 IU/mL). At week 8 HCV RNA was undetectable in 15/28 patients. Plasma interferon-γ-induced protein 10 (IP-10) levels declined significantly upon dosing with RG-101. Furthermore, the frequency of natural killer (NK) cells increased, the proportion of NK cells expressing activating receptors normalized, and NK cell interferon-γ production decreased after RG-101 dosing. Functional HCV-specific interferon-γ T-cell responses did not significantly change in patients who had undetectable HCV RNA levels by week 8 post-RG-101 injection. No increase in the magnitude of HCV-specific T-cell responses was observed at later time points, including 3 patients who were HCV RNA-negative 76 weeks postdosing.

Conclusion: Dosing with RG-101 is associated with a restoration of NK-cell proportions and a decrease of NK cells expressing activation receptors; however, the magnitude and functionality of ex vivo HCV-specific T-cell responses did not increase following RG-101 injection, suggesting that NK cells, but not HCV adaptive immunity, may contribute to HCV viral control following RG-101 therapy. (Hepatology 2017;66:57-68).


Conflict of interest statement

conflict of interest: Sophie Willemse: served as a speaker, a consultant and an advisory board member for AbbVie, Bristol-Myers-Squibb, Gilead Sciences, Janssen Therapeutics and Roche. Marc van der Valk: served on a scientific advisory board for AbbVie, Bristol-Myers Squibb, Gilead Sciences, Johnson and Johnson, MSD and a data safety monitoring board for ViiV healthcare; Through his institution he received non-financial support by MSD. Paul Grint and Steven Neben are employees at Regulus Therapeutics. Henk Reesink received grants and personal fees from Roche, Bristor Myers Squibb, Gilead Sciences, Abbvie, Janssen-Cilag, MSD, PRA-international, Regulus Therapeutics and Replicor, received personal fees from Alnylam, and received a grant from Boehringer Ingelheim. All other authors: none declared.

Figures

Figure 1
Figure 1
(A) Mean change in HCV RNA levels between baseline and week 4 in patients dosed with placebo (black dots), 2 mg/kg (red dots) and 4 mg/kg (blue dots) RG-101. (B) Plasma IP-10 levels in healthy controls (HC) and CHC patients (HCV) at baseline, bars indicate median. (C) Change in plasma IP-10 levels (median) in patients dosed with placebo (black dots), 2 mg/kg (red dots) and 4 mg/kg (blue dots) RG-101, level of significant difference indicated between RG-101 dosed (2 mg/kg and 4 mg/kg) and placebo dosed patients. (D) Change in plasma IP-10 levels between baseline and week 1 in patients with HCV RNA levels < LLOQ and > LLOQ at week 8, bars indicate median. Statistical testing; T-test (A) and Mann–Whitney test (B-D).
Figure 2
Figure 2
(A) Proportion of NK cells as a percentage of total lymphocytes in healthy controls (HC) and CHC patients dosed with RG-101 at baseline (bl), week (wk) 2, 8 and 12-28 (including patients with viral rebound between week 12 and 28 and patients with HCV RNA < LLOQ at week 28). Data is shown grouped in patients who are HCV RNA positive or have HCV RNA levels < LLOQ, as well as in placebo dosed patients, bars indicate median. (B) Proportion of CD56bright and CD56dim cells as a percentage of total NK cells in RG-101 dosed patients at baseline(bl), week (wk) 2, 8, and 12-28, bars indicate median. Representative dot plot showing NK cell gating in total lymphocyte population. CD56bright and CD56dim NK cell gates are shown (C) Percentage of TRAIL+ cells within CD56bright NK cells in healthy controls and patients dosed with RG-101, bars indicate median. Patients who had HCV RNA levels < LLOQ are depicted in green dots, patients who had HCV RNA levels > LLOQ in red. (D) Representative dot plot showing TRAIL gating, percentages of TRAIL positive cells within the CD56bright NK cell population (black) are shown. CD56dim NK cells are shown in grey for comparison. Statistical testing; Mann–Whitney test (A,C) and Wilcoxon matched pairs test (B,C).
Figure 3
Figure 3
Proportion of (A) CD16, (B) NKp30, (C) NKp46, (D) T-bet, (E) Eomes and (F) Ki67 in healthy controls (HC) as well as in CHC patients dosed with RG-101 (n=28) at baseline (bl), week (wk) 2 and 8, bars indicate median. Statistical testing; Mann–Whitney test and Wilcoxon matched pairs test (A-F). Patients who have HCV RNA levels < LLOQ are shown in green dots, patients with HCV RNA levels > LLOQ are in red dots.
Figure 4
Figure 4
(A) Ex vivo multimer positive cells as a proportion of total CD8+ T cells in RG-101 dosed patients at baseline (bl), week (wk) 2, wk 8 (including n=2 HCV RNA <LLOQ, excluding n=2 due to missed visit). Each dot represents one epitope, a positive response was defined as > 5 events with a lower threshold of 10,000 measured CD8+ T cells, bars indicate median. (B) ELISpot responses at baseline and week 8 in patients dosed with RG-101 (left) and placebo (right). Patients’ PBMCs were stimulated ex vivo with genotype specific HCV-peptide pools. (C) ELISpot responses at baseline and week 8 (and week 76) in patients dosed with RG-101 with HCV RNA levels > LLOQ (left) and < LLOQ (right) at week 8. (D) Change between baseline and week 8 ELISpot responses in patients dosed with RG-101 with HCV RNA levels > LLOQ (green dots) and < LLOQ (blue dots) at week 8 as well as placebo dosed patients, bars indicate median. Statistical testing; Mann–Whitney test (D) and Wilcoxon matched pairs test (A-C).
Figure 5
Figure 5
ELISpot responses (left y-axis) and viral load (right y-axis) in patients who were HCV RNA negative for 76 weeks (upper graphs, patients #1-3) as well as in patients who had HVC RNA levels < LLOQ for 20 or more weeks (lower graphs, patients #4-8). (I): patient #4 had < 1 log10 increase in HCV RNA at week 20 (PBMC missing), and was negative again at week 24. Rebound was at week 28. (II): patient #5 had > 1 log10 increase in HCV RNA at week 24 and < 1 log10 increase in HCV RNA at retest (week 26, last available PBMCs), rebound was at week 36.

References

    1. Westbrook RH, Dusheiko G. Natural history of hepatitis C. J Hepatol. 2014;61:S58–S68. - PubMed
    1. van der Meer AJ, Veldt BJ, Feld JJ, Wedemeyer H, Dufour JF, Lammert F, et al. Association Between Sustained Virological and Advanced Hepatic Fibrosis. J Am Med Assoc. 2012;308:2584–2593. - PubMed
    1. Morgan RL, Baack B, Smith BD, Yartel A, Pitasi M, Falck-ytter Y, et al. Eradication of Hepatitis C Virus Infection and the Development of Hepatocellular Carcinoma. Ann Intern Med. 2013;158:329–337. - PubMed
    1. Pawlotsky JM. New hepatitis C therapies: The toolbox, strategies, and challenges. Gastroenterology. 2014;146:1176–1192. - PubMed
    1. Lindenbach BD. What’s next for hepatitis C virus research? Hepatology. 2016;63:1408–1410. - PubMed

Publication types

MeSH terms