. 2017 Jun;246(6):451-465.
doi: 10.1002/dvdy.24498. Epub 2017 Apr 3.

Recovery of shape and size in a developing organ pair

Affiliations

Recovery of shape and size in a developing organ pair

Amelia A Green et al. Dev Dyn. 2017 Jun.

Abstract

Background: Paired organs in animals are largely bilaterally symmetric despite inherent noise in most biological processes. How is precise organ shape and size achieved during development despite this noise? Examining paired organ development is a challenge because it requires repeated quantification of two structures in parallel within living embryos. Here we combine bilateral quantification of morphology through time with asymmetric perturbations to study regulation of organ shape, size, and symmetry in developing organ pairs.

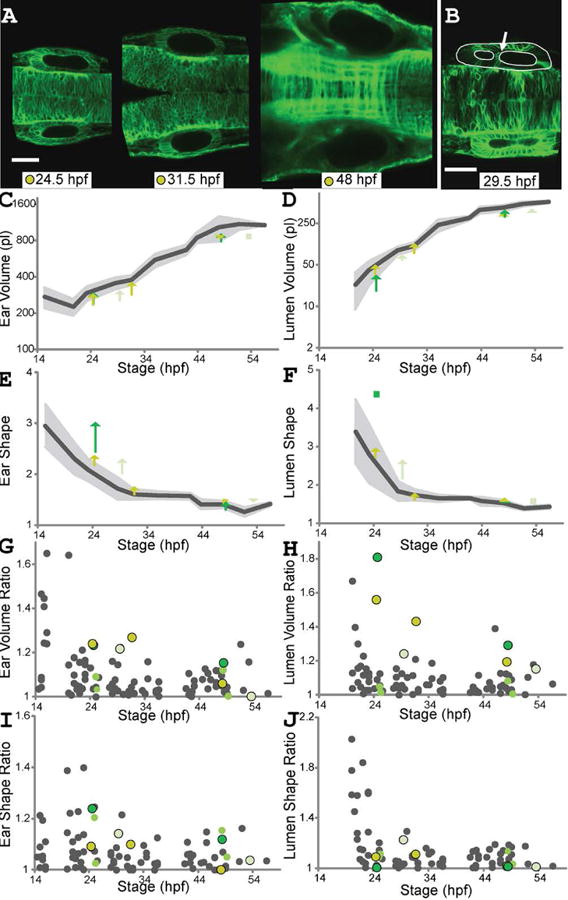
Results: We present quantitative live imaging tools to measure the shape and size of the developing inner ears on both the left and right side simultaneously over time. By quantifying variation between the left and right inner ear (intrinsic noise) and between different individuals (extrinsic noise), we find that initial variability decreases over time in normal development to achieve symmetry. Early asymmetry is increased by environmental stress, but symmetry is still recovered over subsequent developmental time. Using multiple unilateral perturbations including Fgf signaling and ultraviolet light, we find that growth can be adjusted to compensate for a range of initial size and shape differences.

Conclusions: We propose that symmetry in developmental systems does not emerge through precise deterministic bilateral development, but rather through feedback mechanisms that adjust morphogenesis rates to account for variation. Developmental Dynamics 246:451-465, 2016. © 2017 Wiley Periodicals, Inc.

Keywords: inner ear; otic vesicle; regeneration; regulation; size control; symmetry.


Figures

Figure 1
Figure 1. Tracking development of wild-type zebrafish ear pairs
(A) Time series of zebrafish (actb2:membrane-citrine) ear pairs: single confocal planes at 14, 24, 34, 44 hpf. Dorsal view. Scale bar = 50 μm. See Movie 1 for 3D visualizations of ear shapes and volumes. (B) 3D representation of an ear pair. White arrows indicate axes: AP (Anterior-Posterior), ML (Medial-Lateral), DV (Dorsal-Ventral). Contours outline left ear (yellow) and lumen (off-white); right ear (red) and lumen (blue).
Figure 2
Figure 2. Comparison of ear development under different imaging treatments
A-C: Ear (A), lumen (B) and tissue (= ear-lumen) (C) volumes over time. Standard wild-type dataset (Mosaliganti et al., under review): means (black line and diamonds) and standard deviations (s.d.) (light grey shading). Wild-type dataset from this paper: means (white diamonds and grey line); s.d. not shown. The null hypothesis that the difference between ear volumes of the standard dataset and from the dataset in this paper is zero cannot be rejected (two-sample t-test with hypothesized difference = 0: p value > 0.13 for all comparable stages: 20, 22, 23, 28, 36 and 42 hpf).
Figure 3
Figure 3. Quantification of zebrafish ear pair development by tracking volume and shape
A-D: Ear (A) and lumen (B) volumes; ear (C) and lumen (D) shape ratios (AP length / MLDV diameter). Mean values as dark-grey lines; s.d. as light-grey shading. Each arrow connects left and right ear values for one fish at one timepoint; one color per individual (38 individuals, 1-5 timepoints each). Squares replace arrows shorter than an arrowhead. E-H: B/S ratios for ear (E) and lumen (F) volumes; ear (G) and lumen (H) shapes (grey dots). Two individuals are highlighted (black and white dots respectively). Additional measurements in Table S1.
Figure 4
Figure 4. Environmental stress causes asymmetries in developing ear pairs that are later corrected
(A) Temperature fluctuation protocol: temperature changes from 23-33°C (or vice versa) every hour from 4-20 hpf. (B) Single confocal planes (actb2:membrane-citrine) for an individual (corresponding to cyan arrows and dots in C-J) following temperature fluctuation treatment. Scale bar = 50 μm. See Movie 2 for 3D visualizations of ear and lumen shapes and volumes. C-F: Ear (C) and lumen (D) volumes; ear (E) and lumen (F) shape ratios. Untreated wild-type mean values (dark-grey) and s.d. (light-grey) as in Fig. 3. Each arrow connects left and right ear values for one fish at one timepoint (2-4 timepoints for three individuals, one color per individual). Squares replace arrows shorter than an arrowhead. G-J: B/S ratios for ear (G) and lumen (H) volumes; ear (I) and lumen (J) shape ratios (untreated wild type as Fig. 3: grey dots). Colors match individuals in B-F. See also Table S2.
Figure 5
Figure 5. Localized UV treatment creates temporary asymmetry in ear and lumen size and shape
(A) Oriented UV (302 nm) treatments. 6 hpf: yellow circles represent eggs (yolk deep-yellow, embryo light-yellow); UV orientation from Anterior, Posterior, Left or Right; purple crescents represent expected UV penetration. 24 hpf: embryos (oriented as 6 hpf; ears outlined white, lumens black) show damage near UV source (purple circles; note anterior UV often causes additional defects and early death). (B) Early (26 hpf) and late (55.5 hpf) ear pairs for an individual (actb2:membrane-citrine) UV-treated on its left (same color used for same individual, C-J). Scale bar = 50 μm. Movie 3 shows 3D visualizations of ear and lumen shapes and volumes. C-F: Ear (C) and lumen (D) volumes; ear (E) and lumen (F) shape ratios. Untreated wild-type mean values (dark-grey) and s.d. (light-grey) as Fig. 3. Each arrow connects left (treated) and right ear values for one fish at one timepoint (3-4 timepoints for three individuals, one color per individual). Squares replace arrows shorter than an arrowhead. G-J: B/S ratios for ear (G) and lumen (H) volumes; ear (I) and lumen (J) shape ratios (untreated wild type as Fig. 3: grey dots). Black-outlined colored dots match individuals in B-F. See Table S2.
Figure 6
Figure 6. Transient local reduction of Fgf signaling affects size and symmetry of developing ears
(A) Localized heatshock methods. Yellow circles eggs, anterior oriented left. Untreated: wild-type development 6-24 hpf (embryo light-yellow, ears black-outlined ellipses). Method 1 (transplant+heatshock): 6 hpf transplant donor hsp70:dnfgfr1a-EGFP cells (green) to actb2:membrane-mCherry2 host embryo; 10 hpf heatshock activates hsp70:dnfgfr1a-EGFP (red). Method 2 (local heatshock): hsp70:dnfgfr1a-EGFP;actb2:membrane-mCherry2 embryo (green). 10 hpf localized heatshock activates hsp70:dnfgfr1a-EGFP (red). 24 hpf treated ears smaller than untreated. B-C: Ear pairs ∼24 hpf; >43 hpf (confocal planes), Methods 1 (B), 2 (C). Scale bar = 50 μm. Inserts: magnifications of treated ears, GFP-expressing cells false-colored red. D-O: LR differences and B/S ratios. Untreated wild-type means (dark-grey) and s.d. (light-grey) as Fig. 3. Ear volumes: Methods 1 (D), 2 (E). Each arrow connects left (treated) and right ear values for one fish at one timepoint (4-6 timepoints for 3 individuals per treatment; one color per individual). Squares replace arrows shorter than an arrowhead. B/S ratios for ear volumes (F). Untreated wild type grey dots as Fig. 3, treated individuals red (Method 1) and orange (Method 2) dots, individuals from B-E black-outlined dots. Lumen volume (G-I), ear shape ratio (J-L) and lumen shape ratio (M-O), for individuals in D-F. See Movies 4+5, Table S2.
Figure 7
Figure 7. Recovery of ear shape and size asymmetry after modulation of Fgf8a
(A-B) Single confocal planes for hsp70:fgf8a;actb2:membrane-citrine individuals heatshocked at 12 hpf. Scale bar = 50 μm. Movie 6 shows 3D visualizations of ear and lumen shapes and volumes. Dot/arrow colors mark the same individuals in (C-J). White arrow (B) points to epithelial tissue bisecting an elongated lumen. C-F: Ear (C) and lumen (D) volumes; ear (E) and lumen (F) shape ratios. Untreated wild-type mean values (dark-grey) and s.d. (light-grey) as in Fig. 3. Each arrow connects left (treated) and right ear values for one fish at one timepoint (3-4 timepoints for three individuals, one color per individual). Squares replace arrows shorter than an arrowhead. G-J: B/S ratios for ear (G) and lumen (H) volumes; ear (I) and lumen (J) shape ratios (untreated wild type as Fig. 3: grey dots). Black-outlined colored dots match individuals in A-F. See Table S2.
Figure 8
Figure 8. Comparison of tissue and lumen recoveries across perturbation types
A-C: Mean B/S ratios at 20-28 and 44-52 hpf: ear (A), lumen (B), tissue (C) volume. For A-H, grey marks wild type (see Fig. 3), cyan temperature stress (Fig. 4), purple UV (Fig. 5), red local hsp70:dnfgfr1a-EGFP, Method 1 (Fig. 6), orange local hsp70:dnfgfr1a-EGFP, Method 2 (Fig. 6), green hsp70:fgf8a (Fig. 7). Difference between B/S ratios at 20-28 and 44-52 hpf for each treatment tested by two-sample t-test with hypothesized difference = 0: * = p value < 0.1, ** = p value < 0.05. D-E: Cell volume (D), cell number (E) – standard wild-type mean (dark-grey) and s.d. (light-grey) calculated by (Method A, Table 1); LR difference arrows for a subset of individuals from Figs 4-7, calculated by (Method C, Table 1), colored as before. F: B/S ratio, mean cell number (see E), colors as (A-C), note than wild-type value is approximately zero. G: Percentage mitotic cells (= mitotic cell number / total cell number). Wild-type mean, s.d. and LR difference arrows colored as (D-E). H: Mean expansion rates (pl/hour) for smaller (treated) ears, between 24-48 hpf, colors as (A-C) - tissue dark, lumen light. See also Tables S3-S4.
Figure 9
Figure 9. Summary of shape and size recovery for developing ear pairs
A: Variability in developing ear pairs corrected early in wild-type development (grey). Global stress (blue) or local perturbation (pink) create later, larger asymmetries corrected by 45 hpf.

Similar articles

Cited by

References

    1. Abouchar L, Petkova MD, Steinhardt CR, Gregor T. Fly wing vein patterns have spatial reproducibility of a single cell. Journal of the Royal Society Interface. 2014;11:20140443. - PMC - PubMed
    1. Breuker CJ, Patterson JS, Klingenberg CP. A single basis for developmental buffering of Drosophila wing shape. PLoS ONE. 2006;1:e7. doi: 10.1371/journal.pone.0000007. - DOI - PMC - PubMed
    1. Bryant PJ, Simpson P. Intrinsic and extrinsic control of growth in developing organs. The Quarterly Review of Biology. 1984;59:387–415. - PubMed
    1. Freeman DC, Brown ML, Dobson M, Jordan Y, Kizy A, Micallef C, Hancock LC, Graham JH, Emlen JM. Developmental instability: measures of resistance and resilience using pumpkin (Cucurbita pepo L.) Biological Journal of the Linnean Society. 2003;78:27–41.
    1. Freeman DC, Brown ML, Duda JJ, Graham JH, Emlen JM, Krzysik AJ, Balbach H, Kovavic DA, Zak JC. Leaf fluctuating asymmetry, soil disturbance and plant stress: a multiple year comparison using two herbs, Ipomoea pandurata and Cnidoscolus stimulosus. Ecological Indicators. 2005;5:85–95.

LinkOut - more resources