Review
. 2017 Oct;46(4):951-971.
doi: 10.1002/jmri.25693. Epub 2017 Mar 10.

Clinical quantitative susceptibility mapping (QSM): Biometal imaging and its emerging roles in patient care

Affiliations
Review

Clinical quantitative susceptibility mapping (QSM): Biometal imaging and its emerging roles in patient care

Yi Wang et al. J Magn Reson Imaging. 2017 Oct.

Abstract

Quantitative susceptibility mapping (QSM) has enabled magnetic resonance imaging (MRI) of tissue magnetic susceptibility to advance from simple qualitative detection of hypointense blooming artifacts to precise quantitative measurement of spatial biodistributions. QSM technology may be regarded to be sufficiently developed and validated to warrant wide dissemination for clinical applications of imaging isotropic susceptibility, which is dominated by metals in tissue, including iron and calcium. These biometals are highly regulated as vital participants in normal cellular biochemistry, and their dysregulations are manifested in a variety of pathologic processes. Therefore, QSM can be used to assess important tissue functions and disease. To facilitate QSM clinical translation, this review aims to organize pertinent information for implementing a robust automated QSM technique in routine MRI practice and to summarize available knowledge on diseases for which QSM can be used to improve patient care. In brief, QSM can be generated with postprocessing whenever gradient echo MRI is performed. QSM can be useful for diseases that involve neurodegeneration, inflammation, hemorrhage, abnormal oxygen consumption, substantial alterations in highly paramagnetic cellular iron, bone mineralization, or pathologic calcification; and for all disorders in which MRI diagnosis or surveillance requires contrast agent injection. Clinicians may consider integrating QSM into their routine imaging practices by including gradient echo sequences in all relevant MRI protocols.

Level of evidence: 1 Technical Efficacy: Stage 5 J. Magn. Reson. Imaging 2017;46:951-971.

Keywords: biometals; quantitative susceptibility mapping.


Figures

Figure 1
Figure 1
GRE MRI of a healthy subject: a) magnitude image of T2* weighting (T2*w, TE=18msec), showing marginal tissue contrast in the basal ganglia gray matter, b) phase-derived field image after unwrapping and background field removal, showing substantial contrast within the basal ganglia, c) R2* and d) QSM, showing bright contrast for iron in the globus pallidus (horizontal arrows) and vein (vertical arrows). However, calcification in the ventricle (oblique arrows in c&d) is shown bright on R2* but dark (negative susceptibility) on QSM.
Figure 2
Figure 2
a) Systemic iron homeostasis. The liver regulates the level of plasma transferrin-bound iron by secreting hepcidin to control iron-recycling by macrophages in the liver and spleen, and to control iron-uptake from the diet by the duodenum. The concentration of blood plasma iron is in equilibrium with the concentrations of iron in all cells through circulation of the labile iron pool. Iron circulation in the body is indicated by blue arrows. Iron can only be absorbed into the body in the duodenum (red arrow), and the body does not have a mechanism to excrete iron except through cell loss. b) Brain iron homeostasis. The labile iron concentration is in equilibrium with the iron contents in all cells (neurons, microglia, oligodendrocytes, and astrocytes). Iron not participating in neurochemistry is stored in ferritin. Iron can be sequestered into the brain from the capillary blood, but there is no known mechanism for iron to be excreted from the brain.
Figure 2
Figure 2
a) Systemic iron homeostasis. The liver regulates the level of plasma transferrin-bound iron by secreting hepcidin to control iron-recycling by macrophages in the liver and spleen, and to control iron-uptake from the diet by the duodenum. The concentration of blood plasma iron is in equilibrium with the concentrations of iron in all cells through circulation of the labile iron pool. Iron circulation in the body is indicated by blue arrows. Iron can only be absorbed into the body in the duodenum (red arrow), and the body does not have a mechanism to excrete iron except through cell loss. b) Brain iron homeostasis. The labile iron concentration is in equilibrium with the iron contents in all cells (neurons, microglia, oligodendrocytes, and astrocytes). Iron not participating in neurochemistry is stored in ferritin. Iron can be sequestered into the brain from the capillary blood, but there is no known mechanism for iron to be excreted from the brain.
Figure 3
Figure 3
Iron overload in neurodegeneration. Iron can promote the formation of reactive oxygen species and associated oxidative stress. Consequent neurotoxicity includes protein misfolding and damage to mitochondria and other cellular components. When combining with α-synuclein, iron may accelerate its misfolding. Iron may also contribute to neurodegeneration by causing activation of pro-inflammatory microglia.
Figure 4
Figure 4
Iron in inflammation. The expression of ferritin and ferroportin in macrophages depend on macrophage activation. a) The classical pro-inflammatory activated (M1) macrophage has high ferritin and low ferroportin, as it tries to limit iron availability to suspected pathogens by sequestering iron from the microenvironment and storing iron. b) On the other extreme, the alternatively activated (M2) macrophage has low ferritin and high ferroportin, as it tries to recirculate iron to the microenvironment for tissue repair.
Figure 5
Figure 5
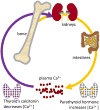
Calcium homeostasis. Bone is the main site of calcium storage. The concentration of blood plasma calcium is in equilibrium with calcium in all cells through the circulation of labile calcium; this balance is tightly regulated by the thyroid and parathyroid. When plasma calcium is high, the thyroid gland releases calcitonin to stimulate calcium deposition in bones and reduce calcium uptake in the kidneys. When plasma calcium is low, the parathyroid gland secretes parathyroid hormone to stimulate calcium release from bones and increase calcium uptake at the kidneys and intestines.
Figure 6
Figure 6
Pre-surgical mapping for deep brain stimulation (DBS). a) An electrode is inserted into the suthalamic nucleus (STN) during DBS. b) Deep gray nuclei are depicted on QSM, including the globus pallidus externa and interna (GPe, Gpi), substantial nigra (SN), and STN.
Figure 7
Figure 7
Iron chelation therapy for neurodegenerative diseases. The bidentate ligand deferiprone (DFP) can permeate through the blood brain barrier (BBB). DFP scavenges labile iron that is loosely bound to proteins, forming the 3:1 complex 3DFP+Fe. The complex carries zero charge and diffuses through the BBB, leading to excretion via urine.
Figure 8
Figure 8
Deep gray nuclei depictions on various MRI methods. a) T2 weighted image (T2w), b) T2* weighted image (T2*w, TE=18msec) or gradient echo magnitude image, c) R2* mapping, d) phase image with high pass filter, e) susceptibility weighted imaging (SWI), and f) QSM. The nuclei (STN, SN, and GP) are depicted with the best contrast-to-noise ratio on QSM (f). (From https://www.ncbi.nlm.nih.gov/pubmed/23674786)
Figure 9
Figure 9
Multiple sclerosis white matter lesion (WM) with a rim of iron and M1 microglia. a) T2 weighted image (T2w) and b) QSM of an MS brain block containing a WM lesion, and of the insert in b, corresponding c) laser ablation inductively coupled plasma mass spectroscopy (LA-ICP) and d) immunohistochemistry against CD68. Compared to T2w (a), QSM (b) showed a greater volume with a bright rim, which can be biophysically interpreted as containing iron. The rim iron was confirmed on LA-ICP (c) and corresponded to microglia activation (d). (From https://www.ncbi.nlm.nih.gov/pubmed/25137340)
Figure 10a
Figure 10a
Iron rim on in vivo QSM. a) T2 weighted image (T2w), b) QSM and c) T1 weighted image with gadolinium injection (T1w+Gd) of a relapse remitting MS patient. Hyperintense rim on QSM that can be biophysically interpreted as iron is seen on Gd non-enhancing lesions (arrows in a&b), indicating active chronic inflammation. A QSM isointense lesion is Gd enhancing (circles), suggesting the QSM value is anti-correlated to Gd enhancement.
Figure 10b
Figure 10b
QSM allows accurate assessment of MS lesion enhancement status without Gd injection. QSM isointense predicts Gd-enhancing and QSM hyperintense predicts Gd non-enhancing with an area under the receiver operating characteristic curve of 0.96. (From https://www.ncbi.nlm.nih.gov/pubmed/27365331)
Figure 10c
Figure 10c
QSM is ideal to depict the central veins in MS lesions (arrows), while T2w cannot depict the central veins, and T2*w cannot or only very poorly depict the lesions.
Figure 11
Figure 11
QSM liver iron content quantification. a) Water, b) fat, c) QSM and d) R2* of an axial section of the liver with suspected fibrosis in the medial anterior lobe. Fibrosis did not affect iron quantification by QSM (a) but did affect iron quantification by R2*. QSM overcomes R2* confounding factors, including fibrosis, fat, and edema.
Figure 12
Figure 12
Cerebral metabolic rate of oxygen consumption (CMRO2). a) QSM and b) cerebral blood flow (CBF) were acquired before caffeine challenge, c) QSM and d) CBF after, and e) corresponding CMRO2. QSM is depicted with a gray scale bar [-50,50]ppb, CBF with a color scale bar [0,150]ml/100g/min, and QSM with a color scale bar [0, 500] μmol/100g/min.
Figure 13
Figure 13
Bone QSM with negative susceptibility depicted as bright. The mineralization in the cortical bone of the femur (arrows) is well captured on QSM as depicted on a a) coronal section, b) sagittal section, and c) axial section.

Similar articles

Cited by

References

    1. de Rochefort L, Liu T, Kressler B, et al. Quantitative susceptibility map reconstruction from MR phase data using bayesian regularization: validation and application to brain imaging. Magn Reson Med. 2010;63(1):194–206. - PubMed
    1. Wang Y, Liu T. Quantitative susceptibility mapping (QSM): Decoding MRI data for a tissue magnetic biomarker. Magn Reson Med. 2015;73(1):82–101. - PMC - PubMed
    1. Reichenbach JR, Schweser F, Serres B, Deistung A. Quantitative Susceptibility Mapping: Concepts and Applications. Clin Neuroradiol. 2015;25(2):225–230. - PubMed
    1. Liu C, Li W, Tong KA, Yeom KW, Kuzminski S. Susceptibility-weighted imaging and quantitative susceptibility mapping in the brain. Journal of magnetic resonance imaging : JMRI. 2015;42(1):23–41. - PMC - PubMed
    1. Haacke EM, Liu S, Buch S, Zheng W, Wu D, Ye Y. Quantitative susceptibility mapping: current status and future directions. Magnetic resonance imaging. 2015;33(1):1–25. - PubMed

Publication types