

Health care provider communication training in rural Tanzania empowers HIV-infected patients on antiretroviral therapy to discuss adherence problems
- PMID: 28296019
- PMCID: PMC5599974
- DOI: 10.1111/hiv.12499
Health care provider communication training in rural Tanzania empowers HIV-infected patients on antiretroviral therapy to discuss adherence problems
Abstract
Objectives: Self-reported adherence assessment in HIV-infected patients on antiretroviral therapy (ART) is challenging and may overestimate adherence. The aim of this study was to improve the ability of health care providers to elicit patients' reports of nonadherence using a "patient-centred" approach in a rural sub-Saharan African setting.
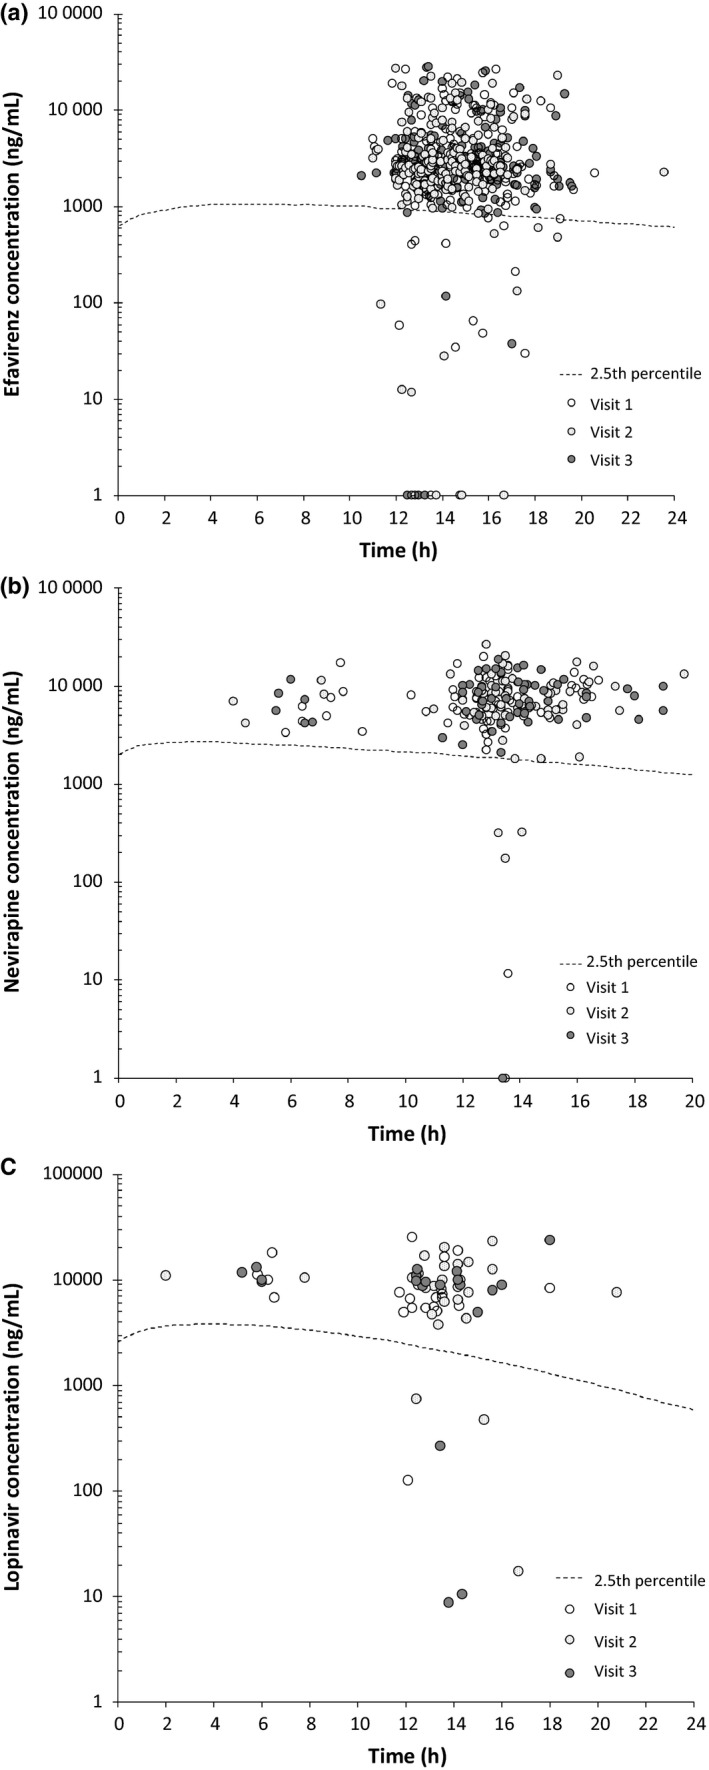
Methods: A prospective interventional cohort study of HIV-infected patients on ART for ≥ 6 months attending an HIV clinic in rural Tanzania was carried out. The intervention consisted of a 2-day workshop for health care providers on patient-centred communication and the provision of an adherence assessment checklist for use in the consultations. Patients' self-reports of nonadherence (≥ 1 missed ART dose/4 weeks), subtherapeutic plasma ART concentrations (< 2.5th percentile of published population-based pharmacokinetic models), and virological and immunological failure according to the World Health Organization definition were assessed before and after (1-3 and 6-9 months after) the intervention.
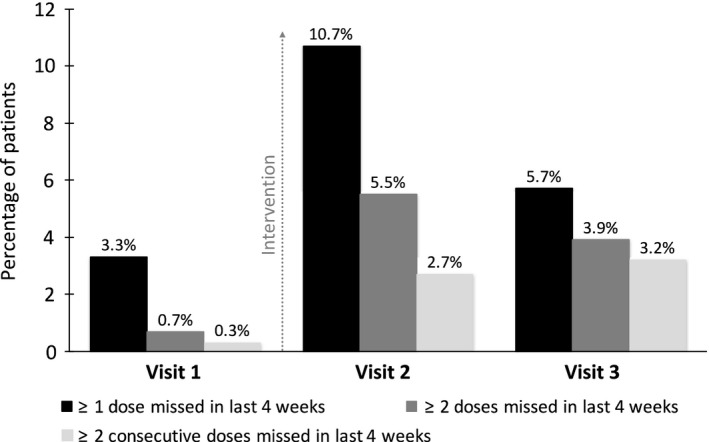
Results: Before the intervention, only 3.3% of 299 patients included in the study reported nonadherence. Subtherapeutic plasma ART drug concentrations and virological and immunological failure were recorded in 6.5%, 7.7% and 14.5% of the patients, respectively. Two months after the intervention, health care providers detected significantly more patients reporting nonadherence compared with baseline (10.7 vs. 3.3%, respectively; P < 0.001), decreasing to 5.7% after 6-9 months. A time trend towards higher drug concentrations was observed for efavirenz but not for other drugs. The virological failure rate remained unchanged whereas the immunological failure rate decreased from 14.4 to 8.7% at the last visit (P = 0.002).
Conclusions: Patient-centred communication can successfully be implemented with a simple intervention in rural Africa. It increases the likelihood of HIV-infected patients reporting problems with adherence to ART; however, sustainability remains a challenge.
Keywords: HIV; antiretroviral therapy; patient-centred communication; self-reported adherence; sub-Saharan Africa; therapeutic drug monitoring.
© 2017 The Authors HIV Medicine published by John Wiley & Sons Ltd on behalf of British HIV Association.
Figures

References
-
- Bangsberg DR, Perry S, Charlebois ED et al Non‐adherence to highly active antiretroviral therapy predicts progression to AIDS. AIDS 2001; 15: 1181–1183. - PubMed
-
- Nachega JB, Hislop M, Dowdy DW, Chaisson RE, Regensberg L, Maartens G. Adherence to nonnucleoside reverse transcriptase inhibitor‐based HIV therapy and virologic outcomes. Ann Intern Med 2007; 146: 564–573. - PubMed
-
- Paterson DL, Swindells S, Mohr J et al Adherence to protease inhibitor therapy and outcomes in patients with HIV infection. Ann Intern Med 2000; 133: 21–30. - PubMed
-
- Glass TR, Sterne JA, Schneider MP et al Self‐reported nonadherence to antiretroviral therapy as a predictor of viral failure and mortality. AIDS 2015; 29: 2195–2200. - PubMed
Publication types
MeSH terms
Substances
LinkOut - more resources
Full Text Sources
Other Literature Sources
Medical
