. 2017 Apr 13;121(14):3042-3058.
doi: 10.1021/acs.jpcb.7b02252. Epub 2017 Mar 30.

Conformational Populations of β-(1→4) O-Glycosidic Linkages Using Redundant NMR J-Couplings and Circular Statistics

Affiliations

Conformational Populations of β-(1→4) O-Glycosidic Linkages Using Redundant NMR J-Couplings and Circular Statistics

Wenhui Zhang et al. J Phys Chem B. .

Abstract

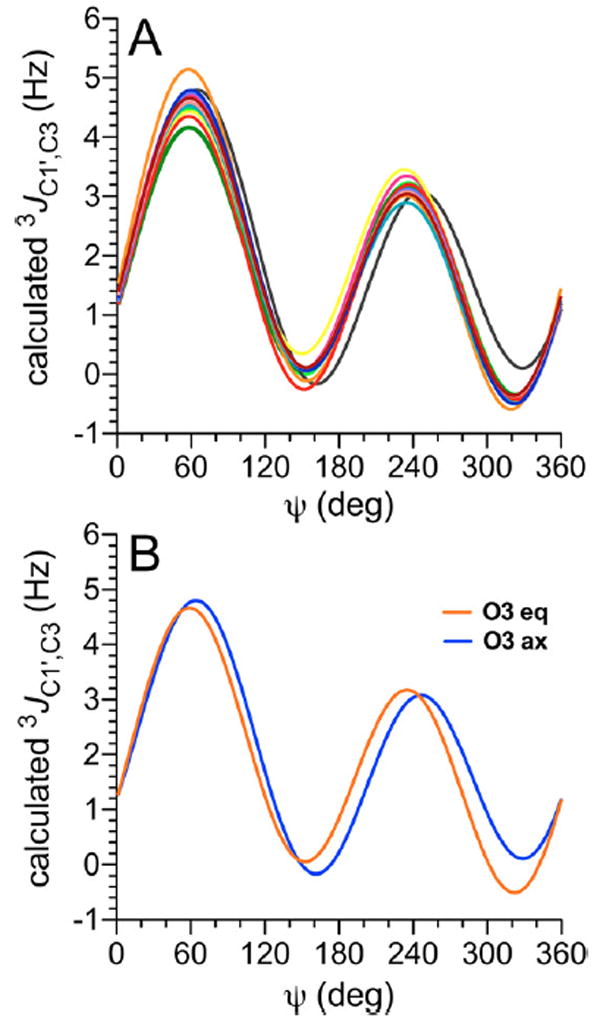
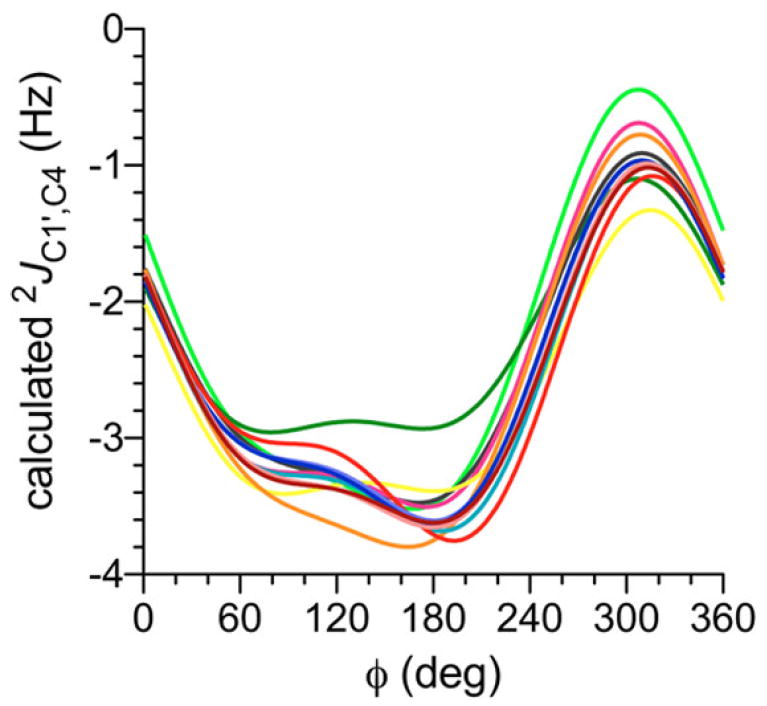
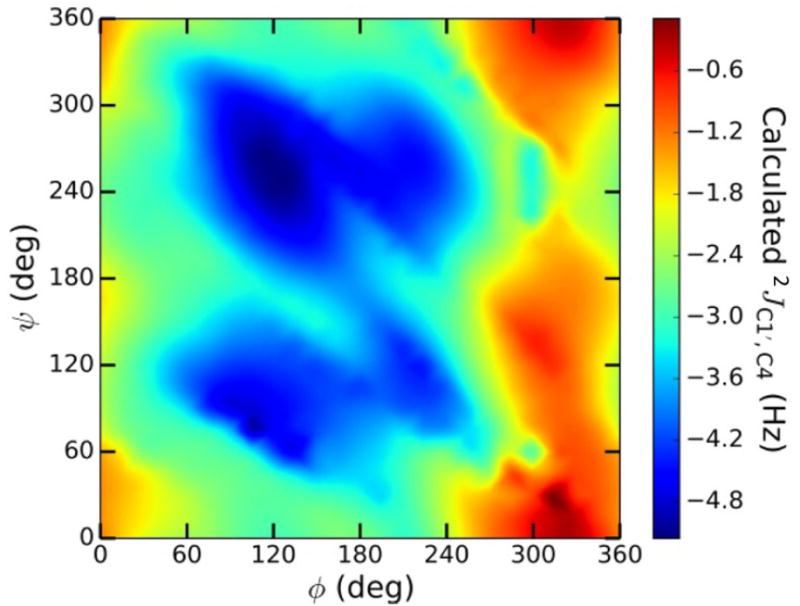
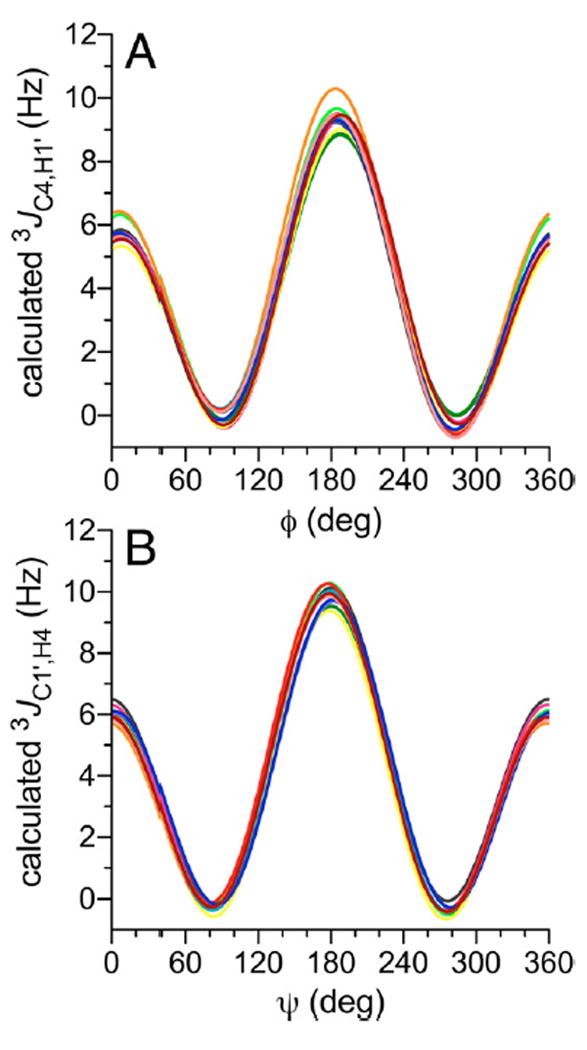
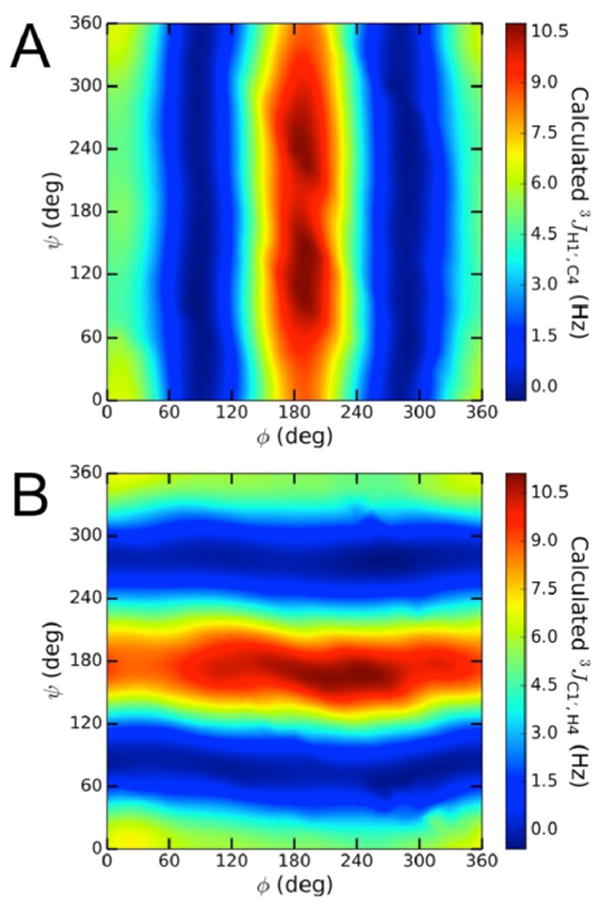
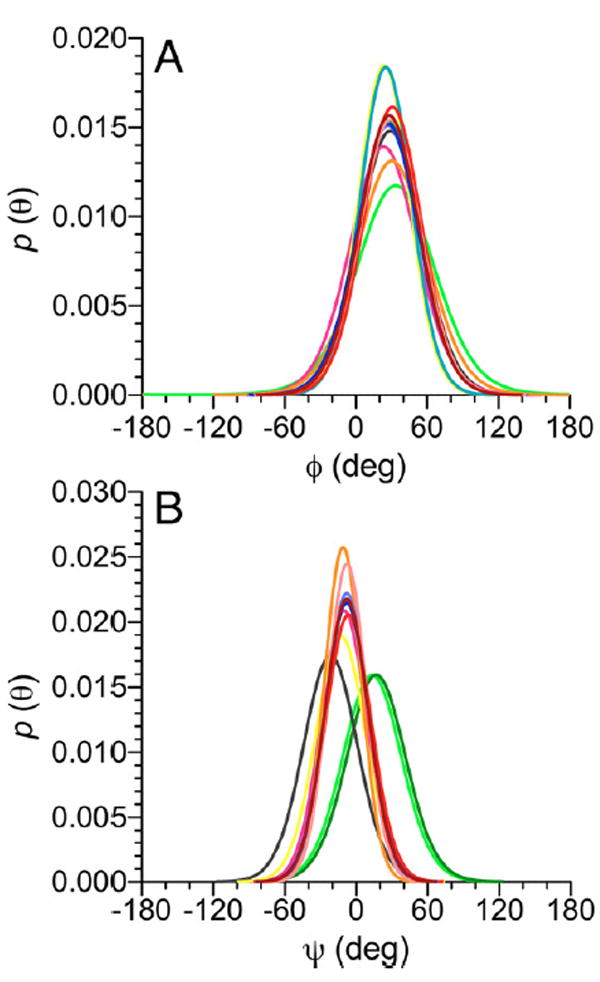
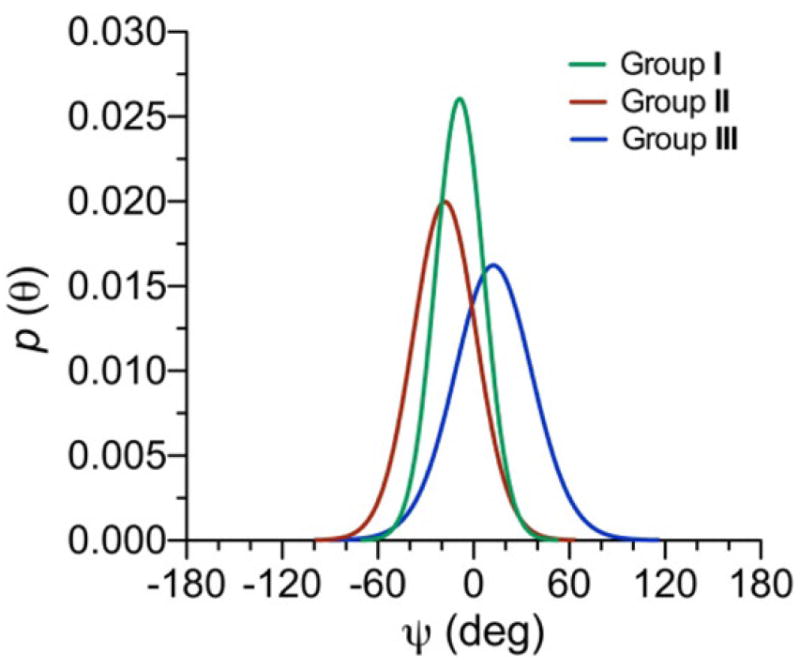
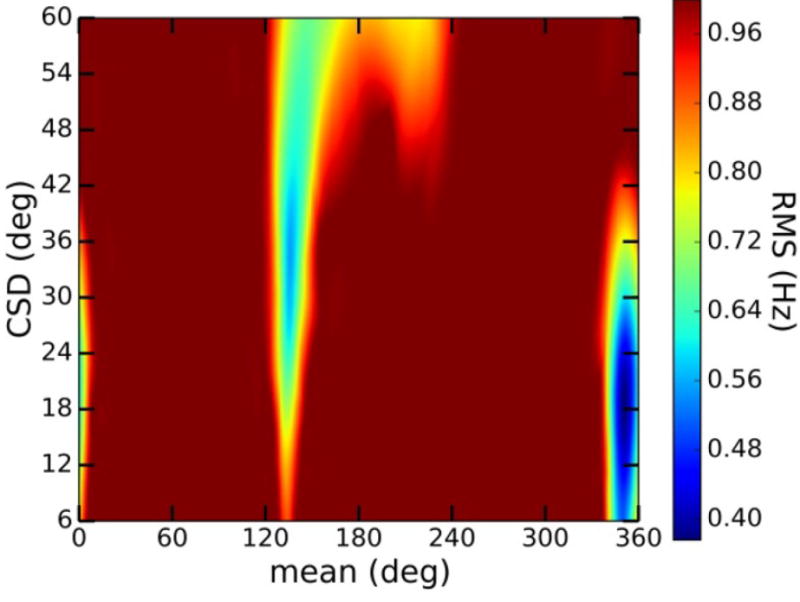
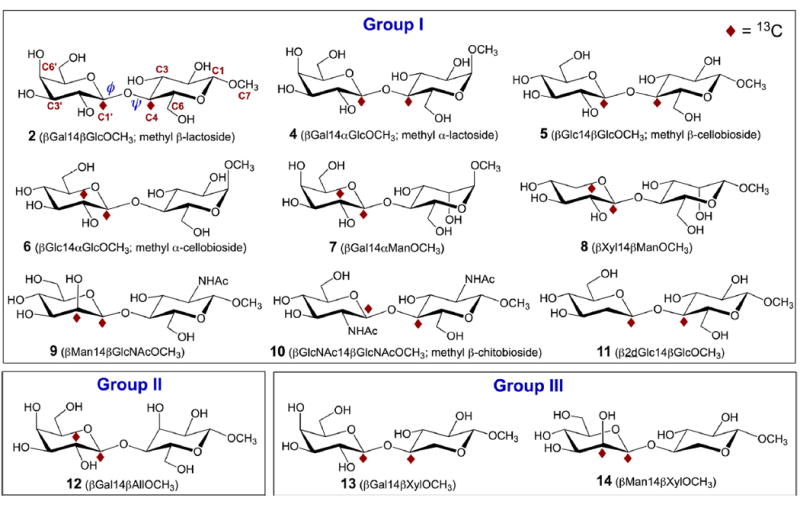
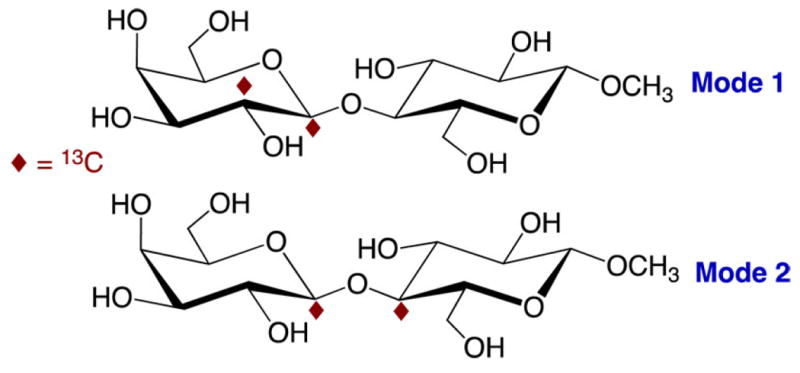
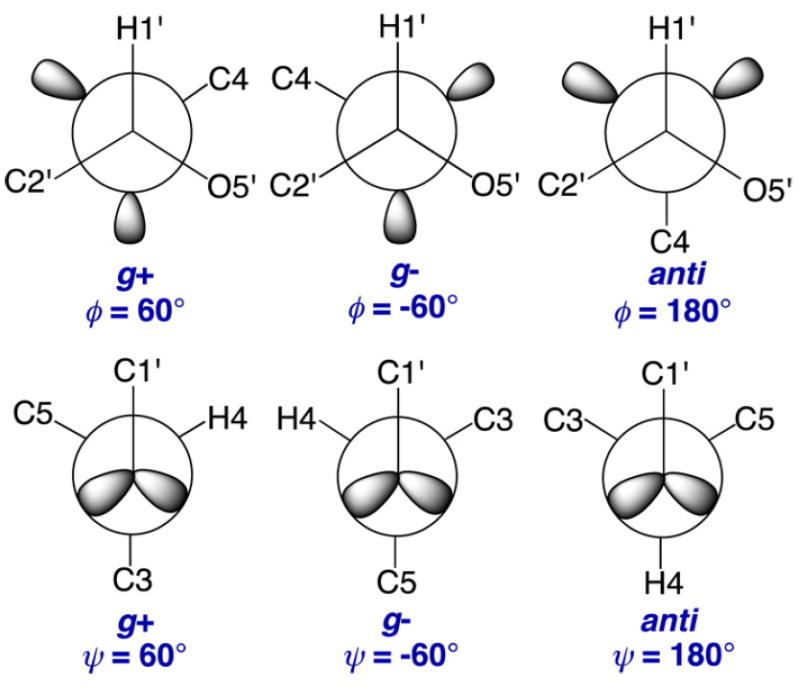
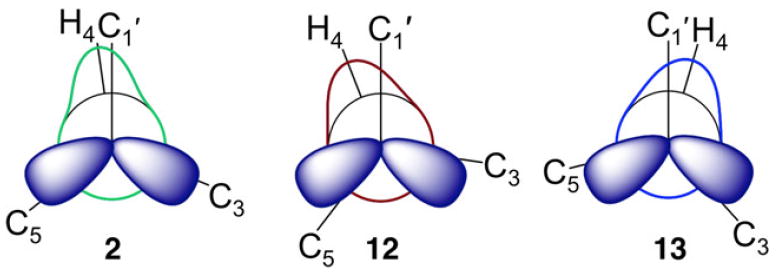
Twelve disaccharides containing β-(1→4) linkages and displaying systematic structural variations in the vicinity of these linkages were selectively labeled with 13C to facilitate measurements of multiple NMR spin-spin (scalar; J) coupling constants (JCH and JCC values) across their O-glycosidic linkages. Ensembles of spin-couplings (2JCOC, 3JCOCH, 3JCOCC) sensitive to the two linkage torsion angles, phi (ϕ) and psi (ψ), were analyzed by using parametrized equations obtained from density functional theory (DFT) calculations, Fredholm theory, and circular statistics to calculate experiment-based rotamer populations for ϕ and ψ in each disaccharide. With the statistical program MA'AT, torsion angles ϕ and ψ were modeled as a single von Mises distribution, which yielded two parameters, the mean position and the circular standard deviation (CSD) for each angle. The NMR-derived rotamer populations were compared to those obtained from 1 μs aqueous molecular dynamics (MD) simulations and crystallographic database statistical analyses. Conformer populations obtained exclusively from the MA'AT treatment of redundant J-couplings were in very good agreement with those obtained from the MD simulations, providing evidence that conformational populations can be determined by NMR for mobile molecular elements such as O-glycosidic linkages with minimal input from theory. The approach also provides an experimental means to validate the conformational preferences predicted from MD simulations. The conformational behaviors of ϕ in the 12 disaccharides were very similar, but those of ψ varied significantly, allowing a classification of the 12 disaccharides based on preferred linkage conformation in solution.


Conflict of interest statement

Notes

The authors declare no competing financial interest.

Figures

Figure 1
Figure 1
Contour plot of DFT-calculated 3JC1′,C5 values in βGal14βXylOCH3 13 as a function of ϕ and ψ, showing a secondary dependence on ϕ at some values of ψ (ϕ = H1′–C1′–O1′–C4; ψ = C1′–O1′–C4–H4).
Figure 2
Figure 2
Calculated 3JC1′,C5 values in βGal14βXylOCH3 13 as a function of ψ before (A) and after (B) the application of a 10 kcal/mol energy cutoff to the data. In both plots, the blue line is the best fit of the data. ψ = C1′–O1′–C4–H4.
Figure 3
Figure 3
(A) Calculated 3JC2′,C4 values in disaccharides 2 and 4–14 as a function of ϕ. (B) Plots of the three generalized eqs 3 – 5, showing the effects of structure and configuration at C2′ on 3JC2′,C4 in β-(1→4) linkages. ϕ = H1′–C1′–O1′–C4.
Figure 4
Figure 4
(A) Calculated 3JC1′,C5 values in disaccharides 2 and 4–14 as a function of ψ. See Figure 3 for color definitions. (B) Plots of generalized eqs 6 and 7 showing the effect of different substituents at C5 (–CH2OH vs – H) on 3JC1′,C5 in β-(1→4) linkages. ψ = C1′–O1′–C4–H4.
Figure 5
Figure 5
(A) Calculated 3JC1′,C3 values in disaccharides 2 and 4–14 as a function of ψ. See Figure 3 for color definitions. (B) Plots of eqs 8 and 9 used to treat 3JC1′,C3 values in β-(1→4) linkages for coupling pathways with axial and equatorial orientations of the terminal O3. ψ = C1′–O1′–C4–H4.
Figure 6
Figure 6
Calculated 2JC1′,C4 values in disaccharides 2 and 4–14 as a function of ϕ. This geminal 2JCOC is negative in sign and exhibits a dynamic range of ~3 Hz, with the least negative (most positive) values observed at ϕ = 300° (O5′ anti to C4). Each curve represents the average of 24 2JC1′,C4 vs ϕ curves at different ψ values to account for the indirect effects of ψ on 2JC1′,C4. See Figure 3 for color definitions. ϕ = H1′–C1′–O1′–C4.
Figure 7
Figure 7
2D Contour plot of calculated 2JC1′,C4 values in βGal14βGlcOCH3 2 as a function of ϕ and ψ. ϕ = H1′–C1′–O1′– C4; ψ = C1′–O1′–C4–H4.
Figure 8
Figure 8
Calculated 3JC4,H1′ (A) and 3JC1′,H4 (B) values in disaccharides 2 and 4–14 as a function of ϕ and ψ, respectively. See Figure 3 for color definitions. ϕ = H1′–C1′–O1′–C4; ψ = C1′–O1′–C4–H4.
Figure 9
Figure 9
(A) Contour plot of calculated 3JC4,H1′ values in 2, showing a primary dependency on ϕ. (B) Contour plot of calculated 3JC1′,H4 values in 2, showing a primary dependency on ψ.ϕ = H1′–C1′–O1′–C4; ψ = C1′–O1′–C4–H4.
Figure 10
Figure 10
Single-state von Mises models of ϕ-dependent J-couplings (A) and ψ-dependent J-couplings (B) in disaccharides 2 and 4–14. In (A), a common mean position of ϕ at ~29° is observed. In (B), three different mean positions at ~−22°, ~−9°, and ~15° are observed (Table 3). See Figure 3 for color definitions. ϕ = H1′–C1′–O1′–C4; ψ = C1′–O1′–C4–H4.
Figure 11
Figure 11
Single-state von Mises models of ψ for disaccharides in Groups I–III. Distributions were determined using DFT-derived eqs 3–11 and the average experimental J-couplings in each group (Table 1). Group I: μ = −8.8° (±6), σ = 15.5° (±12), RMS = 0.23 Hz. Group II: μ = –18.1° (±7), σ = 20.3° (±11), RMS = 0.16 Hz. Group III: μ = 12.4° (±9), σ = 25.2° (±9), RMS = 0.43 Hz. μ = mean, σ = CSD.
Figure 12
Figure 12
Parameter space for the single-state von Mises model of ψ in 2. At least two local minima are observed in addition to the global minimum at μ = −8°/σ = 18° (μ = mean; σ = CSD). The local minimum at μ = 130°/σ = 36° has an RMS error of 0.60 Hz. The local minimum at μ = 210°/σ = 60° has an RMS error of 0.76 Hz.
Figure 13
Figure 13
Histograms from 1 μs aqueous MD simulations for ϕ (A)–(C) and ψ (D)–(F) in disaccharides 2, 12, and 13. Mean positions for ϕ are +44°, + 44°, and +46° for 2, 12, and 13, respectively. Mean positions for ψ are −3°, − 20°, and +16° for 2, 12, and 13, respectively. Red = 2; green = 12, blue = 13. See Table 5 for CSDs.
Figure 14
Figure 14
Newman projections for ϕ and ψ in disaccharides 2, 12, and 13 superimposed on statistical distributions determined by NMR J-coupling analysis (blue lines) and aqueous MD simulations (red histograms).
Scheme 1
Scheme 1
Redundant J-Couplings across a “Two-Bond” β-(1→4) O-Glycosidic Linkage, Illustrated in Disaccharide 2
Scheme 2
Scheme 2
Redundant J-Couplings across a “Three-Bond” β-(1→6) O-Glycosidic Linkage, Illustrated in Disaccharide 3
Scheme 3
Scheme 3
Structures of the 12 13C-Labeled β-(1→4)-Linked Disaccharides Studied in This Investigation a aTheir classification into three groups is based on conformational preferences about their internal O-glycosidic linkages (see text). Modes of 13C-labeling are described in Scheme 4.
Scheme 4
Scheme 4
Two 13C-Labeling Modes Used To Measure J-Couplings across the “Two-Bond” O-Glycosidic Linkages in 2 and 4–14, Illustrated in 2
Scheme 5
Scheme 5
Definitions of the ϕ and ψ Rotamers in 2 and 4–14
Scheme 6
Scheme 6
Newman Projections for ψ Superimposed on von Mises Models of ψ in Representative Disaccharides in Groups I (2), II (12), and III (13)

Similar articles

Cited by

References

    1. Carver JP. Oligosaccharides: How Can Flexible Molecules Act as Signals? Pure Appl Chem. 1993;65:763–770.
    1. Homans SW. Conformation and Dynamics of Oligosaccharides in Solution. Glycobiology. 1993;3:551–555. - PubMed
    1. Yamamoto S, Zhang Y, Yamaguchi T, Kameda T, Kato K. Lanthanide-assisted NMR Evaluation of a Dynamic Ensemble of Oligosaccharide Conformations. Chem Commun. 2012;48:4752–4754. - PubMed
    1. Warner JB, Thalhauser C, Tao K, Sahagian GG. Role of N-Linked Oligosaccharide Flexibility in Mannose Phosphorylation of Lysosomal Enzyme Cathepsin L. J Biol Chem. 2002;277:41897–41905. - PubMed
    1. Woods RJ, Pathiaseril A, Wormald MR, Edge CJ, Dwek RA. The High Degree of Internal Flexibility Observed for an Oligomannose Oligosaccharide Does Not Alter the Overall Topology of the Molecule. Eur J Biochem. 1998;258:372–386. - PubMed

Publication types

LinkOut - more resources