

Independently founded populations of Sclerotinia sclerotiorum from a tropical and a temperate region have similar genetic structure
- PMID: 28296968
- PMCID: PMC5352009
- DOI: 10.1371/journal.pone.0173915
Independently founded populations of Sclerotinia sclerotiorum from a tropical and a temperate region have similar genetic structure
Abstract
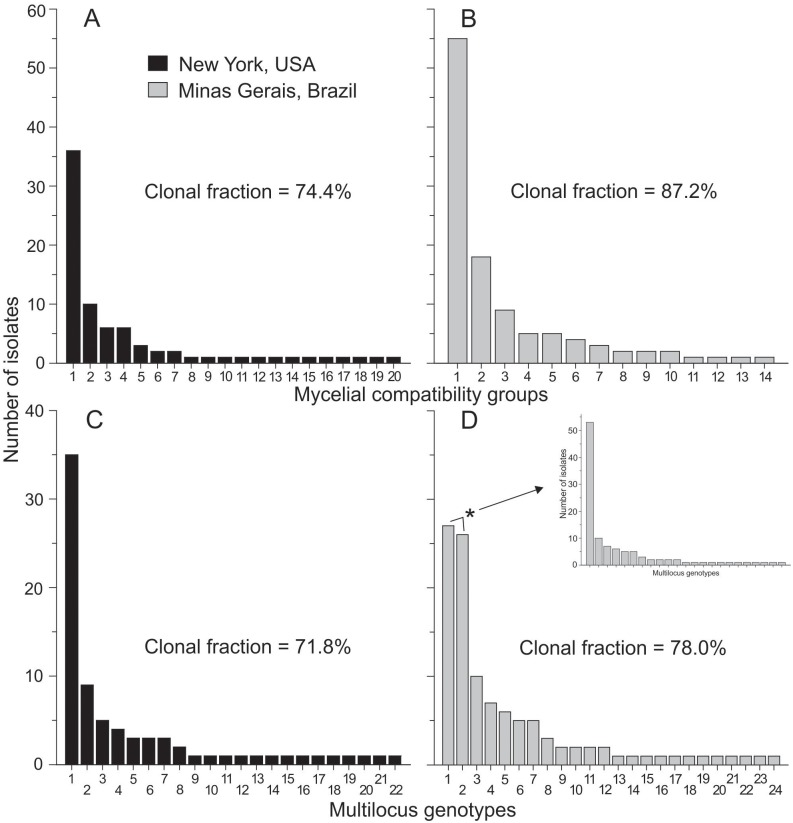
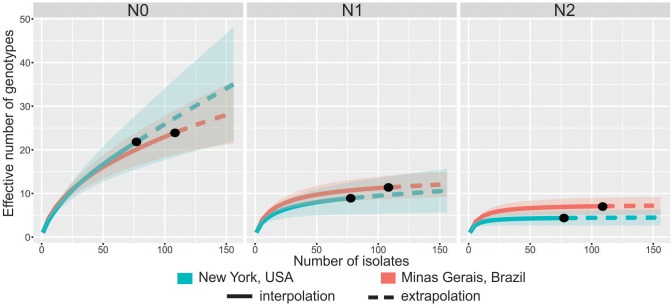
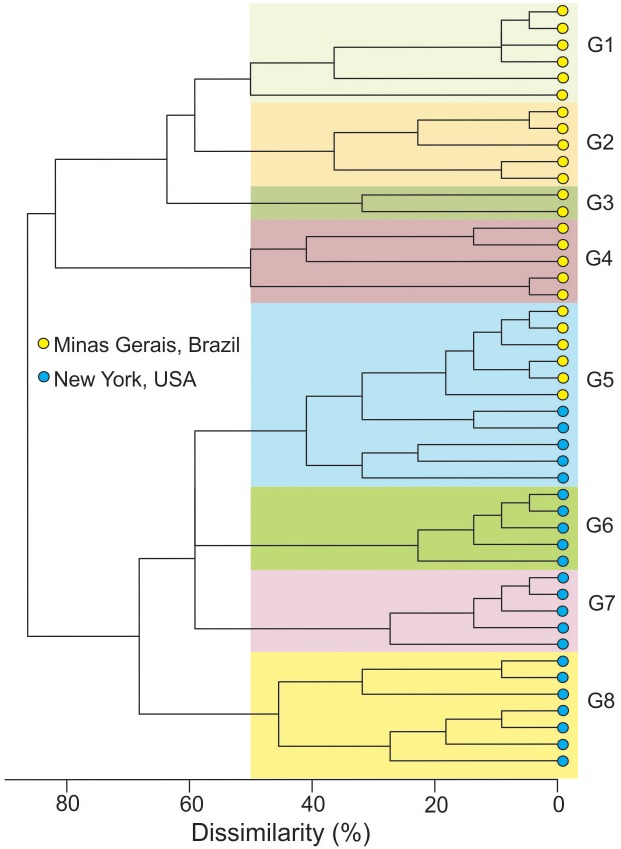
Sclerotinia sclerotiorum populations from tropical agricultural zones have been suggested to be more variable compared to those from temperate zones. However, no data were available comparing populations from both zones using the same set of markers. In this study, we compared S. sclerotiorum populations from the United States of America (USA, temperate) and southeast Brazil (tropical) using the frequency of mycelial compatibility groups (MCGs) and 13 microsatellite (SSR) markers. Populations were sourced from diseased plants within leguminous crops in New York, USA (NY; n = 78 isolates), and Minas Gerais State, Brazil (MG; n = 109). Twenty MCGs were identified in NY and 14 were previously reported in MG. The effective number of genotypes based on Hill's number of order 0, which corresponded to the number of multilocus genotypes (MLGs) were 22 (95% CI = 15.6-28.4) and 24 (95% CI = 18.9-29.1) in NY and MG, respectively. Clonal fractions of MLGs were 71.8% (NY) and 78.0% (MG). The effective number of genotypes based on Hill's number of orders 1 and 2 in NY were 8.9 (95% CI = 5.2-12.6) and 4.4 (95% CI = 2.6-6.1), respectively. For MG these indices were 11.4 (95% CI = 8.7-14.1) and 7.1 (95% CI = 5.1-9.0), respectively. There were no significant differences of allelic richness, private allelic richness, gene diversity, effective number of alleles and genotype evenness between the NY and MG populations. The populations were differentiated, with 29% of total variance attributed to differences between them and G''ST and Jost's D indices higher than 0.50. Cluster analysis revealed dissimilarity higher than 80% among most MLGs from both populations. Different alleles segregated in the populations but both had similar levels of genotypic variability.
Conflict of interest statement
Figures
References
-
- del Río LE, Venette JR, Lamey HA. Impact of white mold incidence on dry bean yield under nonirrigated conditions. Plant Dis. 2004; 88:1352–1356. - PubMed
-
- del Río LE, Bradley CA, Henson RA, Endres GJ, Hanson BK, McKay K, et al. Impact of Sclerotinia stem rot on yield of canola. Plant Dis. 2007; 91:191–194. - PubMed
-
- Lehner MS, Pethybridge SJ, Meyer MC, Del Ponte EM. Meta-analytic modelling of the incidence–yield and incidence–sclerotial production relationships in soybean white mould epidemics. Plant Pathol. 2016;
-
- Lehner MS, Mizubuti ESG. Are Sclerotinia sclerotiorum populations from the tropics more variable than those from subtropical and temperate zones? Trop Plant Pathol. 2017;
-
- Kohli Y, Morrall AA, Anderson JB, Kohn LM. Local and trans-Canadian clonal distribution of Sclerotinia sclerotiorum on canola. Phytopathology 1992; 82:875–880.
MeSH terms
LinkOut - more resources
Full Text Sources
Other Literature Sources
