. 2017 Mar;6(3):877-885.
doi: 10.5966/sctm.2016-0269. Epub 2016 Sep 22.

Magnetic Resonance Imaging-Guided Delivery of Neural Stem Cells into the Basal Ganglia of Nonhuman Primates Reveals a Pulsatile Mode of Cell Dispersion

Affiliations

Magnetic Resonance Imaging-Guided Delivery of Neural Stem Cells into the Basal Ganglia of Nonhuman Primates Reveals a Pulsatile Mode of Cell Dispersion

Kristen E Malloy et al. Stem Cells Transl Med. 2017 Mar.

Abstract

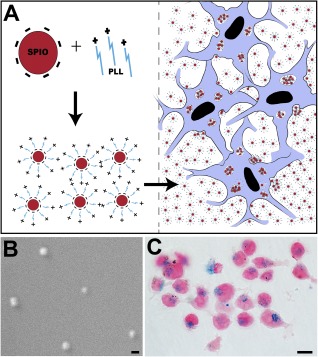
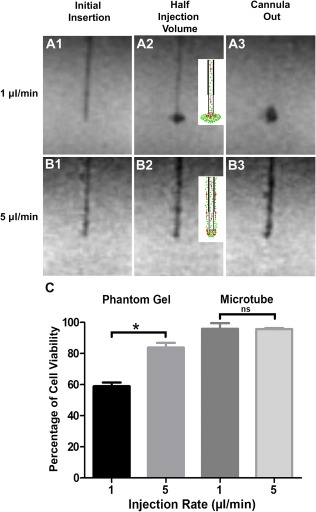
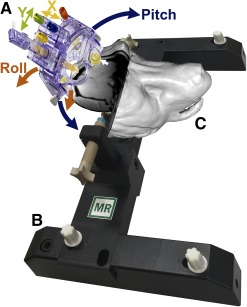
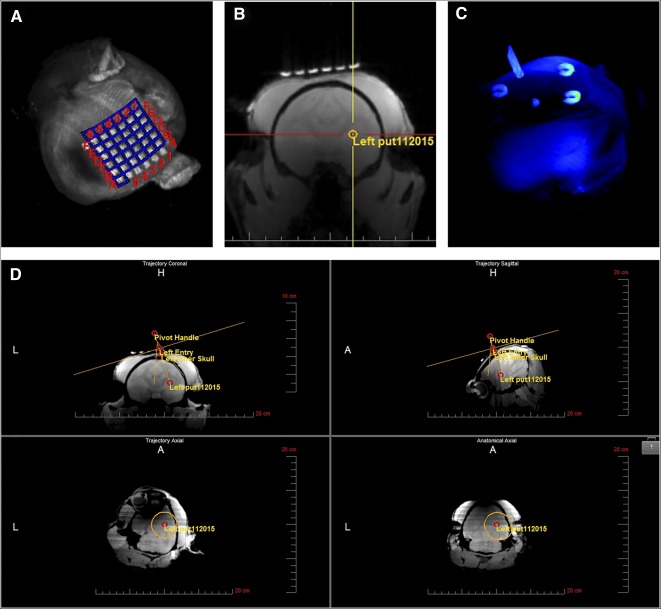
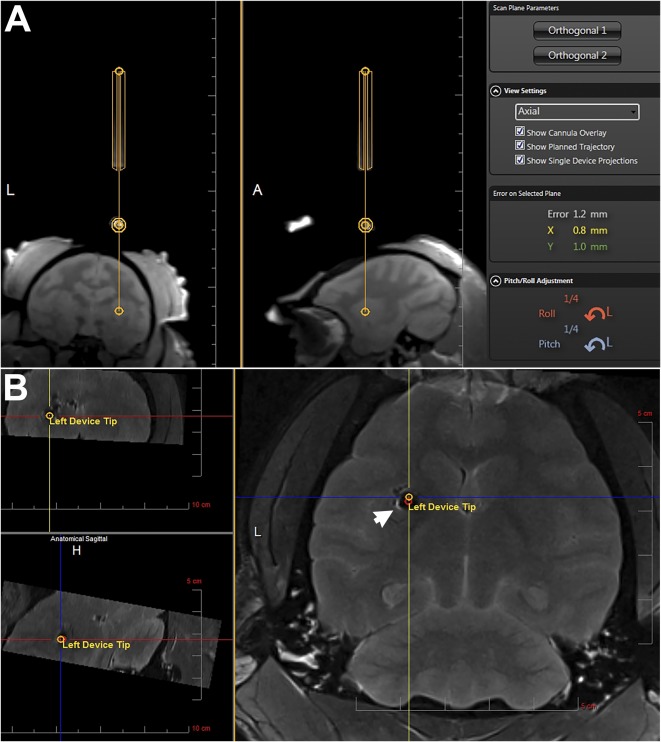
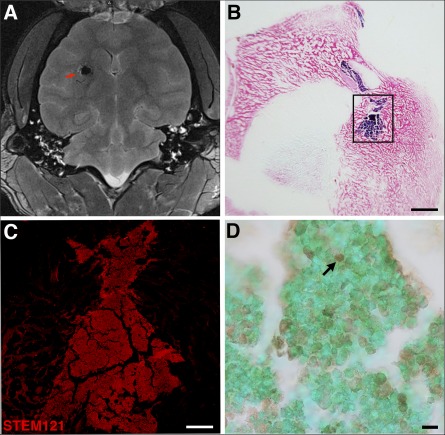
Optimal stem cell delivery procedures are critical to the success of the cell therapy approach. Variables such as flow rate, suspension solution, needle diameter, cell density, and tissue mechanics affect tissue penetration, backflow along the needle, and the dispersion and survival of injected cells during delivery. Most cell transplantation centers engaged in human clinical trials use custom-designed cannula needles, syringes, or catheters, sometimes precluding the use of magnetic resonance imaging (MRI)-guided delivery to target tissue. As a result, stem cell therapies may be hampered because more than 80% of grafted cells do not survive the delivery-for example, to the heart, liver/pancreas, and brain-which translates to poor patient outcomes. We developed a minimally invasive interventional MRI (iMRI) approach for intraoperatively imaging neural stem cell (NSC) delivery procedures. We used NSCs prelabeled with a contrast agent and real-time magnetic resonance imaging to guide the injection cannula to the target and to track the delivery of the cells into the putamen of baboons. We provide evidence that cell injection into the brain parenchyma follows a novel pulsatile mode of cellular discharge from the delivery catheter despite a constant infusion flow rate. The rate of cell infusion significantly affects the dispersion and viability of grafted cells. We report on our investigational use of a frameless navigation system for image-guided NSC transplantation using a straight cannula. Through submillimeter accuracy and real-time imaging, iMRI approaches may improve the safety and efficacy of neural cell transplantation therapies. Stem Cells Translational Medicine 2017;6:877-885.

Keywords: Cell flow; ClearPoint system; Interventional magnetic resonance imaging; Nonhuman primate; Real-time interventional magnetic resonance imaging-guided cell transplantation; Rheology; Stem cell delivery.


Figures

Figure 1
Figure 1
SPIO labeling of neural stem cells (NSCs). (A): Schematic drawing of SPIO particles’ negatively charged complexes through electrostatic interactions with the positively charged PLL molecule and take‐up (encapsulation) by the cells after incubation, thus forming intracellular endosomes. (B): Electron microscope scanning image showing the actual size of the SPIO nanoparticles. (C): Photomicrograph of NSCs after 72‐hour incubation with SPIO‐PLL complex shows intracellular SPIO nanoparticles revealed with Prussian blue staining. Scale bars = 200 nm (B), 15 µm (C). Abbreviations: PLL, poly‐l‐lysine; SPIO, superparamagnetic iron oxide.
Figure 2
Figure 2
Impact of infusion rate and physical constraints on cell dispersion and survival in a brain phantom gel. Magnetic resonance imaging scans showing the progression of superparamagnetic iron oxide‐labeled neural stem cells (NSCs) infused into agarose gel phantoms at 1 μl per minute (A1–A3) and 5 μl per minute (B1–B3). The schematic drawings (A2, B2) depict the flow and dispersion (red arrows) of cells (1 μl per minute) (A2) and backflow of cells up the cannula trajectory (5 μl per minute) (B2). The postinjection scans (cannula out) show a well‐formed cloud of NSCs at 1 μl per minute (A3) and backflow of NSCs along the cannula trajectory at 5 μl per minute (B3). (C): NSCs injected either into the phantom gel or into the air inside a microtube show that slow injection (1 µl per minute) causes more cell death than does faster injection rate (5 µl per minute), although no significant change in viability was observed when NSCs were injected into a microtube. Data represent the mean ± SEM of experiments performed in triplicate in three independent experiments. ∗, p < .05. Abbreviation: ns, not significant.
Figure 3
Figure 3
ClearPoint system used for interventional magnetic resonance imaging (iMRI)‐guided transplantation of neural stem cells. (A): The ClearPoint is a frameless navigation system that uses fiducials (white arrow) placed on a head‐mounted aiming device. The system includes the SmartFrame trajectory guide (A), which is hand controlled to rotate and align the cannula guide using initially the blue (pitch; blue arrows) and orange (roll; orange arrows) knobs, followed by the yellow (X; yellow arrows) and green (Y; green arrows) knobs for the final fine adjustments. (B): Head‐fixation frame. (C): Three‐dimensional (3D) surface rendering of a representative baboon head positioned in the head‐fixation frame locked to the MRI table. The surface rendering was constructed from a postinjection MRI series using the “build surface” feature in the software Mango. The 3D surface was smoothed and overlaid with the original MRI slices at the cut planes corresponding to the injection site. Abbreviation: MR, magnetic resonance.
Figure 4
Figure 4
Trajectory alignment. (A): Maximum intensity projection (MIP) of the SmartGrid, a 6 × 6 array of magnetic resonance imaging (MRI)‐sensitive gadolinium‐filled squares placed on the skull covering the estimated entry point of the needle. (B): Three‐dimensional T1‐weighted gradient echo series transferred to the ClearPoint workstation and used to select the target. (C): MIP of the SmartFrame trajectory guide showing fiducial markers used by the software to segment the SmartFrame and to calculate magnetic resonance scanning parameters for planning the trajectory of the cannula. (D): Point of entry and trajectory to the target set based on the anterior and posterior commissures and the midsagittal plane and adjusted, if needed, to ovoid particular structures, ventricular systems, or blood vessels using the “fly‐through” trajectory option. Abbreviations: A, anterior; H, head; L, left.
Figure 5
Figure 5
Finalizing trajectory and cannula entry. (A): Representative slices of the orthogonal alignment images shown in the ClearPoint software. The yellow lines outline the segmentation of the cannula guide. The software‐calculated adjustments are shown in orange (Roll) and blue (Pitch) on the bottom right. (B): Postinjection magnetic resonance image overlaid with the planned target and cannula tip (Left Device Tip) as calculated by the ClearPoint software showing the superparamagnetic iron oxide‐labeled neural stem cell graft (arrow, hypointense area) on target. Abbreviations: A, anterior; H, head; L, left.
Figure 6
Figure 6
Postinjection magnetic resonance image and immunohistochemistry of superparamagnetic iron oxide (SPIO)‐labeled neural stem cells (NSCs). (A): MRI shows the SPIO‐labeled NSCs as a hypointense region indicated by the red arrow on the horizontal T2‐weighted scan. (B): Image of Prussian blue staining of a frontal section of the brain counterstained with nuclear fast red, visualizing the NSC graft in blue. (C): Inset from (B) showing high‐power immunofluorescence staining of the NSC graft with the human marker STEM121. (D): Terminal deoxynucleotidyl transferase 2´‐deoxyuridine, 5´‐triphosphate nick‐end labeling assay staining of NSC grafts in baboon brain showing dead cells (black arrow) inside the graft and live cell nuclei stained with methyl green. Scale bars =2.5 mm (B), 500 µm (C), and 20 µm (D).

Similar articles

Cited by

References

    1. Liu J, Narsinh KH, Lan F et al. Early stem cell engraftment predicts late cardiac functional recovery:Preclinical insights from molecular imaging. Circ Cardiovasc Imaging 2012;5:481–490. - PMC - PubMed
    1. Shapiro AM, Geng Hao E, Lakey JR et al. Defining optimal immunosuppression for islet transplantation based on reduced diabetogenicity in canine islet autografts. Transplantation 2002;74:1522–1528. - PubMed
    1. Hagell P, Brundin P. Cell survival and clinical outcome following intrastriatal transplantation in Parkinson disease. J Neuropathol Exp Neurol 2001;60:741–752. - PubMed
    1. Daadi MM, Pivirotto P, Bringas J et al. Distribution of AAV2‐hAADC‐transduced cells after 3 years in Parkinsonian monkeys. Neuroreport 2006;17:201–204. - PubMed
    1. Bankiewicz K, Daadi M, Pivirotto P et al. Focal dopamine production in the striatum potentiaties dyskinesias in non‐human primate model of Parkinson’s disease and may explain induction of run‐away dyskinesias in PD patients after fetal mesencephalic implantation. Neurology 2004;62:A11–A12.

Publication types