. 2017 Mar;6(3):864-876.
doi: 10.5966/sctm.2016-0240. Epub 2016 Oct 14.

Endothelial Cells Promote Expansion of Long-Term Engrafting Marrow Hematopoietic Stem and Progenitor Cells in Primates

Affiliations

Endothelial Cells Promote Expansion of Long-Term Engrafting Marrow Hematopoietic Stem and Progenitor Cells in Primates

Jennifer L Gori et al. Stem Cells Transl Med. 2017 Mar.

Abstract

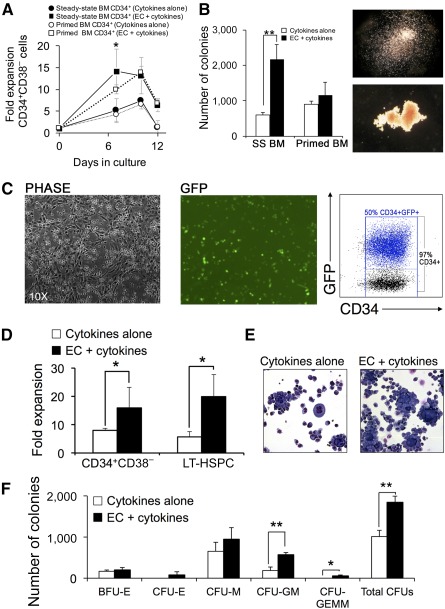
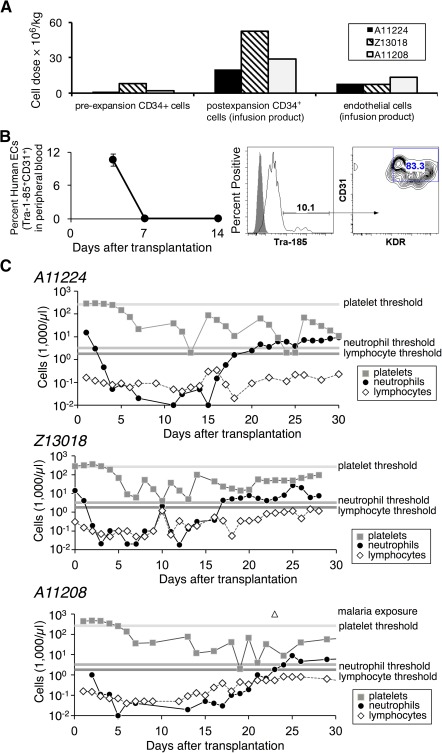
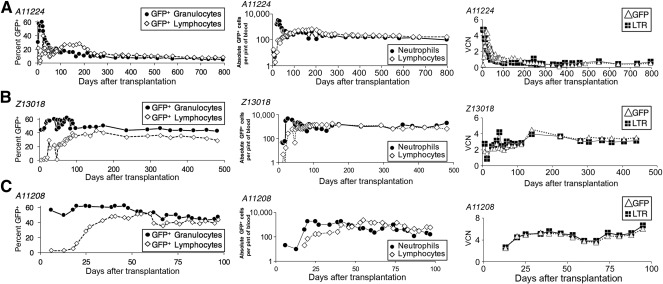
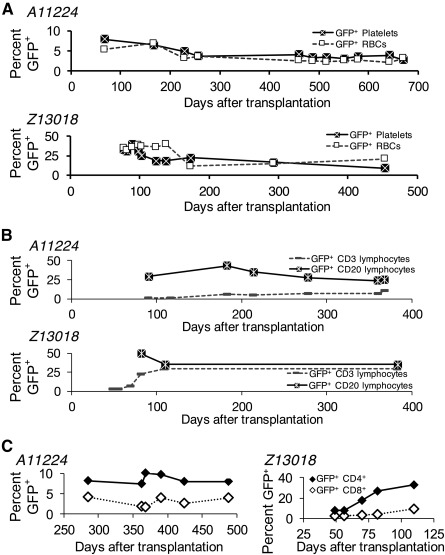
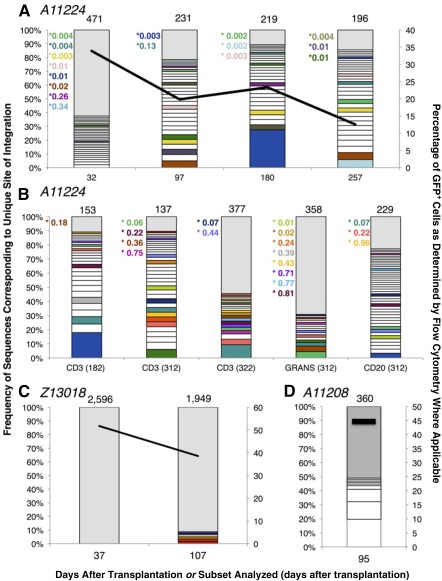
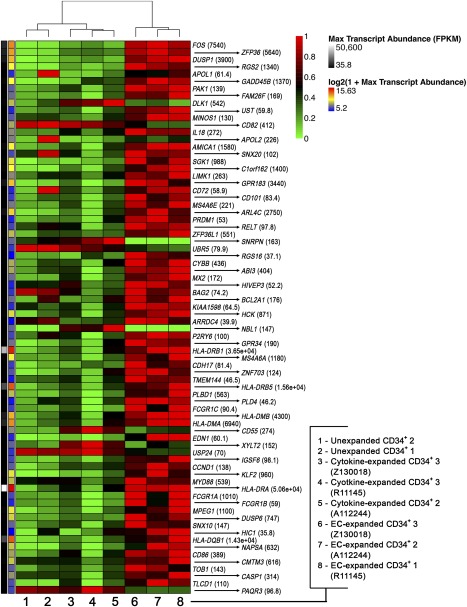
Successful expansion of bone marrow (BM) hematopoietic stem and progenitor cells (HSPCs) would benefit many HSPC transplantation and gene therapy/editing applications. However, current expansion technologies have been limited by a loss of multipotency and self-renewal properties ex vivo. We hypothesized that an ex vivo vascular niche would provide prohematopoietic signals to expand HSPCs while maintaining multipotency and self-renewal. To test this hypothesis, BM autologous CD34+ cells were expanded in endothelial cell (EC) coculture and transplanted in nonhuman primates. CD34+ C38- HSPCs cocultured with ECs expanded up to 17-fold, with a significant increase in hematopoietic colony-forming activity compared with cells cultured with cytokines alone (colony-forming unit-granulocyte-erythroid-macrophage-monocyte; p < .005). BM CD34+ cells that were transduced with green fluorescent protein lentivirus vector and expanded on ECs engrafted long term with multilineage polyclonal reconstitution. Gene marking was observed in granulocytes, lymphocytes, platelets, and erythrocytes. Whole transcriptome analysis indicated that EC coculture altered the expression profile of 75 genes in the BM CD34+ cells without impeding the long-term engraftment potential. These findings show that an ex vivo vascular niche is an effective platform for expansion of adult BM HSPCs. Stem Cells Translational Medicine 2017;6:864-876.

Keywords: Bone marrow transplantation; CD34+ cells; Endothelial cells; Gene therapy; Hematopoietic stem progenitor cell.


Figures

Figure 1
Figure 1
Human ECs support robust expansion of hematopoietic stem/progenitor cells. (A): Kinetics of expansion of SS and granulocyte colony‐stimulating factor/stem cell factor‐primed BM‐derived CD34+CD38 cells after coculture with cytokines with or without human ECs (n = 3 naïve donors per condition). (B): Analysis of hematopoietic colony‐forming cell (CFC) potential of BM‐derived CD34+ cells after 7‐day expansion with cytokines with or without EC. Right: Images of CFU‐M (top) and BFU‐E (bottom) colonies. (C): Phase contrast (left) and fluorescent (middle) images of P140K‐MGMT‐GFP transduced macaque SS BM CD34+ cells and EC after 7 days of coculture. Right: Flow cytometry analysis of GFP and CD34 coexpression in gene‐modified CD34+ cells after EC expansion. (D): Summary of P140K‐MGMT‐GFP lentivirus‐transduced SS BM CD34+ cell expansion by flow cytometry analysis for detection of CD34+CD38 and LT‐HSPC phenotype (CD34+CD49f+Thy1+CD38CD45RA; n = 3 naïve donors). (E): Microscopy showing morphology of Wright‐stained cytospin samples of gene‐modified CD34+ hematopoietic cells after coculture with cytokines with or without EC. (F): CFC analysis showing frequency and morphology of CFUs generated from gene‐modified CD34+ cells after expansion with cytokines with or without EC. Data are shown as the mean from the three experiments (donors) ± SD. CFC assays were conducted with three macaque donors and three biologic replicates per donor. Total CFUs are expressed per 105 cells plated in MethoCult (StemCell Technologies). The colony types included BFU‐E, CFU‐M, CFU‐GM, and CFU‐GEMM. Statistical analysis used the Student t test: ∗, p < .05; ∗∗, p < .005. Abbreviations: BM, bone marrow; BFU‐E, burst‐forming unit‐erythroid; CFU, colony‐forming unit; CFU‐E, colony‐forming unit‐erythroid burst; CFU‐GEMM, colony‐forming unit‐granulocyte‐erythroid‐monocyte‐macrophage; CFU‐GM, colony‐forming unit‐granulocyte‐macrophage; CFU‐M, colony‐forming unit‐macrophage; EC, endothelial cell; GFP = green fluorescent protein; LT‐HSPC, long‐term hematopoietic and progenitor stem cell; SS, steady‐state.
Figure 2
Figure 2
Hematopoietic reconstitution after transplantation with endothelial cell (EC) expanded CD34+ cells. (A): Cell doses used in autologous hematopoietic and progenitor stem cell transplantation in three nonhuman primates (animal identification nos.: A11224, Z13018, A11208). For each naïve animal, CD34+ cells were collected from bone marrow (BM), prestimulated with cytokines for 2 days, transduced with P140K‐green fluorescent protein lentivirus vector, cryopreserved, thawed, and then expanded in endothelial cell coculture for 7 days. Each animal received myeloablative conditioning (1,020 cGy) followed by intravenous infusion with a heterogeneous mixture of the transduced CD34+ cells and endothelial cell coculture. Cell doses are indicated per kilogram of body weight of BM‐derived transduced CD34+ cells before (pre‐expansion) and after (postexpansion infusion product) coculture with endothelial cells. The infusion products contained both the autologous CD34+ cells and the xenogeneic human EC dose. (B): Human ECs detected in peripheral blood up to 1 week after cell infusion. Data shown represent mean ± SD for n = 3 monkeys (A11224, Z13018, A11208). Representative flow cytometry analysis of peripheral blood sample 4 days after transplantation of CD34+/EC cocultures for detection of the human‐specific cell surface marker CD147 (Tra‐1‐85 antibody) and EC‐specific cell surface markers CD31 and KDR. (C): Hematopoietic recovery (over the first 30 days for each of the three indicated animals) as indicated by complete blood count analysis. Horizontal shaded lines represent minimal threshold of recover for (from top to bottom): platelets, neutrophils, lymphocytes. Abbreviation: EC, endothelial cell.
Figure 3
Figure 3
Long‐term engraftment and in vivo multilineage contribution to hematopoiesis by endothelial cell‐expanded gene‐modified autologous CD34+ cells. Detection of gene‐modified cells in animals A11224 (A), Z13018 (B), and A11208 (C). Left: Percentages of GFP+ cells (gene marking by flow cytometry) in peripheral blood lymphocytes and granulocytes. Middle: Absolute cell numbers of GFP+ cells in peripheral blood lymphocytes and neutrophils. Right: Gene marking as determined by the mean VCN per circulating leukocyte genome equivalent (normalized to β‐globin copy number) by Taqman qPCR to detect the lentiviral LTR and GFP transgene. Abbreviations: GFP, green fluorescent protein; LTR, long terminal repeat; VCN, vector copy number.
Figure 4
Figure 4
Detection of gene‐modified platelets, RBCs, and lymphoid subsets in vivo. (A): Detection of GFP+ platelets and RBCs in animal A11224 (top) and animal Z13018 (bottom). (B): Detection of GFP+ CD3+ T lymphocytes and CD20+ B lymphocytes in animal A11224 (top) and animal Z13018 (bottom). (C): Detection of GFP+ CD4 and CD8 T‐lymphocyte subsets in animal A11224 (left) and animal Z13018 (right). For determination of gene marking in lymphoid subsets, cells in the lymphoid subgate within the forward scatter by side scatter (FSC × SSC) gate were costained with fluorophore‐conjugated CD3, CD4, CD8, and CD20 antibodies. The percentages of GFP+ cells were then evaluated within the CD3, CD4, CD8, and CD20 subset gates. Abbreviations: GFP, green fluorescent protein; RBCs, red blood cells.
Figure 5
Figure 5
Gene‐modified peripheral blood leukocytes demonstrate polyclonal engraftment after endothelial cell (EC) expansion and myeloablative transplantation. Each graph represents the clonal diversity observed at each time point and/or in each blood cell subpopulation examined as a function of the frequency of genomic sequences identified in the pool (primary y‐axis) for each animal: A11224 (A, B), Z13018 (C), and A11208 (D). Each bar designates the relative frequency of each clonal integration sequence identified in the sample from the most abundant (bottom of bar) to the least abundant (top of bar). The total number of unique sites of integration identified in each sample is listed at the top of each bar. Unique integration sites (clones) sequenced at a frequency >1% of the pool are designated by open boxes. All clones contributing <1% sequence frequency to the pool are grouped in a single gray box. Colored boxes designate clones tracked in multiple samples over time in the same animal. White boxes indicate the clones that were not observed in any other sample from the same animal. Clones tracked across multiple samples that did not contribute >1% frequency in a time point are designated by colored text citing the percentage of sequences identified within or next to the corresponding gray box. Overlay lines designate the percentage of GFP+ cells in the sample analyzed as determined by flow cytometry (secondary y‐axis). For (B), the sorted lineage is indicated and the time point (days after transplantation) are indicated in parentheses. Abbreviation: GFP, green fluorescent protein.
Figure 6
Figure 6
Differential gene expression in CD34+ cells unexpanded or expanded with cytokines or expanded with cytokines and ECs. Hierarchical clustering and transcriptional analysis of EC‐expanded CD34+ cells and cytokine‐expanded CD34+ cells from three donors (A11224, R11145, Z13018) and from unexpanded CD34+ cells (two donors). Heat maps display the relative abundance of genes that were differentially expressed across the three cell populations (unexpanded CD34+ cells, cytokine‐expanded CD34+ cells, and EC‐expanded CD34+ cells). EC‐expanded CD34+ cells were EC depleted and enriched for CD34+ cells before analysis. All other subsets were sorted according to expression of CD34 before analysis. Scaling is relative to the maximum FPKM for each gene across all samples. (For example, if the unexpanded CD34+ cells had the greatest mRNA abundance for a particular gene, all other values would be relative to the level in unexpanded CD34+ cells.) The numbers within parentheses next to each gene name provide that value of the maximum FPKM from all samples. All genes shown in this heat map are differentially expressed. The color scale to the left of the heat map is scaled to the FPKM values to the maximum. The genes are ordered according to the p value (from top to bottom, smallest to largest). For all genes shown, the following criterion was applied: FPKM cutoff of 20 (p ≤ .05, log twofold change). Abbreviations: ECs, endothelial cells; FPKM, fragments per kilobase of exon per million reads mapped; Max, maximum.

Similar articles

Cited by

References

    1. Anguita‐Compagnon AT, Dibarrart MT, Palma J et al. Mobilization and collection of peripheral blood stem cells: Guidelines for blood volume to process, based on CD34‐positive blood cell count in adults and children. Transplant Proc 2010;42:339–344. - PubMed
    1. Petrecca K, Atanasiu R, Akhavan A et al. N‐linked glycosylation sites determine HERG channel surface membrane expression. J Physiol 1999;515:41–48. - PMC - PubMed
    1. Perseghin P, Terruzzi E, Dassi M et al. Management of poor peripheral blood stem cell mobilization: Incidence, predictive factors, alternative strategies and outcome. A retrospective analysis on 2177 patients from three major Italian institutions. Transfus Apheresis Sci 2009;41:33–37. - PubMed
    1. Sun CL, Francisco L, Kawashima T et al. Prevalence and predictors of chronic health conditions after hematopoietic cell transplantation: A report from the Bone Marrow Transplant Survivor Study. Blood 2010;116:3129–3139; quiz 3377. - PMC - PubMed
    1. Delaney C, Heimfeld S, Brashem‐Stein C et al. Notch‐mediated expansion of human cord blood progenitor cells capable of rapid myeloid reconstitution. Nat Med 2010;16:232–236. - PMC - PubMed

Publication types