. 2017 Mar 14;112(5):921-932.
doi: 10.1016/j.bpj.2017.01.024.

Glycan Determinants of Heparin-Tau Interaction

Affiliations

Glycan Determinants of Heparin-Tau Interaction

Jing Zhao et al. Biophys J. .

Abstract

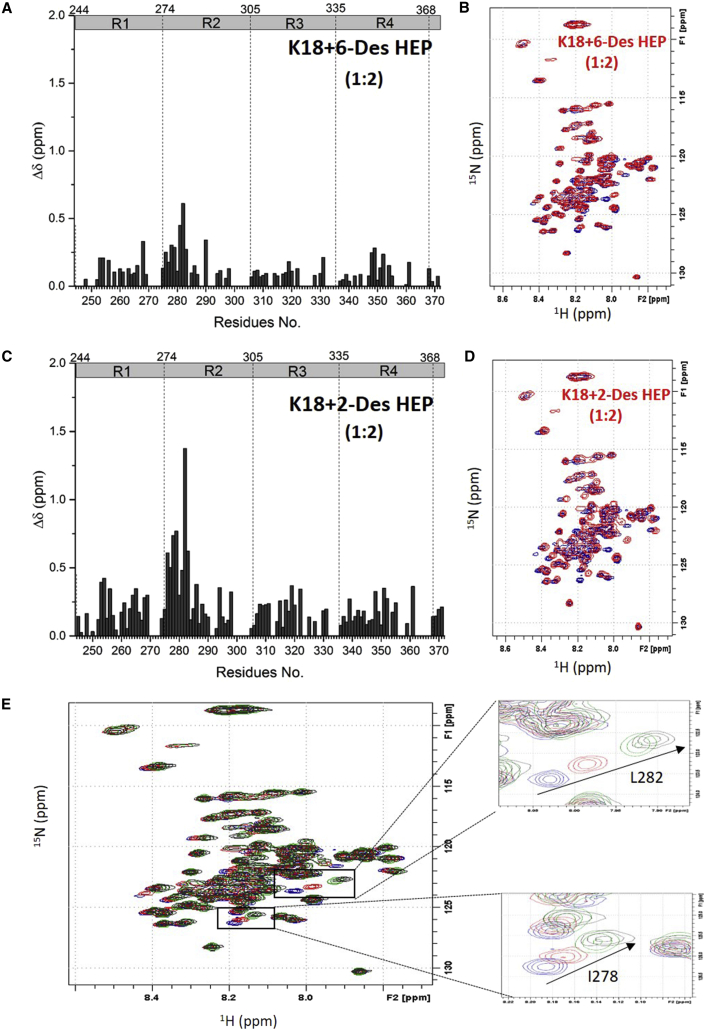
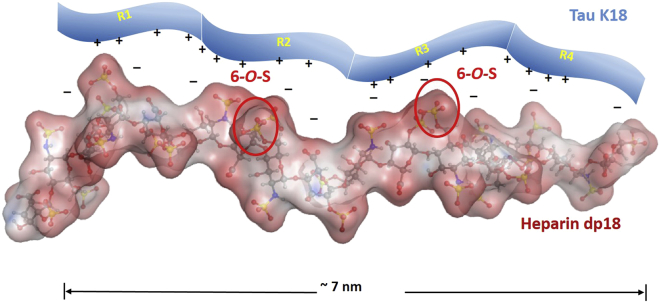
Tau aggregates into paired helical filaments within neurons, a pathological hallmark of Alzheimer's disease. Heparin promotes tau aggregation and recently has been shown to be involved in the cellular uptake of tau aggregates. Although the tau-heparin interaction has been extensively studied, little is known about the glycan determinants of this interaction. Here, we used surface plasmon resonance (SPR) and NMR spectroscopy to characterize the interaction between two tau fragments, K18 and K19, and several polysaccharides, including heparin, heparin oligosaccharides, chemically modified heparin, and related glycans. Using a heparin-immobilized chip, SPR revealed that tau K18 and K19 bind heparin with a KD of 0.2 and 70 μM, respectively. In SPR competition experiments, N-desulfation and 2-O-desulfation had no effect on heparin binding to K18, whereas 6-O-desulfation severely reduced binding, suggesting a critical role for 6-O-sulfation in the tau-heparin interaction. The tau-heparin interaction became stronger with longer-chain heparin oligosaccharides. As expected for an electrostatics-driven interaction, a moderate amount of salt (0.3 M NaCl) abolished binding. NMR showed the largest chemical-shift perturbation (CSP) in R2 in tau K18, which was absent in K19, revealing differential binding sites in K18 and K19 to heparin. Dermatan sulfate binding produced minimal CSP, whereas dermatan disulfate, with the additional 6-O-sulfo group, induced much larger CSP. 2-O-desulfated heparin induced much larger CSP in K18 than 6-O-desulfated heparin. Our data demonstrate a crucial role for the 6-O-sulfo group in the tau-heparin interaction, which to our knowledge has not been reported before.


Figures

Figure 1
Figure 1
Tau constructs and GAGs used in this study. (A) Tau K18 and K19. The C-terminal half of tau 441, which is the longest tau isoform in the human central nervous system, contains four repeats (R1–R4, orange shade). The constructs K18 and K19 comprise four repeats and three repeats, respectively. The residue numbering is based on the numbering of tau 441. (B) Chemical structures of heparin, heparin-derived oligosaccharides, chemically modified heparin, and other GAGs. To see this figure in color, go online.
Figure 2
Figure 2
SPR shows that tau K18 binds heparin with higher affinity than K19. (A) SPR sensorgrams and binding affinity of the tau K18-heparin interaction. The concentrations of the protein (from top to bottom) were 2.0, 1.0, 0.5, 0.25, and 0.125 μM, respectively. (B) SPR sensorgrams and binding affinity of the tau K19-heparin interaction. The concentrations of the protein (from top to bottom) were 32, 16, 8, 4, and 2 μM, respectively. The black curves are the fit curves using models from BIAevaluation 4.0.1. To see this figure in color, go online.
Figure 3
Figure 3
SPR competition indicates the importance of 6-O-sulfation. The normalized SPR signal of tau K18-heparin binding is shown in the presence of different chemically modified samples of heparin and DS in solution. The tau K18 concentration was 0.5 μM and the concentration of the modified heparin/DS in solution was 1 μM. All bar graphs are based on triplicate experiments.
Figure 4
Figure 4
Tau K18/K19 binding to various GAGs characterized by SPR competition. The best competitor in the SPR competition assay, CSE, also contains 6-O-sulfate. (A) Bar graphs of the normalized SPR signal of tau K18 binding to surface heparin in the presence of different GAGs in solution. The tau K18 concentration was 0.5 μM and the concentration of the GAGs in solution was 1 μM. (B) Bar graphs of the normalized SPR signal of tau K19 binding to surface heparin in the presence of different GAGs in solution. The tau K19 concentration was 16 μM and the concentration of the GAGs in solution was 1 μM. All bar graphs are based on triplicate experiments.
Figure 5
Figure 5
Glycan chain-length dependence of the tau-heparin interaction. (A) Bar graphs of the normalized signal of tau K18 binding to immobilized heparin in the presence of different chain lengths of heparin-oligosaccharides in solution. The tau K18 concentration was 0.5 μM and the concentration of the heparin oligosaccharides in solution was 1 μM. (B) Bar graphs of the normalized SPR signal of tau K19 binding to immobilized heparin in the presence of different chain lengths of heparin-oligosaccharides in solution. The tau K19 concentration was 16 μM and the concentration of the heparin oligosaccharides in solution was 1 μM. All bar graphs are based on triplicate experiments.
Figure 6
Figure 6
Salt dependence of the tau-heparin interaction. (A) Binding of tau K18 to heparin at various NaCl concentrations. (B) Binding of tau K19 to heparin at various NaCl concentrations. The tau K18 concentration was 0.5 μM and the tau K19 concentration was 16 μM. All bar graphs are based on triplicate experiments. To see this figure in color, go online.
Figure 7
Figure 7
NMR titration of tau K18/K19 with heparin. (A) Bar graph of 1H-15N residue CSPs of tau K18 (0.1 mM) titrated with 0.03 mM heparin (black bars) and 0.1 mM heparin (red bars). (B) Overlay of the 1H-15N HSQC spectrum of 0.1 mM tau K18, apo (blue), and with 0.1 mM heparin (red). (C) Bar graph of 1H-15N CSPs of tau K19 (0.1 mM) titrated with 0.1 mM heparin (black bars) and 0.3 mM heparin (red bars). (D) Overlay of the 1H-15N HSQC spectrum of 0.1 mM tau K19, apo (blue), and in the presence of 0.3 mM heparin (red). (E) Zoom-in of (A) in the R2 region of tau K18 (0.1 mM) titrated with 0.03 mM heparin (black bars) and 0.1 mM heparin (red bars). (F) Peak movement in HSQC for the two residues with the largest CSP, I278, and L282, in the R2 domain of tau K18 (0.1 mM) titrated with 0.03 mM heparin (black) and 0.1 mM heparin (red). To see this figure in color, go online.
Figure 8
Figure 8
NMR titration of tau K18 with 6-Des HEP and 2-Des HEP. (A) CSP of tau K18 (0.1 mM) titrated with 0.2 mM 6-Des HEP. (B) Overlay of the 1H-15N HSQC spectrum of 0.1 mM tau K18, apo (blue), and in the presence of 0.2 mM 6-Des HEP (red). (C) Bar graph of 1H-15N CSP of tau K18 (0.1 mM) titrated with 0.2 mM 2-Des HEP. (D) Overlay of the 1H-15N HSQC spectrum of 0.1 mM apo tau K18 (blue) and K18 with 0.2 mM 2-Des HEP (red). (E) Overlay of the 1H-15N HSQC spectrum of 0.1 mM tau K18 (blue) titrated with 0.2 mM 6-Des HEP (red), 0.2 mM 2-Des HEP (green), and 0.2 mM heparin (black). To see this figure in color, go online.
Figure 9
Figure 9
NMR titration of tau K18 with DS/Dis-DS. (A) CSP of tau K18 (0.1 mM) titrated with 0.1 mM DS. (B) Overlay of the 1H-15N HSQC spectrum of 0.1 mM tau K18, apo (blue) and in the presence of 0.1 mM DS (red). (C) Bar graph of the 1H-15N residue chemical shifts of tau K18 (0.1 mM) titrated with 0.1 mM Dis-DS. (D) Overlay of the 1H-15N HSQC spectrum of 0.1 mM apo tau K18 (blue) and K18 with 0.1 mM Dis-DS (red). (E) Overlay of the 1H-15N HSQC spectrum of 0.1 mM tau K18 (blue) titrated with 0.1 mM DS (black), 0.1 mM Dis-DS (red), and 0.1 mM heparin (green) in sequence, showing increasing binding affinity from DS to Dis-DS to heparin. To see this figure in color, go online.
Figure 10
Figure 10
Model of tau binding to heparin. The heparin dp18 conformation is based on PDB structure 3irj, with two 6-O-sulfo groups highlighted. To see this figure in color, go online.

References

    1. Weingarten M.D., Lockwood A.H., Kirschner M.W. A protein factor essential for microtubule assembly. Proc. Natl. Acad. Sci. USA. 1975;72:1858–1862. - PMC - PubMed
    1. Schoenfeld T.A., Obar R.A. Diverse distribution and function of fibrous microtubule-associated proteins in the nervous system. Int. Rev. Cytol. 1994;151:67–137. - PubMed
    1. Trojanowski J.Q., Lee V.M. Pathological tau: a loss of normal function or a gain in toxicity? Nat. Neurosci. 2005;8:1136–1137. - PubMed
    1. Iqbal K., Alonso Adel. C., Grundke-Iqba I. Alzheimer neurofibrillary degeneration: therapeutic targets and high-throughput assays. J. Mol. Neurosci. 2003;20:425–429. - PubMed
    1. Mandelkow E.M., Mandelkow E. Biochemistry and cell biology of tau protein in neurofibrillary degeneration. Cold Spring Harb. Perspect. Med. 2012;2:a006247. - PMC - PubMed