. 2017 Mar 14;18(11):2622-2634.
doi: 10.1016/j.celrep.2017.02.059.

m6A RNA Methylation Regulates the Self-Renewal and Tumorigenesis of Glioblastoma Stem Cells

Affiliations

m6A RNA Methylation Regulates the Self-Renewal and Tumorigenesis of Glioblastoma Stem Cells

Qi Cui et al. Cell Rep. .

Abstract

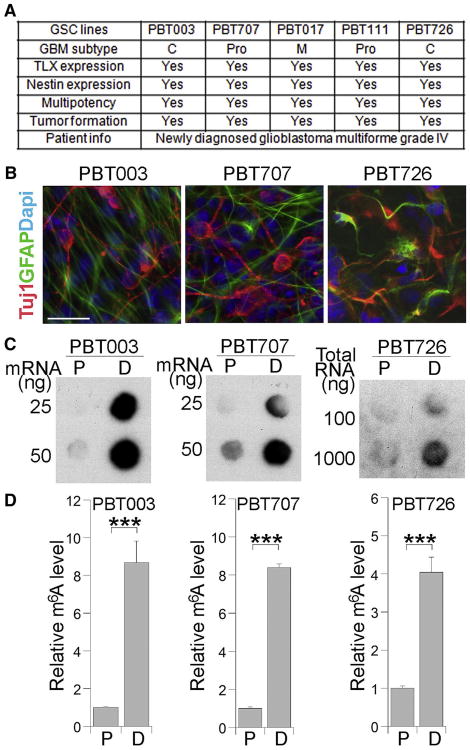
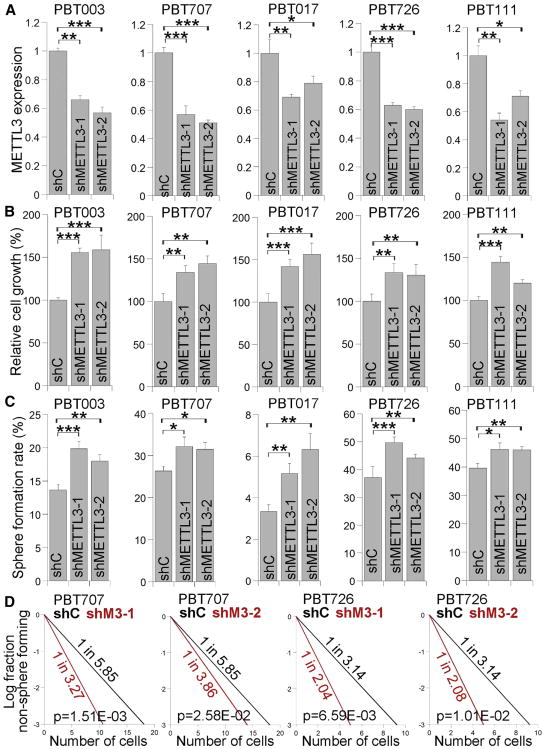
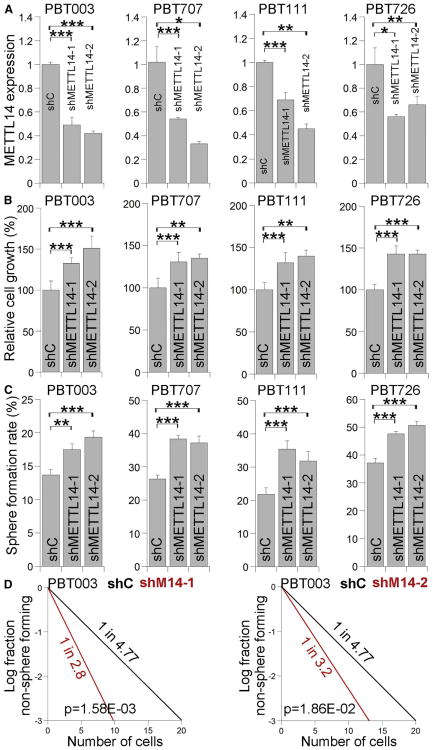
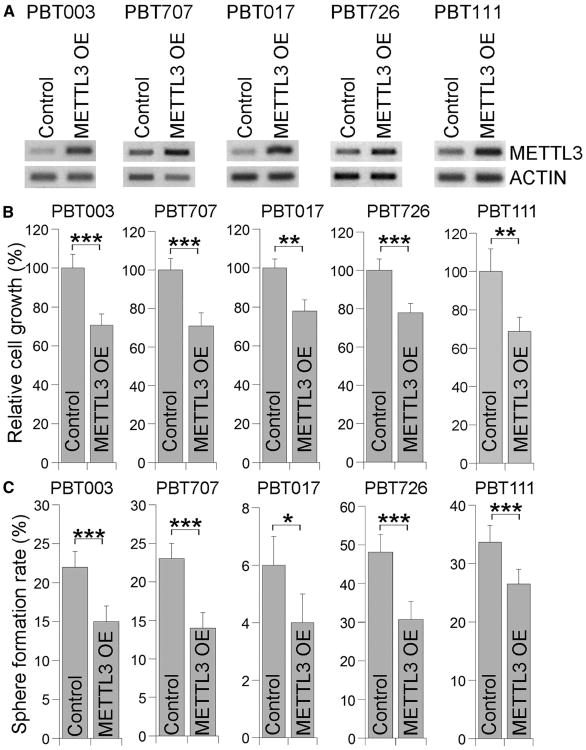
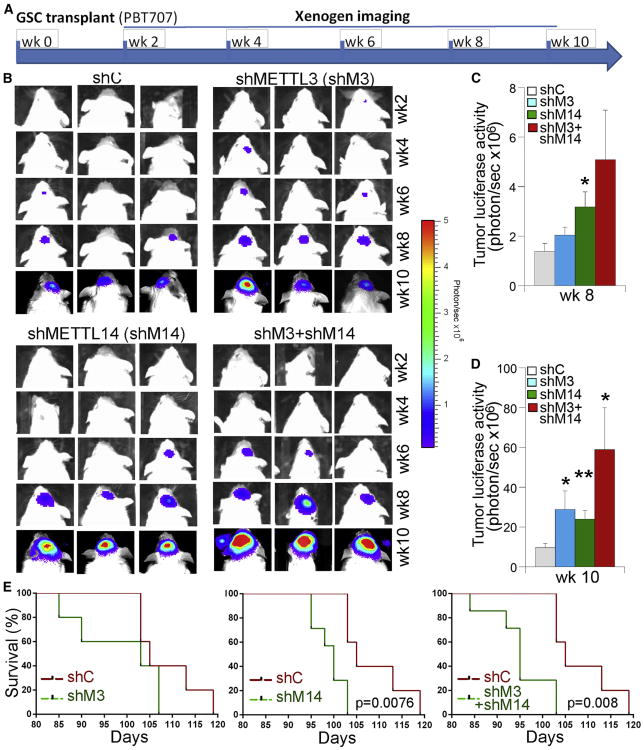
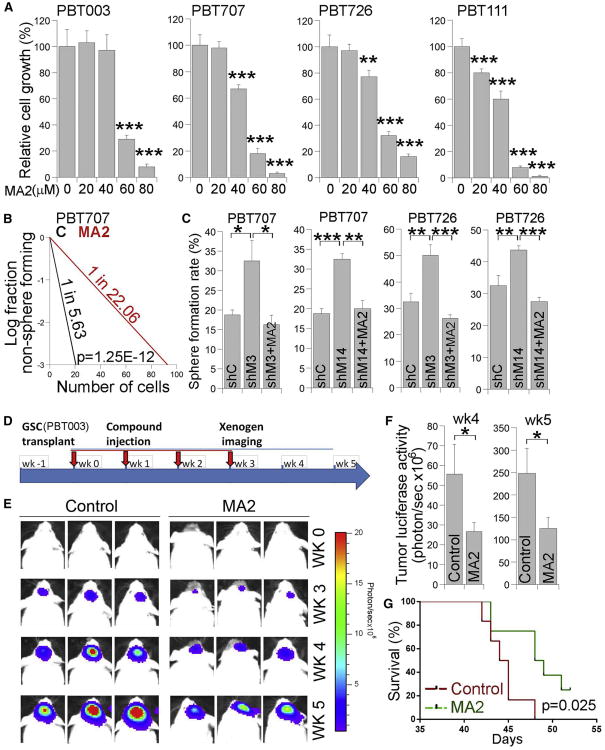
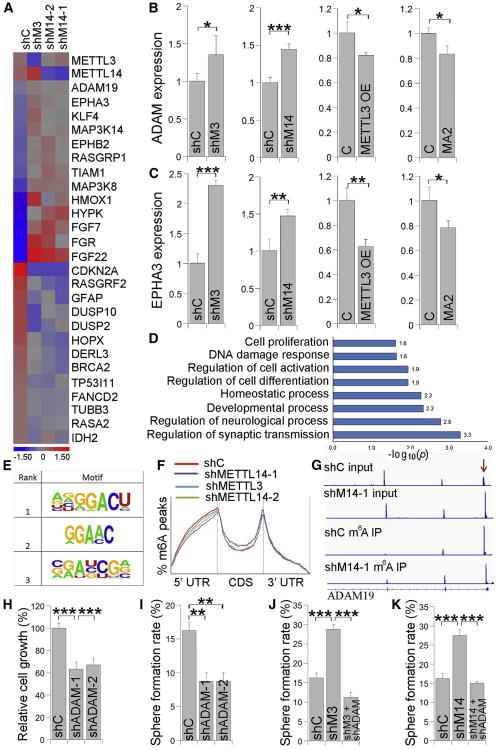
RNA modifications play critical roles in important biological processes. However, the functions of N6-methyladenosine (m6A) mRNA modification in cancer biology and cancer stem cells remain largely unknown. Here, we show that m6A mRNA modification is critical for glioblastoma stem cell (GSC) self-renewal and tumorigenesis. Knockdown of METTL3 or METTL14, key components of the RNA methyltransferase complex, dramatically promotes human GSC growth, self-renewal, and tumorigenesis. In contrast, overexpression of METTL3 or inhibition of the RNA demethylase FTO suppresses GSC growth and self-renewal. Moreover, inhibition of FTO suppresses tumor progression and prolongs lifespan of GSC-grafted mice substantially. m6A sequencing reveals that knockdown of METTL3 or METTL14 induced changes in mRNA m6A enrichment and altered mRNA expression of genes (e.g., ADAM19) with critical biological functions in GSCs. In summary, this study identifies the m6A mRNA methylation machinery as promising therapeutic targets for glioblastoma.

Keywords: FTO inhibitor; METTL14; METTL3; glioblastoma stem cells; m(6)A modification.


Figures

Figure 1
Figure 1. Differentiation of GSCs Induces Elevated Levels of m6A RNA Modification
(A) A list of GSC lines used in this study. The characterization of these GSCs, including glioblastoma (GBM) subtype, marker (TLX and nestin) expression, multipotency, and tumor-formation capacity, is summarized in the table. (B) Differentiation of GSCs into Tuj1-positive neurons (red) and GFAP-positive astrocytes (green) by treating cells with FBS together with retinoic acid. Scale bar, 25 μm. (C) RNA dot blot analysis of m6A levels in proliferating (P) GSCs and differentiated (D) cells. (D) Quantification of m6A level measured by RNA dot blot shown in (C). n = 4. ***p < 0.001 by Student's t test. Error bars represent SD of the mean.
Figure 2
Figure 2. Knocking Down METTL3 Expression Promotes the Growth and Self-Renewal of GSCs
(A) RT-PCR analysis of METTL3 expression in GSCs transduced with lentivirus expressing control shRNA (shC) or METTL3 shRNAs (shMETTL3-1, shMETTL3-2). n = 3. See also Figure S1. (B–D) Cell growth (B), sphere-formation (C), and limiting dilution assay (LDA) (D) of GSCs transduced with lentivirus expressing control shRNA or METTL3 shRNAs. A sphere-formation assay and LDA were used to evaluate the self-renewal capacity of GSCs. n = 4 for (B), n = 6 for (C), and n = 20 for (D). *p < 0.05, **p < 0.01, and ***p < 0.001 by Student's t test. Error bars represent SD of the mean.
Figure 3
Figure 3. Knocking Down METTL14 Expression Enhances the Growth and Self-Renewal of GSCs
(A) RT-PCR analysis of METTL14 expression in GSCs transduced with lentivirus expressing control shRNA (shC) or METTL14 shRNAs (shMETTL14-1, shMETTL14-2). n = 3. See also Figure S1. (B–D) Cell growth (B), sphere-formation (C), and LDA (D) analyses of GSCs transduced with lentivirus expressing control shRNA or METTL14 shRNAs. n = 4 for (B), n = 6 for (C), and n = 20 for (D). *p < 0.05, **p < 0.01, ***p < 0.001 by Student's t test. Error bars represent SD of the mean.
Figure 4
Figure 4. Overexpressing METTL3 Inhibits the Growth and Self-Renewal of GSCs
(A) RT-PCR analysis showing overexpression of METTL3 in GSCs. (B and C) Cell growth (B) and sphere-formation (C) analyses of GSCs transduced with METTL3-expressing virus or control virus. n = 4 for (B) and n = 6 for (C). *p < 0.05, **p < 0.01, and ***p < 0.001 by Student's t test. Error bars represent SD of the mean. See also Figure S2.
Figure 5
Figure 5. Knocking Down METTL3 and/or METTL14 Expression Promotes the Tumorigenicity of GSCs
(A) Schematic of the experimental design, including GSC transplantation and xenogen imaging of xenografted tumors. (B) Xenogen images of brain tumors in NSG mice transplanted with PBT707 cells that were transduced with control shRNA (shC), METTL3 shRNA (shMETTL3), or METTL14 shRNA (shMETTL14). The scale bar for bioluminescence intensity is shown on the right. (C and D) Quantification of the bioluminescence intensity of tumors at 8 weeks (C) and 10 weeks (D) after tumor transplantation. *p < 0.05 and **p < 0.01 by Student's t test. Error bars represent SD of the mean. (E) The survival curves of NSG mice transplanted with PBT707 cells transduced with control shRNA (shC), METTL3 shRNA (shMETTL3), or METTL14 shRNA (shMETTL14). The x axis represents days after GSC transplantation. n = 7, log-rank test. See also Figures S3–S5.
Figure 6
Figure 6. Treatment with the FTO Inhibitor MA2 Reduces GSC-Initiated Tumor Growth
(A) Cell growth analyses of GSCs treated with the FTO inhibitor MA2. n = 4. (B) LDA analysis of GSCs treated with MA2 or vehicle control. n = 20. (C) Sphere-formation analysis of GSCs treated with control shRNA (shC) or METTL3 or METTL14 shRNA (shM3 or shM14) expressing virus alone or together with MA2. *p < 0.05, **p < 0.01, and ***p < 0.001 by Student's t test. Error bars represent SD of the mean. See also Figure S6. (D) Schematic of the experimental design, including GSC transplantation, MA2 treatment, and xenogen imaging of tumors derived from grafted GSCs. The transplanted mice were treated with the FTO inhibitor MA2 or vehicle control. (E) Xenogen images of brain tumors in GSC-grafted NSG mice treated with vehicle control (C) or MA2. The scale bar for bioluminescence intensity is shown on the right. (F) Quantification of the bioluminescence intensity of tumors. n = 10. *p < 0.05 by Student's t test. Error bars represent SD of the mean. (G) The survival curves of GSC-grafted NSG mice treated with MA2 or vehicle control. The x axis represents days after the first MA2 treatment. n = 8, log-rank test.
Figure 7
Figure 7. METTL3 or METTL14 KD Induces mRNA Expression and m6A Methylation Level Change in GSCs
A) Heatmap showing mRNA expression changes in PBT003 cells with METTL3 or METTL14 KD. shC, control shRNA; shM3, shRNA for METTL3; shM14-1 and shM14-2, shRNAs for METTL14. (B and C) RT-PCR of ADAM19 (ADAM) (B) and EPHA3 (C) expression in PBT003 cells with METTL3 or METTL14 KD, METTL3 overexpression (OE), or MA2 treatment. n = 3. See also Figure S7. (D) GO analysis of genes with expression change upon METTL3 or METTL14 KD in PBT003 cells. (E and F) The m6A motif (E) and peak distribution (F) in GSCs. (G) Change of the m6A methylation level in ADAM19 mRNA in PBT003 cells with METTL14 KD. The mRNA input in shC and shM14-1 cells is included in the top rows. mRNA pulled down by immunoprecipitation with an m6A antibody (m6A IP) is included in the bottom rows. (H and I) Cell growth (H) and sphere-formation (I) analyses of PBT003 cells transduced with lentivirus expressing shC or ADAM19 shRNAs (shADAM-1, shADAM-2). n = 4. (J and K) Sphere-formation assay of PBT003 cells transduced with lentivirus expressing METTL3 shRNA (J) or METTL14 shRNA (K) alone or together with ADAM19 shRNA (shADAM). n = 4. *p < 0.05, **p < 0.01, and ***p < 0.001 by Student's t test. Error bars represent SD of the mean. See also Figure S7.

References

    1. Allegra A, Alonci A, Penna G, Innao V, Gerace D, Rotondo F, Musolino C. The cancer stem cell hypothesis: a guide to potential molecular targets. Cancer Invest. 2014;32:470–495. - PubMed
    1. Anido J, Sáez-Borderías A, Gonzàlez-Juncà A, Rodón L, Folch G, Carmona MA, Prieto-Sánchez RM, Barba I, Martínez-Sáez E, Prudkin L, et al. TGF-β receptor inhibitors target the CD44(high)/Id1(high) glioma-initiating cell population in human glioblastoma. Cancer Cell. 2010;18:655–668. - PubMed
    1. Bao S, Wu Q, McLendon RE, Hao Y, Shi Q, Hjelmeland AB, Dewhirst MW, Bigner DD, Rich JN. Glioma stem cells promote radioresistance by preferential activation of the DNA damage response. Nature. 2006;444:756–760. - PubMed
    1. Batista PJ, Molinie B, Wang J, Qu K, Zhang J, Li L, Bouley DM, Lujan E, Haddad B, Daneshvar K, et al. m(6)A RNA modification controls cell fate transition in mammalian embryonic stem cells. Cell Stem Cell. 2014;15:707–719. - PMC - PubMed
    1. Bokar JA, Rath-Shambaugh ME, Ludwiczak R, Narayan P, Rottman F. Characterization and partial purification of mRNA N6-adenosine methyltransferase from HeLa cell nuclei. Internal mRNA methylation requires a multisubunit complex. J Biol Chem. 1994;269:17697–17704. - PubMed

MeSH terms