. 2017 Mar 23;543(7646):513-518.
doi: 10.1038/nature21417. Epub 2017 Mar 15.

Root microbiota drive direct integration of phosphate stress and immunity

Affiliations

Root microbiota drive direct integration of phosphate stress and immunity

Gabriel Castrillo et al. Nature. .

Abstract

Plants live in biogeochemically diverse soils with diverse microbiota. Plant organs associate intimately with a subset of these microbes, and the structure of the microbial community can be altered by soil nutrient content. Plant-associated microbes can compete with the plant and with each other for nutrients, but may also carry traits that increase the productivity of the plant. It is unknown how the plant immune system coordinates microbial recognition with nutritional cues during microbiome assembly. Here we establish that a genetic network controlling the phosphate stress response influences the structure of the root microbiome community, even under non-stress phosphate conditions. We define a molecular mechanism regulating coordination between nutrition and defence in the presence of a synthetic bacterial community. We further demonstrate that the master transcriptional regulators of phosphate stress response in Arabidopsis thaliana also directly repress defence, consistent with plant prioritization of nutritional stress over defence. Our work will further efforts to define and deploy useful microbes to enhance plant performance.


Figures
Extended Data Figure 1
Extended Data Figure 1. The Arabidopsis PSR alters highly specific bacterial taxa abundances
a, Alpha diversity of bacterial root microbiome in wild-type Col-0, PSR mutants and bulk soil samples. We used ANOVA methods and no statistical differences were detected between plant genotypes after controlling for experiment. b, Additive beta-diversity curves showing how many OTUs are found in bulk soil samples or root endophytic (EC) samples of the same genotype as more samples (pots) are added. The curves show the mean and the 95 % confidence interval calculated from 20 permutations. c, Phylum-level distributions of plant root endophytic communities from different plant genotypes and bulk soil samples. d, Principal Coordinates Analysis based on Bray-Curtis dissimilarity of root and bulk soil bacterial communities showing a large effect of experiment on variation, as expected according to previous studies. For a-d the number of biological replicates per genotype and soil are: Col-0 (n=17), pht1;1 (n=18), pht1;1 pht1;4 (n=17), phf1 (n=13), nla (n=16), pho2 (n=16), phr1 (n=18), spx1 spx2 (n=14) and Soil (n=17) e, Bacterial taxa that are differentially abundant (DA) between PSR mutants and Col-0. Each row represents a bacterial Family (left) or OTU (right) that shows a significant abundance difference between Col-0 and at least one mutant. The heat-map grey scale shows the mean abundance of the given taxa in the corresponding genotype, and significant enrichments and depletions with respect to Col-0 are indicated with a red or blue rectangle, respectively. Taxa are organized by phylum shown on the right bar colored according to f. f, Doughnut plot showing Family-level (top) and OTUs- level (bottom) differences in endophytic root microbiome compositions between mutants (columns) and Col-0 plants. The number inside each doughnut indicates how many bacterial Families are enriched or depleted in each mutant with respect to Col-0, and the colors in the doughnut show the phylum level distribution of those differential abundances. g, Tables of p-values from Monte Carlo pairwise comparisons between mutants. A significant p-value (cyan) indicates that two genotypes are more similar than expected by chance. Results of Family level comparison are shown. This plot should be compared with the corresponding OTU-level plot in Fig. 1d. h, Distributions of plant genotypic effects on taxonomic abundances at the Family (up) or OTU (down) level. For each genotype, the value of the linear model coefficients for individual OTUs or Families is plotted grouped by their sign. Positive values indicate that a given taxon has increased abundance in a mutant with respect to Col-0, while a negative value represents the inverse pattern. Only coefficients from significant comparisons are shown. The number of taxa (ie. points) on each box and whisker plots is indicated in the corresponding doughnut plot in f.
Extended Data Figure 2
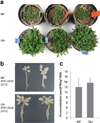
Extended Data Figure 2. Plants grown in Mason Farm wild soil or phosphate (Pi) replete potting soil do not induce PSR and accumulate the same amount of Pi
a, Plants overexpressing the PSR reporter construct IPS1:GUS grown in Mason Farm wild soil (MF) or in phosphate (Pi) replete potting soil (GH) (250 ppm of 20-20-20 Peters Professional Fertilizer). b, Expression analysis of the reporter constructs IPS1:GUS (n= 12) shows lack of induction of PSR for both soils analyzed. In this construct, the promoter region of IPS1, highly induced by low Pi, drives the expression of GUS. Plants were grown in the conditions described in a. The number of GUS positive plants relative to the total number of plants analyzed in each condition is shown in parenthesis. c, Phosphate (Pi) concentration in shoots (n= 6) of plants grown in both soils analyzed shows no differences. Plants were grown in a growth chamber in a 15-h light/9-h dark regime (21 °C day /18 °C night). Images shown here are representative of the 12 plants analyzed in each case. Bars mean standard deviation.
Extended Data Figure 3
Extended Data Figure 3. Phylogenetic composition of the 35-member synthetic community (SynCom)
Left: Comparison of taxonomic composition of soil (S), rhizosphere (R) and endophyte (EC) communities from , with the taxonomic composition of the isolate collection obtained from the same samples and the SynCom selected from within it and used in this work. Right: Maximum likelihood phylogenetic tree of the 35-member SynCom based on a concatenated alignment of 31 single copy core proteins.
Extended Data Figure 4
Extended Data Figure 4. Induction of the PSR triggered by the SynCom is mediated by PHR1 activity
a, Venn diagram with the overlap among genes found up-regulated during phosphate starvation in four different gene expression experiments , –. The intersection (193 genes) was used as a robust core set of PSR for the analysis of our transcriptional data (Supplementary Table 3). b, Expression profile of the 193 core PSR genes indicating that the SynCom triggers phosphate starvation under Low Pi conditions in a manner that depends on PHR1 activity. The RPKM expression values of these genes were z-score transformed and used to generate box and whiskers plots that show the distribution of the expression values of this gene set. Col-0, the single mutant phr1 and the double mutant phr1 phl1 were germinated at 1 mM Pi with sucrose and then transferred to low Pi (50 µM) and high Pi (625 µM Pi) alone or with the SynCom. The figure shows the average measurement of ten biological replicates for Col-0 and phr1 and six for phr1 phl1c, Percentage of genes per cluster (from figure 3) containing the PHR1 binding site (P1BS, GNATATNC) within 1000 bp of their promoters. The red line indicates the percentage of Arabidopsis genes in the whole genome that contain the analyzed feature. Asterisk denotes significant enrichment or depletion (p ≤ 0.05; hypergeometric test).
Extended Data Figure 5
Extended Data Figure 5. The SynCom induces PSR independently of sucrose in Arabidopsis
a, Expression analysis of a core of 193 PSR marker genes in an RNA-seq experiment using Col-0 plants. The RPKM expression values of these genes were z-score transformed and used to generate box and whiskers plots that show the distribution of the expression values of this gene set. Plants were grown in Johnson medium containing replete [1 mM Pi; (+Pi)] or stress [5 µM Pi; (−Pi)] Pi concentrations with (+Suc) or without (−Suc) 1 % sucrose. b, Expression analysis of the reporter constructs IPS1:GUS (n=20). In this construct, the promoter region of IPS1, highly induced by low Pi, drives the expression of GUS. Plants were grown in Johnson medium +Pi or -Pi at different percentages of sucrose. These results show that sucrose is required for the induction of the PSR in typical sterile conditions. Images shown are representative of the 20 plants analyzed in each case c, Top: Plants grown in sterile conditions at different Pi concentrations [left (No Bacteria)] or with a SynCom [right (+SynCom)]. Bottom: Histochemical analysis of Beta-glucoronidase (GUS) activity in overexpressing IPS1:GUS plants (n=20) from top panel. Images shown are representative of the 20 plants analyzed in each case. d, Pi concentration in plant shoots from c , in all cases n=5. Analysis of Variance indicated a significant effect of the Pi level in the media (F = 44.12, df = 1, p-value = 9.72e-8), the presence of SynCom (F = 32.61, df = 1, p-value = 1.69e-6) and a significant interaction between those two terms (F = 4.748, df = 1, p-value = 0.036) on Pi accumulation. e, Top: Plants grown in axenic conditions (No Bacteria), with a concentration gradient of heat-killed SynCom [2 h at 95 °C, (+Heat killed SynCom)] or with SynCom alive. Bottom: Histochemical analysis of GUS activity in overexpressing IPS1:GUS plants (n=15) from top panel. All plants were grown at 50 µM Pi. Images shown are representative of the 15 plants analyzed in each case f, Quantification of Pi concentration in plant shoots from e, (in call cases n=5). The SynCom effect on Pi concentration requires live bacteria. Plants were germinated on Johnson medium containing 0.5 % sucrose, with 1 mM Pi for 7 d in a vertical position, then transferred to 0, 10, 30, 50, 625 µM Pi media (without sucrose) alone or with the Synthetic Community at 105 c.f.u/mL (only for the conditions 0, 50 and 625 µM Pi), for another 12 d. For the heat-killed SynCom experiments, plants were grown as above. Heat-killed SynComs were obtained by heating different concentrations of bacteria 105 c.f.u / mL, 106 c.f.u / mL and 107 c.f.u / mL at 95 °C for 2 h in an oven. The whole content of the heat-killed SynCom solutions were add to the media. In all cases, addition of the SynCom did not change significantly the final Pi concentration or the pH in the media. Letters indicates grouping based on ANOVA and Tukey post-hoc test at 95 % confidence, conditions with the same letter are statistically indistinguishable.
Extended Data Figure 6
Extended Data Figure 6. Bacteria induce the PSR using the canonical pathway in Arabidopsis
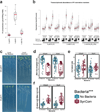
a, Pi concentration in the shoot of Col-0 plants germinated in three different conditions, 5 µM Pi (−Pi) (n=14), 1 mM Pi (+Pi) (n=15) and 1 mM KH2PO3 (Phi) (n=15) for 7 days. Phi is a non-metabolizable analog of Pi; its accumulation delays the response to phosphate stress. b, Expression profile analysis of a core of PSR-marker genes in Col-0, phf1 and phr1 phl1. The RPKM expression values of these genes were z-score transformed and used to generate box and whiskers plots that show the distribution of the expression values of this gene set. Plants were germinated in three different conditions, 5 µM Pi (−Pi), 1 mM Pi (+Pi) and 1 mM KH2PO3 (Phi) and then transferred to low Pi (50 µM Pi) and high Pi (625 µM Pi) alone or with the SynCom for another 12 d. The figure shows the average measurement of four biological replicates. c, Phenotype of plants grown in axenic conditions at 625 µM Pi (Top) or at 50 µM Pi (Bottom) [left (No Bacteria)] or with a SynCom [right (+SynCom)]. Images showed here are representative of the total number of plants analyzed in each case as noted below d, Quantification of the main root elongation, e, Number of lateral roots per plant, and f, Number of lateral roots per cm of main root in plants from c. For d, e and f the number of biological replicates are: 625 uM No Bacteria (n=48), 625 uM + SynCom (n=46), 50 uM No Bacteria (n=73), and 50 uM SynCom (n=56), distributed across two independent experiments indicated with different shades of color. Measurements were analyzed with ANOVA while controlling for biological replicate. Asterisks denote a significant effect (p-value < 1e-16) of treatment with SynCom for the three phenotypes in d, e and f. In all cases, neither the interaction between Pi and Bacteria, nor Pi concentrations alone had a significant effect and were dropped from the ANOVA model. In all cases, residual quantiles from the ANOVA model were compared with residuals from a Normal distribution to confirm that the assumptions made by ANOVA hold (see code on GitHub for details, see Methods).
Extended Data Figure 7
Extended Data Figure 7. Plant genotype and Pi concentration alter SynCom strain abundances
a, Number of bacterial reads in samples of different types (left) and number of reads after blank normalization (right, see Methods). The number of biological replicates are: Inoculum (n=8), Agar + SynCom (n=41), Agar No Bacteria (n=2), Root + SynCom (n=36), Root No Bacteria (n=6) and Blank (n = 3), across two independent experiments b, Richness (number of isolates detected) in SynCom samples. No differences were observed between plant genotypes. The number of biological replicates per group is n=12 except for Inoculum (n=4) and phf1 (n=11) c, Exemplary SynCom strains that show quantitative abundance differences between genotypes. Genotypes with the same letter are statistically indistinguishable. d, Exemplary SynCom strains that show quantitative abundance differences depending on Pi concentration in the media. Asterisks note statistically significant differences between the two Pi concentrations. e, CAP analysis of Agar vs Root difference in SynCom communities. These differences explained 9.1 % of the variance. The number of biological replicates per fraction is: Agar (n=12) and Root (n=35), distributed across two independent experiments f, Exemplary SynCom strain that shows a statistically significant differential abundance between Root and Agar samples. Statistically significant differences are defined as FDR < 0.05. For c, d and f the number of biological replicates for every combination of genotype and Pi level is always n=6, evenly distributed across two independent experiments.
Extended Data Figure 8
Extended Data Figure 8. PHR1 controls the balance between the SA and JA regulons during the PSR induced by a 35-member SynCom
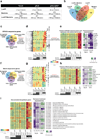
a, Total number of differentially expressed genes (FDR ≤ 0.01 and minimum of 1.5X fold-change) in Col-0, phr1 and phr1 phl1 with respect to Low Pi (50 µM Pi), bacteria presence and the interaction between low Pi and bacteria. In this experiment, plants were grown for 7 days in Johnson medium containing 1 mM Pi, and then transferred for 12 days to low (50 µM Pi) and high Pi (625 µM Pi) conditions alone or with the SynCom. No sucrose was added to the medium. b, Venn diagram showing the overlap between the PSR marker genes (Core Pi) and the genes that were up-regulated in Col-0 by each of the three variables analyzed. The combination of bacteria and low Pi induced the majority (85 %) of the marker genes. c, PHR1 negatively regulates the expression of a set of SA-responsive genes during co-cultivation with the SynCom. Venn diagram showing the overlap among PSR-SynCom DEGs, genes up-regulated by BTH treatment of Arabidopsis seedlings, and the direct targets of PHR1 identified by ChIP-seq. The red ellipse indicates the 468 BTH/SA-responsive genes that were differentially expressed. A total of 99 of these genes (21 %) are likely direct targets of PHR1. The yellow ellipse indicates 272 SA-responsive genes that were bound by PHR1 in a ChIP-seq experiment (see Fig. 3e). Approximately one-third of them (99/272) were differentially expressed in the SynCom experiment. d, Hierarchical clustering analysis showed that nearly half of the BTH/SA-induced genes that were differentially expressed in our experiment are more expressed in phr1 or phr1 phl1 mutants compared to Col-0 (dashed box). The columns on the right indicate those genes that belong to the core PSR marker genes (‘core’ lane) or that contain a PHR1 ChIP-seq peak (‘ChIP-seq’ lane). A subset of the SA marker genes is less expressed in the mutant lines (thin dashed box). This set of genes is also enriched in the core PSR markers and in PHR1 direct targets (p<0.001; hypergeometric test), indicating that PHR1 can function as a positive activator of a subset of SA-responsive genes. Importantly, these genes are not typical components of the plant immune system but rather encode proteins that play a role in the physiological response to low phosphate availability (e.g., phosphatases and transporters). e, Examples of typical SA-responsive genes are shown on the right along with their expression profiles in response to MeJA or BTH/SA treatment compared to Col-0. f, PHR1 activity is required for the activation of JA-responsive genes during co-cultivation with the SynCom. Venn diagram showing the overlap among DEG from this work (PSR-SynCom), genes up-regulated by MeJA treatment of Arabidopsis seedlings and the genes bound by PHR1 in a ChIP-seq analysis. Red ellipse indicates 165 JA-responsive genes that were differentially expressed. Thirty-one of these (19 %) were defined as direct targets of PHR1. The yellow ellipse indicates 96 JA-responsive genes that were bound by PHR1 in a ChIP-seq experiment. Approximately one-third of them (31/96) were differentially expressed in the SynCom experiment. g, Hierarchical clustering analysis showed that almost 75 % of the JA-induced genes that were differentially expressed in our experiment are less expressed in the phr1 mutants (dashed box). The columns on the right indicate those genes that belong to the core PSR marker genes (‘core’ lane) or that contain a PHR1 ChIP-seq peak (‘ChIP-seq’ lane). h, Examples of well-characterized JA-responsive genes are shown on the right along with their expression profiles in response to BTH and MeJA treatments obtained in an independent experiment. i, Heatmap showing the expression profile of the 18 genes that were differentially expressed in our experiment and participate in the biosynthesis of glucosinolates. In general, these genes showed lower expression in the phr1 mutants indicating that PHR1 activity is required for the activation of a sub-set of JA-responsive genes that mediate glucosinolate biosynthesis. The transcriptional response to BTH/SA and MeJA treatments is shown on the right and was determined in an independent experiment in which Arabidopsis seedlings were sprayed with either hormone. MeJA induces the expression of these glucosinolate biosynthetic genes, whereas BTH represses many of them. The gene IDs and the enzymatic activity of the encoded proteins are shown on the right. Results presented in this figure are based on ten biological replicates for Col-0 and phr1 and six for phr1 phl1. The color key (blue to red) related to d, e, g, h, i represents gene expression as Z-scores and the color key (green to purple) related to e, h, i represents gene expression as log2 fold-changes.
Extended Data Figure 9
Extended Data Figure 9. PHR1 activity effects on flg22 and MeJA-induced transcriptional responses
a, Total number of differentially expressed genes (FDR ≤ 0.01 and minimum of 1.5X fold-change) in Col-0 and phr1 phl1 with respect to low Pi (50 µM Pi), flg22 treatment (1 µM) and MeJA (10 µM). In this experiment, plants were grown for 7 days in Johnson medium containing 1 mM Pi, and then transferred for 12 days to low (50 µM Pi) and high Pi (625 µM Pi) conditions alone, or in combination with each treatment. Sucrose was added to the medium at a final concentration of 1 %. b, Venn diagram showing the overlap among genes that were up-regulated by chronic exposure to flg22 in Col-0 and in phr1 phl1 and a literature-based set of genes that were up-regulated by acute exposure (between 8 to 180 min) to flg22. The red ellipse indicates the 251 chronic flg22-responsive genes defined here. c, Venn diagram showing the overlap among genes that were up-regulated by chronic exposure to MeJA in Col-0 and in phr1 phl1 in this work and a set of genes that were up-regulated by MeJA treatment of Arabidopsis seedlings (between 1 and 8 hours). The red ellipse indicates the intersection of JA-responsive genes identified in both experiments. d, Col-0 and phr1 phl1 exhibit similar transcriptional activation of 426 common JA-marker genes (c) independent of phosphate concentration. As a control we used coi1-16, a mutant impaired in the perception of JA. The gene expression results are based on six biological replicates per condition. e, Growth inhibition of primary roots by MeJA. Root length of wild-type Col-0 (n= 125 (+ Pi - MeJA), 120 (+ Pi + MeJA), 126 (− Pi - MeJA), 125 (− Pi + MeJA)), phr1 phl1 (n=85, 103, 90, 80) and the JA perception mutant coi1-16 (n= 125, 120, 124, 119) was measured after 4 days of growth in the presence or not of MeJA with or without 1 mM Pi. Letters indicate grouping based on multiple comparisons from a Tukey post-hoc test at 95 % confidence. In agreement with the RNA-seq results, no difference in root length inhibition was observed between Col-0 and phr1 phl1.
Extended Data Figure 10
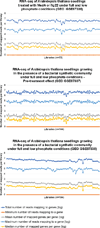
Extended Data Figure 10. Number of mapped reads for each RNA-seq library used in this study
The figure shows the maximum, minimum, average and median number of reads mapping per gene for all RNA-seq libraries generated. The total number of reads mapping to genes is also shown for each library. With the exception of the minimum number of mapped reads, which is zero for all libraries, all values are shown in a log scale.
Figure 1
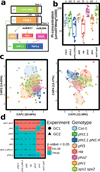
Figure 1. Phosphate Stress Response (PSR) mutants assemble an altered root microbiota
a, Diagram of PSR regulation in Arabidopsis. Red and blue stripes indicate whether these mutants hyper- or hypo-accumulate Pi, respectively, in axenic, Pi replete conditions. The master PSR regulator PHR1 is a Myb-CC family transcription factor bound under phosphate replete conditions by the negative regulators SPX1 and SPX2 in the nucleus. During PSR, PHR1 is released from SPX and regulates genes whose products include high-affinity phosphate transporters (PHT1;1 and PHT1;4). Transporter accumulation at the plasma membrane is controlled by PHF1, while PHO2 and NLA mediate PHT1 degradation, b, Phosphate (Pi) concentration in shoots of plant genotypes (grown in growth chambers, 16-h dark/8-h light regime, 21°C day 18°C night for 7 weeks) in a natural soil. Statistical significance was determined by ANOVA while controlling for experiment (indicated by point shape); genotype grouping is based on a post-hoc Tukey test, and is indicated by letters at the top; genotypes with the same letter are indistinguishable at 95% confidence. Biological replicate numbers are: Col-0 (n=12), pht1:1 (n=13), pht1;1 pht1;4 (n=14), phf1 (n=9), nla (n=13), pho2 (n=11), phr1 (n=14) and spx1 spx2 (n=11) distributed across two independent experiments. c, Constrained ordination of root microbiome composition showing the effect of plant genotype: phr1 separates on the first two axes, spx1 spx2 on the third axis and phf1 on the fourth axis. Ellipses show the parametric smallest area around the mean that contains 50% of the probability mass for each genotype. Biological replicate numbers are: Col-0 (n=17), pht1:1 (n=18), pht1;1 pht1;4 (n=17), phf1 (n=13), nla (n=16), pho2 (n=16), phr1 (n=18) and spx1 spx2 (n=14) distributed across two independent experiments d, Table of p-values from Monte Carlo pairwise comparisons between mutants at the OTU level. A significant p-value (cyan) indicates that two genotypes are more similar than expected by chance.
Figure 2
Figure 2. A bacterial Synthetic Community (SynCom) differentially colonizes PSR mutants
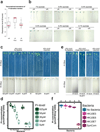
a, Pi concentration in shoots of plants grown on different Pi regimens with or without the SynCom. Plants were germinated on Johnson medium containing 0.5 % sucrose, supplemented with 1 mM Pi for 7 d in a vertical position, then transferred to 50 µM Pi or 625 µM Pi media (without sucrose) alone or with the SynCom at 105 c.f.u/mL, for another 12 d. Biological replicates numbers are: Col-0 (n=16 (625 µM Pi), 24 (625 µM Pi + SynCom), 12 (50 µM Pi), 24 (50 µM Pi + SynCom)), phf1 (n=16, 18, 12, 24) and phr1 phl1 (n=16, 18, 12, 24) from three independent experiments. Statistical significance was determined via ANOVA while controlling for experiment, and the letters indicate the results of a post-hoc Tukey test. Groups of samples that share at least one letter are statistically indistinguishable. b, Expression levels of 193 core PSR genes. The RPKM expression values of these genes were z-score transformed and used to generate box and whiskers plots that show the distribution of the expression values of this gene set. Boxes at bottom indicate presence/absence of SynCom and Pi at the concentration indicated. This labeling is maintained throughout. Data is the average of 4 biological replicates. c, Functional activation of PSR by the SynCom. Plants were grown on five different Pi levels (0 µM Pi, 10 µM Pi, 30 µM Pi, 50 µM Pi and 625 µM Pi) without the SynCom (left) and on three different Pi levels (0 µM Pi, 50 µM Pi and 625 µM Pi) with the SynCom (right). Plants were then transferred to full (1 mM Pi) condition to evaluate the capacity of the plants for Pi accumulation over time (Methods). Shoots were harvested every 24 h for 3 days and Pi concentration was measured. Pi increase represents the normalized difference in Pi content at day n with respect to the Pi content on the day of transfer to 1 mM Pi. Shoots with SynCom-activated PSR accumulated approximately 20–40 times more Pi than non-inoculated shoots. Absolute Pi concentration values are available in Supplementary Table 4. For all Pi concentrations and SynCom treatments n=6 at day 0, and n=9 at all other time points, distributed across two independent experiments. d, PCoA of SynCom experiments showing that Agar and Root samples are different from starting inoculum. Biological replicate numbers are: Inoculum (n=4), Agar (n=12) and Root (n=35) across two independent experiments. e, Heatmap showing percent abundances of SynCom isolates (columns) in all samples (rows). Strain name colors correspond to Phylum (bottom left). Within each block, samples are sorted by experiment. For each combination of genotype and Pi level, there are n=6 biological replicates evenly distributed across two independent experiments, except for Inoculum for which there are n=4 technical replicates evenly distributed across two independent experiments. f, Constrained ordination showing the effect of plant genotype and g, media Pi concentration effect on the root communities. The proportion of total variance explained (constrained) by each variable is indicated on top of each plot; for g, remaining unconstrained ordination was subjected to multi-dimensional scaling (MDS); the first MDS axis (MDS1) is shown. For f and g, biological replicate numbers are: Col-0 (n=12), phf1 (n=11), phr1 phl1 (n=12), 50uM Pi (n=24) and 625uM Pi (n=23) distributed across two independent experiments.
Figure 3
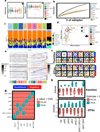
Figure 3. PHR1 mediates interaction of the PSR and plant immune system outputs
a, Hierarchical clustering of 3257 genes that were differentially expressed in the RNA-seq experiment. Plants were germinated on Johnson medium containing 0.5 % sucrose supplemented with 1 mM Pi for 7 d, then transferred to 50 µM Pi or 625 µM Pi media (without sucrose) alone or with the Synthetic Community at 105 c.f.u/mL, for another 12 d (plates vertical). Columns on the right indicate genes that are core PSR markers (‘core’ lane) or had a PHR1 binding peak (‘PHR1 ChIP’ lane). b, Proportion of PSR marker genes per cluster. c, Proportion of PHR1 direct targets genes per cluster. The red line in b and c denotes the proportion of genes in the whole Arabidopsis genome that contain the analyzed feature. Asterisk denotes significant enrichment or depletion (p ≤ 0.05; hypergeometric test). d, Summary of the Gene Ontology enrichment analysis for each of the twelve clusters. The enrichment significance is shown as -log2(FDR). White means no enrichment. The complete results are in Supplementary Table 9. e, The set of genes bound by PHR1 (At4g28610) in ChIP-seq experiments is enriched in genes that are up-regulated by BTH/SA and/or MeJA. Red nodes are core PSR marker genes. f, Example of genes bound by PHR1 and differentially expressed in our experiment. PSR marker genes (top) and JA response (middle) are more expressed in wild-type plants, whereas SA-responsive genes (bottom) exhibit higher transcript levels in phr1 and phr1 phl1. The heatmaps show the average measurement of ten biological replicates for Col-0 and phr1 and six for phr1 phl1. The color key (blue to red) related to a, and f, represents gene expression as Z-scores.
Figure 4
Figure 4. Loss of PHR1 activity results in enhanced activation of plant immunity
a, Venn diagram (left) showing the overlap between genes up-regulated and down-regulated in Col-0 and phr1 phl1 in response to phosphate starvation. Gene ontology enrichment (right) analyses indicate that defense-related genes are up-regulated exclusively in phr1 phl1. The complete enrichment results are shown in Supplementary Table 14. Color key (white to red) represents the gene ontology enrichment significance shown as -log2(FDR). White means no enrichment. b, Fold-change of genes differentially expressed in Col-0, phr1 phl1 or in both genotypes in response to phosphate starvation. Columns on the right indicate whether each gene is also up-regulated by MeJA or BTH/SA. Arabidopsis plants were germinated on Johnson medium (1 % sucrose) containing 1 mM Pi for 7 d in a vertical position and then transferred to the same medium containing 1 % sucrose either alone or supplemented with 1 mM Pi for 12 d. c, Venn diagram showing the overlap among genes up-regulated in Col-0 and phr1 phl1 during a typical PSR (from a) and the defense genes up-regulated in phr1 phl1 in response to the SynCom (from Fig. 3a; clusters c3 and c8). The red ellipse indicates 113 defense genes that were up-regulated in phr1 phl1 during classical PSR and during PSR triggered by the SynCom; yellow ellipse indicates the 14 genes up-regulated genes under the same conditions. p-values refer to enrichment results using hypergeometric tests. dphr1 phl1 exhibits enhanced transcriptional activation of 251 genes differentially expressed following chronic flg22 exposure. Averaged from six biological replicates. ephr1 exhibits enhanced disease resistance to the biotrophic oomycete pathogen Hyaloperonospora arabidopsidis isolate Noco2. Infection classes were defined by the number of asexual sporangiophores (Sp) per cotyledon and displayed as a color gradient from green (more resistant) to red (more susceptible); the mean number of sporangiophores per cotyledon is noted above each bar. Col-0 and Ws-2 represent susceptible and resistant controls, respectively. More than 100 cotyledons counted per genotype; the experiment was performed at least five times with similar results. fphr1 mutants exhibit enhanced disease resistance to the hemibiotrophic bacterial pathogen Pseudomonas syringae DC3000. The coi1-16 (n= 9 (day zero), 13 (day three)) and sid2-1 (n= 16, 20) mutants were controls for resistance and susceptibility, respectively. Col-0 (n=16, 20), phr1 (n=17, 20), phr1 phl1 (n=16, 20) and control plants were inoculated under typical experimental conditions: phosphate replete in non-axenic potting soil (Extended Data Fig. 2). The experiment includes at least 9 biological replicates from three independent experiments. Statistical comparisons among genotypes were one-way ANOVA tests followed by a post-hoc Tukey analysis; genotypes with the same letter above the graph are statistically indistinguishable at 95 % confidence.

Comment in

Similar articles

Cited by

References

    1. Bulgarelli D, Schlaeppi K, Spaepen S, van Themaat EVL, Schulze-Lefert P. Structure and functions of the bacterial microbiota of plants. Annu. Rev. Plant Biol. 2013;64:807–838. - PubMed
    1. Lebeis SL, et al. Salicylic acid modulates colonization of the root microbiome by specific bacterial taxa. Science. 2015;349:860–864. - PubMed
    1. Hacquard S, et al. Microbiota and host nutrition across plant and animal kingdoms. Cell Host Microbe. 2015;17:603–616. - PubMed
    1. Zhu Q, Riley WJ, Tang J, Koven CD. Multiple soil nutrient competition between plants, microbes, and mineral surfaces: model development, parameterization, and example applications in several tropical forests. Biogeosciences. 2016;13:341–363.
    1. Richardson AE, Simpson RJ. Soil microorganisms mediating phosphorus availability update on microbial phosphorus. Plant Physiol. 2011;156:989–996. - PMC - PubMed

Publication types

MeSH terms