. 2017 Mar 23;543(7646):507-512.
doi: 10.1038/nature21678. Epub 2017 Mar 15.

Autism gene Ube3a and seizures impair sociability by repressing VTA Cbln1

Affiliations

Autism gene Ube3a and seizures impair sociability by repressing VTA Cbln1

Vaishnav Krishnan et al. Nature. .

Abstract

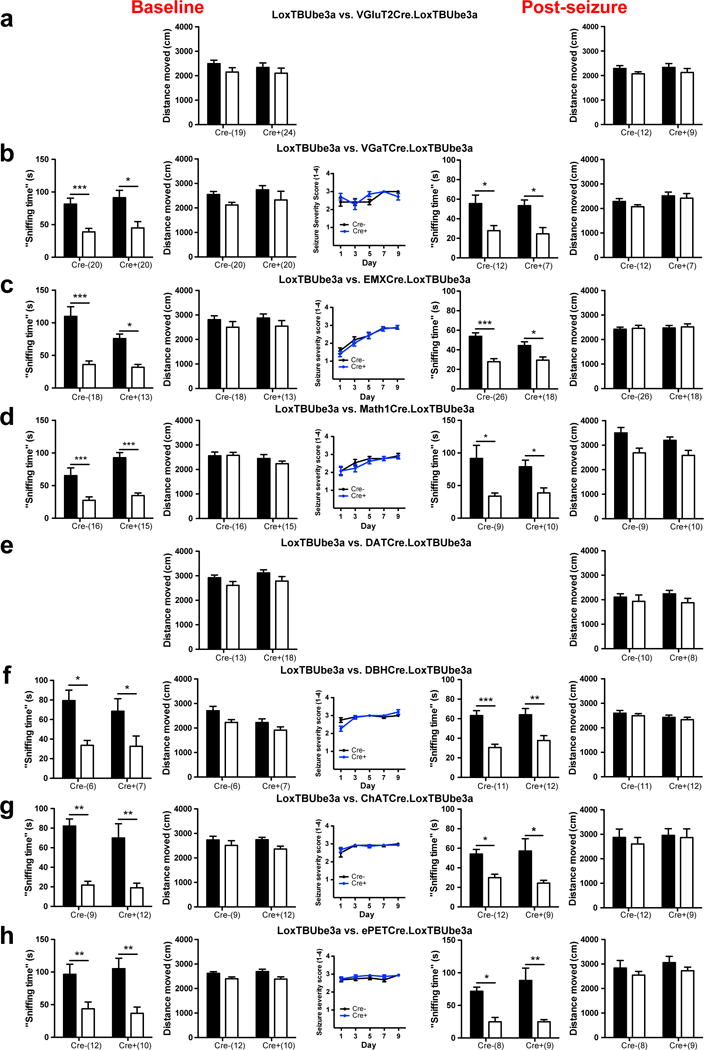
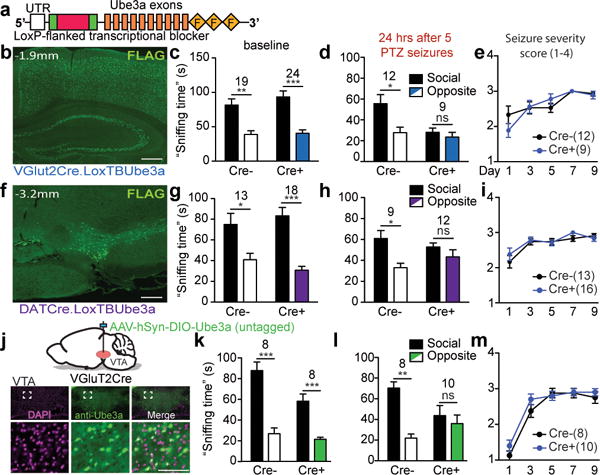
Maternally inherited 15q11-13 chromosomal triplications cause a frequent and highly penetrant type of autism linked to increased gene dosages of UBE3A, which encodes a ubiquitin ligase with transcriptional co-regulatory functions. Here, using in vivo mouse genetics, we show that increasing UBE3A in the nucleus downregulates the glutamatergic synapse organizer Cbln1, which is needed for sociability in mice. Epileptic seizures also repress Cbln1 and are found to expose sociability impairments in mice with asymptomatic increases in UBE3A. This Ube3a-seizure synergy maps to glutamate neurons of the midbrain ventral tegmental area (VTA), where Cbln1 deletions impair sociability and weaken glutamatergic transmission. We provide preclinical evidence that viral-vector-based chemogenetic activation of, or restoration of Cbln1 in, VTA glutamatergic neurons reverses the sociability deficits induced by Ube3a and/or seizures. Our results suggest that gene and seizure interactions in VTA glutamatergic neurons impair sociability by downregulating Cbln1, a key node in the expanding protein interaction network of autism genes.


Conflict of interest statement

Competing Financial Interests: The authors report no competing financial or other conflicts of interest.

Figures

Extended Data Figure 1
Extended Data Figure 1. Protein-protein interactions between genes regulated in Ube3a2x mice and autism-related genes
Edges between gene-labeled nodes represent documented protein-protein physical interactions. Clusters shown here are labeled with their major statistically significant gene ontology classification(s) together with p values representing significant enrichment. Within each cluster, all the genes (Ube3a-regulated and autism-related) were analyzed.
Extended Data Figure 2
Extended Data Figure 2. Ube3aNLS mice and mice with increased untagged Ube3a levels display impaired sociability
a, Total UBE3A protein levels by western blot in WT, Ube3a1x, Ube3aNLS3 and Ube3ANLS7 mice (F[3,17] = 12.30, p<0.001, 5 females/group). b, FLAG staining in Ube3a1x and Ube3aNLS mice, counterstained with DAPI (somatosensory cortex; 3 females/genotype; scale bar: 50 μm). c, Quantified nuclear and neuropil FLAG immunofluorescence in arbitrary units (a.u.). d, UBE3A protein levels in cytosolic and nuclear fractions obtained from WT and Ube3aNLS7 mice (4 females/group), demonstrating a selective increase in nuclear UBE3A protein levels (TBP: TATA-box binding protein, see Supplementary Figure 1). e, “Chamber times” (for Fig. 1d) during the social trial showing absolute times spent in “social”, “middle” and “opposite” chambers f, Distances moved during acclimation/social trials: WT/Ube3a1x (trial factor F[1,56] = 18.09, p<0.001, genotype factor F[1,56] = 0.73, p>0.1), WT/Ube3a2x (trial factor F[1,52] = 12.2, p<0.001, genotype facor F[1,52] = 2.046, p>0.1), WT/Ube3a2x untagged (trial factor F[1,50] = 12.21, p<0.01, genotype factor F[1,50] = 9.67, p<0.01), WT/Ube3aNLS3 (trial factor F[1,56] = 14.41, p<0.001), genotype factor F[1,56] = 0.53, p>0.1), WT/Ube3aNLS7 (trial factor F[1,56] = 22.68, p<0.001, genotype factor F[1,56] = 4.88, p<0.05), WT/p-Ube3amKO (trial factor F[1,62] = 3.67, p>0.05, genotype factor F[1,62] = 216.7, p<0.0001), WT/m-Ube3amKO (trial factor F[1,48] = 1.75, p>0.1, genotype factor F[1,48] = 197.9, p<0.001). g, Total time spent physically interacting during genotype-matched paired female interactions (for Fig. 1e). h, Time spent self-grooming by female mice during a 10 minute observation session across Ube3a1x (n=10 vs. n=14 WT), Ube3a2x (n=11 vs. n=12 WT), Ube3aNLS3 (14/group) and Ube3aNLS7 (n=14/group). i, Ube3aNLS7 (n=15) and WT (n=12) littermates take similar times to find a food item buried in fresh bedding. j, In an open field, Ube3aNLS7 and WT (n=5/group) littermates spend equal times in the center of an open field, and k, ambulate equal distances. l, In an elevated plus maze, Ube3aNLS7 (n=10) mice spend significantly less time in the open arms and m, ambulate slightly shorter distances overall than WT littermates (n=7). Mean ± SEM plotted.
Extended Data Figure 3
Extended Data Figure 3. Quantitative real-time PCR based validation of various genes downregulated in cortical samples from Ube3a2x mice
In separate cohorts of WT and Ube3a transgenic or Ube3amKO mice, we confirmed the downregulation of the following genes shown above in panels a and b: Fat2 (FAT tumor suppressor homolog 2), Arhgef33 (rho-guanine nucleotide exchange factor 33), Crtam (cytotoxic and T-cell regulatory molecule), Dao (D-amino acid oxidase), Smpx (small muscle protein, X-linked), Pcp2 (Purkinje-cell protein 2), Gsbs (protein phosphatase 1, regulatory subunit 17), A2m (alpha-2 macroglobulin), Mab21l1 (mab-21-like 1), Zic1 (zinc finger protein of the cerebellum 1), Car8 (carbonic anhydrase 8), Lhx1 (LIM homeobox protein 1), Calb2 (Calbindin 2), Slc1a6 (solute carrier family 1 [high affinity aspartate/glutamate transporter]), Chn2 (chimerin 2), St18 (suppression of tumorigenicity 18). Sample sizes: Ube3a1x4, Ube3aNLS, Ube3a2x4, m-Ube3amKO (n=3 pooled samples from two mice each), Ube3a2x (untagged) and p-Ube3amKO (n=6–12/group, unpooled). Mean ± SEM plotted. Transgene constructs and/or breeding schemes are shown on the right.
Extended Data Figure 4
Extended Data Figure 4. Quantitative real-time PCR based validation of various genes upregulated in cortical samples from Ube3a2x mice
a, In separate cohorts of WT and Ube3a2x mice, the upregulation of the following genes were confirmed by qRT-pCR: s100a8 (s100 calcium binding protein A8), s100a9 (s100 calcium binding protein A9), (Gh (growth hormone), Cdhr1 (cadherin-related family member 1), Nptx2 (neuronal pentraxin-2), Blnk (B-cell linker), Islr2 (immunoglobulin superfamily containing leucine-rich repeat 2), Grasp (Grp1 associated scaffold protein), Agmat (agmatine ureohydrolase), Pcdh8 (protocadherin 8), Rasl10a (Ras-like, family 10, member A), Dlx1 (distal-less homebox 1), Wisp1 (Wnt1 associated signaling pathway protein 1), Glt8d2 (glycosyltransferase 8 containing domain 2), Igfbp4 (insulin-like growth factor binding protein 4), Ptgs2 (prostaglandin endoperoxide synthase 2), Dmkn (dermokine), Gcnt2 (glucosaminyl [N-acetyl] transferase 2 I-branching enzyme), Pcdh15 (protocadherin 15), Efna3 (ephrin A3), Kalrn (kalirin, RhoGEF kinase), Tnnt2 (troponin-2, cardiac), Kcnh5 (potassium channel, voltage gated eag family related subfamily H, member 5), Prkg2 (protein kinase, cGMP dependent 2), Trpc6 (transient receptor potential cation channel, subfamily C, member 6), Kcnq3 (potassium channel, voltage gated KQT-like subfamily Q, member 3), Homer2 (homer homolog 2). b, Regulation of these genes in cortical samples from Ube3aNLS7, c, Ube3a1x, and d, Ube3amKO mice. n=3/genotype with each biological replicate representing a pooled sample of tissue from two genotype-matched mice. Mean ± SEM plotted.
Extended Data Figure 5
Extended Data Figure 5. Characterization of VGluT2Cre.Cbln1fl/fl mice
a, Representative coronal sections from the Allen Developing Mouse Brain Atlas with shaded red regions depicting the approximate geometric center of punch biopsy samples used for quantitative real time PCR experiments (Image credit: Allen Institute). b, “Chamber times” (for Fig. 1g) during the social trial showing absolute time spent in “social”, “middle” and “opposite” chambers. c, Distances moved during acclimation/social trials (trial factor F[1,32] = 27.21, p<0.0001, genotype factor F[1,32] = 8.186, p<0.01). d, Total time spent physically interacting during genotype-matched paired female interactions (for Fig. 1h), and e, total time spent self-grooming during a 10 minute observation period (males only, n=8/group). f, In the elevated plus maze, VGluT2Cre.Cbln1fl/fl (n=10) mice spent greater time in the open arms than Cbln1fl/fl mice (n=8) and g, ambulated significantly greater distances. h, Performance of VGluT2Cre.Cbln1fl/fl (n=16) and Cbln1fl/fl (n=13) on buried food testing. Open field-testing of VGluT2Cre.Cbln1fl/fl and Cbln1fl/fl mice (n=10/group) with i, time in center, and j, distances moved. k, VGluT2Cre.Cbln1fl/fl mice (n=16) display reduced latencies to fall off of an accelerating rotarod compared with Cbln1fl/fl mice (n=13, genotype factor, F[1, 81] = 18.10, p<0.001). Mean ± SEM plotted.
Extended Data Figure 6
Extended Data Figure 6. Recurrent seizures induced by pentylenetetrazole (PTZ) impair sociability
a, Ten daily 30 mg/kg PTZ injections applied to male WT mice resulted in a gradual daily increase in the percentage of animals that displayed a PTZ-induced generalized convulsion (n=25). b, Weight change for PTZ (n=10) or saline-treated mice (n=8), with test day factor F[9,160] = 0.28, p>0.1, treatment factor F[1,160] = 0.34, p>0.1. c, 24h following the last PTZ (n=16) or saline (n=14) injection, open field testing identified no significant differences in the time spent in the center of the field or d, total distance ambulated in the field (n=10/group). e, Similarly, on the elevated plus maze, 10 PTZ-induced seizures did not affect the time spent in the open arms or f, distance moved (n=10/group). g, Distances moved during acclimation/social trials for male mice (for Fig. 2b, treatment factor F[1,32] = 0.38, p>0.1, trial factor F[1,32] = 0.06, p>0.1). h Female WT FVB mice exposed to an identical 10 day PTZ (n=10) protocol demonstrated impaired sociability 24 hours following the last injection compared with mice that received saline alone (n=9), whereas i, distances moved during acclimation/social trials were not affected (treatment factor F[1,34] = 2.47, p>0.1, trial factor F [1,34] = 1.79, p>0.1). j, 10 PTZ-induced seizures do not impact self-grooming rates (n=10 females/group) or k, performance on the buried food test (males: saline 10, PTZ 7/group, females: saline 7, PTZ 9/group)). l, 30 days following the last of 10 daily PTZ injections, male wild-type FVB mice continue to display impaired sociability (saline 10/group, PTZ 7/group), as do m, 10 daily PTZ-treated female mice (saline 6/goup, PTZ 7/group). n, Distances moved during acclimation/social trials for Fig. 2f–g. WT/p-Ube3amKO (trial factor F[1,62] = 5.06, p<0.05, genotype factor F[1,62] = 209.2, p<0.0001) and WT/m-Ube3amKO (trial factor F[1,54] = 0.20, p>0.1, genotype factor F[1,54] = 56.06, p<0.001). o, Distances moved for Fig. 2h (trial factor F[1.62] = 3.57, p>0.05, group factor F[2,62] = 1.57, p>0.05). p, Distances moved for Fig. 2i (trial factor F[1,62] = 13.29, p<001, group factor F[2,62] = 2.43, p>0.05). q, Ube3a mRNA measured in punches from WT FVB males treated with ten daily injections of 30 mg/kg PTZ or saline (HPc, n=8/group, ECx and VTA: saline 10, PTZ 8). Mean ± SEM plotted.
Extended Data Figure 7
Extended Data Figure 7. Validation of “LoxTBUbe3a” mice
a, Quantitative real time PCR analysis of Ube3a mRNA from hippocampal samples (Extended Data Fig. 5a) demonstrating the up-regulation of Ube3a in VGluT2Cre.LoxTBUbe3a and EMXCre.LoxTBUbe3a mice. b, Similar analysis of Ube3a mRNA levels from punches of the ventral tegmental area of DATCre.LoxTBUbe3a mice (n=8/group). c-h, Spatial confirmation of FLAG staining in various “crosses” of LoxTBUbe3a mice confirming expression of Ube3a in inhibitory forebrain neurons (c), cortical and hippocampal neurons (d), scattered staining in midbrain and pontine nuclei (e), locus coeruleus (f), striatal cholinergic interneurons (g), and raphe regions (h), representative of n=2–3 mice/group. Mean ± SEM plotted.
Extended Data Figure 8
Extended Data Figure 8. Targeted overexpression of Ube3a in VGluT2 and DAT neurons increases the susceptibility to seizure-induced deficits in sociability
a–h, For each line of mice, we provide baseline “sniffing time” measures on sociability testing (far left), distances moved during this baseline test (second from left), seizure severity scores during five (alternate day) 30 mg/kg PTZ injections (middle), post-seizure “sniffing time” measures on three chamber testing (second from right) and associated distances moved (far right). For sociability data, black and white bars represent “sniffing times” for social and opposite wire mesh cages respectively. For distance measures, black and white bars represent distances moved during acclimation and social trials respectively. For VGluT2Cre and DATCre lines, see Fig. 3c–e, g–i. Mean ± SEM plotted.
Extended Data Figure 9
Extended Data Figure 9. Stereotaxic manipulations of Ube3a, VGluT2 and Cbln1 in VTA
a, qRT-PCR analysis of Cbln1 mRNA in VTA punches of WT and Ube3a1x4 mice obtained 24h after the last of 5 alternate day PTZ injections. b, Distances moved during acclimation/social trials for mice in Fig. 3k (genotype factor F[1,28] = 14.45, p<0.001, trial factor F[1,28] = 5.16, p<0.05). c, Distances moved for Fig. 3l (genotype factor F[1,28] = 1.267, p>0.1, trial factor F[1,28] = 2.72, p>0.1). d, Distances moved for Fig. 4a (virus factor F[1,34] = 2.81, p>0.1, trial factor F[1,34] = 2.02, p>0.1), or e-f, time spent in the center or the total distance moved in an open field for AAVCreGFP (n=12) or AAVGFP injected (n=8) Cbln1fl/fl mice. g, Disstances moved for Fig. 4b (virus factor F[1,44] = 7.9, p<0.01, trial factor F[1,44] = 20.49, p<0.001). h, Distances moved for Fig. 4c (genotype factor F[1,26] = 0.22, p>0.1, trial factor F[1,26] = 5.86, p<0.05). i. Cumulative frequency plots of sEPSC amplitudes for Fig. 4d,e. j, Representative response of a medium spiny neuron (MSN) to injected currents (−20 to +280 pA). k, Average resting membrane potentials in the nucleus accumbens (NAc) medial shell in control (n=23 neurons) and neurons from mice with VTA targeted AAV-CreGFP-mediated deletions of Cbln1 (n=22 neurons, p>0.1). l, Laser intensity needed to induce EPSC currents in medial shell NAc MSNs from ChR2-EYFP mice with AAV-CreGFP infused into VTA (n=5 neurons). m, Distances moved for Fig. 4i (trial factor F[1,36] = 9.45, p<0.01, virus factor F[1,36] = 8.49, p<0.01). n.o Time spent in the center and distances moved during the open field test following AAV-CreGFP mediated deletion of VGluT2 in VTA (n=8). p, Distances moved for Fig. 4i (genotype factor F[1,36] = 1.15, p>0.1, trial factor F[1,36] = 6.18, p<0.1). Mean ± SEM plotted.
Extended Data Figure 10
Extended Data Figure 10. Chemogenetic manipulations of VTA VGluT2 neurons
a, Distances moved for Fig. 5a (trial factor F[1,48] = 20.11, p<0.001, treatment factor F[1,48] = 0.73, p>0.5). b, Distances moved for Fig. 5b (treatment factor F[2,111] = 1.04, p>0.5, trial factor F[2,111] = 9.55, p<0.01). c, Distances moved for Fig. 5c (trial factor F[1,102] = 18.16, p<0.0001, group factor F[2,102] = 5.7, p<0.01). d, Distances moved for Fig. 5d (trial factor F[1,90] = 3.64, p>0.05, group factor F[2,90] = 0.77, p>0.05). e, LEFT: Distances moved for Fig. 5e LEFT (trial factor F[1,52] = 7.08, p<0.05, virus factor F[1.52] = 0.022, p>0.5). RIGHT: Distances moved for Fig. 5e RIGHT (trial factor F[1,76] = 8.48, p<0.01, virus factor F[1,76] = 1.16, p>0.05). f, qRT-PCR analysis of Rest mRNA levels in VTA 24h following 10 PTZ (n=8) or saline injections (n=10). g, Data presented from the Encode Project Consortium showing locations of REST binding (also known as NRSF – neuronal restrictive silencing factor) within Cbln1 intron of human (top) and mouse (bottom). Mean ± SEM plotted.
Figure 1
Figure 1. Nuclear-targeted increases of UBE3A repress ASD network gene Cbln1 that is required in VGluT2 neurons for sociability
a, Protein interaction sub-cluster enriched for glutamatergic synapse proteins encoded by autism-linked and Ube3a up- and down-regulated genes. b, q-RT-PCR validates Cbln1 in Ube3a1x4, Ube3aNLS, Ube3a2x4, m-Ube3amKO (n=3 pooled samples of two mice each), Ube3a2x (untagged) and p-Ube3amKO (n=6–12/group). Transgene constructs or breeding strategy schematic shown (F: FLAG-tags, NLS: nuclear localization signal). c, q-RT-PCR validates Cbln3 (Cerebellin-3), Grid-2 (glutamate receptor ionotropic delta subunit-2), Homer-3, Inadl (InaD-like), Grm4 (Glutamate receptor metabotropic 4), En2 (engrailed-2), Gabra6 (GABA-A subunit alpha 6), Il16 (interleukin-16), Fgf7 (fibroblast growth factor 7), Chd7 (chomodomain helicase DNA binding protein 7), Atp2a3 (ATPase Calcium transporting ubiquitous), Tfap2b (transcription factor AP-2 beta), Calb2 (Calbindin 2), Gdf10 (growth differentiation factor 10), Zfp521 (Zinc finger protein 521), Ebf1 (early B-cell factor 1). d, Sociability of female mutant/transgenic and WT littermate mice. e, USVs during genotype-matched pairings. f, qRT-PCR for Cbln1 (Cblm: cerebellum, MA: medial amygdala, HPc: hippocampus, ECx: entorhinal cortex, VTA: ventral tegmental area, RSCx: retrosplenial cortex, VMH: ventromedial hypothalamus); g, sociability (Cre- n=8, Cre+ n=10); and h, USVs in male-female (Cre- n=14, Cre+ n=8) and genotype-matched female-female pairs (Cre- n=11, Cre+ n=16). Mean ± SEM plotted. For three-chamber experiments, “sniffing time” analyzed by two-way repeated-measures ANOVA. F statistics and p values for “interaction effects” between chamber side (social versus opposite) or experimental group (viruses, treatments or genotypes) and “main effects” in Supplementary Table 5. For significant interaction and/or main effects, a Bonferroni post-hoc test p-value is reported (adjusted for multiple comparisons, corresponding to * or ns [not significant] designations).
Figure 2
Figure 2. Seizures synergize with increased UBE3A to repress sociability and Cbln1
a, LEFT: Seizure severity during 10 daily 30mg/kg PTZ doses in WT (n=25 males) and RIGHT, qRT-PCR for Cbln1 24h after last PTZ injection. b, Sociability (males), and c, USVs in male-female and treatment-matched female pairs. Seizure severity with 10 daily PTZ (30 mg/kg) and sociability 24h after last PTZ dose in d,f, WT (n=16) vs. p-Ube3amKO (n=17) and e,g, WT (n=18) and m-Ube3amKO (n=11). h, Baseline sociability, i, post-seizure sociability and j, seizure severity scores during the five day “subthreshold” PTZ paradigm in WT mice (n=8) and two independent cohorts of littermate Ube3a1x (untagged) mice (n=12 [saline], 14[PTZ]). k, Following seizures (above), qRT-PCR for Cbln1 and Ube3a mRNA in, p-Ube3amKO (n=5), m-Ube3amKO (9) and WT (7/group), and, Ube3a1x (untagged, n=8/group). Mean ± SEM plotted.
Figure 3
Figure 3. UBE3A-seizure synergy localizes to VTA
a, “LoxTBUbe3a” schematic. b, FLAG immunofluorescence in VGluT2Cre.LoxTBUbe3a (cortex/hippocampus, scale bar: 400 μm). c, Baseline sociability, d, post-seizure sociability, and e, seizure severity with subthreshold PTZ paradigm in LoxTBUbe3a or VGluT2Cre.LoxTB-Ube3a.VGluT2Cre littermates. f, FLAG immunofluorescence in DATCre.LoxTBUbe3a (midbrain, scale bar: 400 μm). g, Baseline sociability, h, post-seizure sociability, and i, seizure severity with subthreshold PTZ paradigm in LoxTBUbe3a or DATCre.LoxTB-Ube3a littermates. j, Representative VTA-containing sections of VGluT2Cre.Ube3amKO mice after injecting of AAV-hSyn-DIO-Ube3a, showing nuclear (pink, DAPI) and cytosolic UBE3A (green) in VTA (nuclear/UBE3A co-localized white; n=3 mice, scale bar: 100 μm). k, Baseline sociability, l, post-seizure sociability, and m, seizure severity with subthreshold PTZ paradigm in VGluT2Cre or WT littermates 20d following VTA AAV-hSyn-DIO-Ube3a injection. Mean ± SEM plotted.
Figure 4
Figure 4. VTA VGluT2+ neuron-targeted deletions of Cbln1 impair sociability and VTA-NAc glutamatergic synaptic transmission
a, Sociability in Cbln1fl/fl mice with AAV-GFP (n=8) and AAV-CreGFP (n=12) injected into VTA and representative VTA-containing section showing GFP staining (RLi: rostral linear nucleus, IF: interfascicular nucleus, ml: medial lemniscus, IPn: interpeduncular nucleus). b, LEFT: Sociability following injections of AAV-VGluT2-RFP (n=13) or AAV-VGluT2-Cre-RFP (n=11) and RIGHT: qRT-PCR for VTA Cbln1 mRNA (n=8). c, Sociability in Cre- (n=9) and DAT-Cre+ Cbln1fl/fl mice (n=6). d, Representative light evoked EPSCs from NAc medial shell MSNs with or without local Cbln1 deletion. e, EPSC amplitudes for controls (n=12 neurons, 6 mice), following Cbln1 deletion (n=15 neurons,8 mice) or following PTZ exposure (n=10 neurons, 3 mice). f, Cumulative frequency plots of spontaneous EPSCs from neurons in e. g, Light-evoked VTA-NAc medial shell MSN EPSCs with AAV-hSyn-DIO-ChR2-EYFP in VTA of VGluT2Cre (n=14 neurons, 6 mice) or VGluT2Cre.Cbln1fl/fl (n=22 neurons, 7 mice). h, LEFT: Sociability in VGluT2fl/fl mice with VTA AAV-GFP (n=8) or AAV-CreGFP (n=12) and RIGHT: qRT-PCR for VTA VGluT2 mRNA in h. ,i Sociability in Cre- (n=11) or DATCre+ VGluT2fl/fl mice (n=6). Mean ± SEM plotted.
Figure 5
Figure 5. Sociability deficits produced by Ube3a-seizure synergy are rescued by chemogenetic activation or increased Cbln1 mRNA in VTA VGluT2 neurons
a, Sociability in VTA AAV-DIO-KORD injections in VGluT2Cre mice receiving either DMSO or SALB (10 mg/kg, s.c., n=13). b, Sociability (first and second 5 minute period of social trial) for VTA AAV-DIO-hM3D(Gq)-mCherry in VGluT2Cre mice (n=14). c, Sociability in VTA AAV-hSyn-DIO-Ube3a and AAV-DIO-hM3D(Gq)-mCherry co-injected in VGluT2Cre mice at baseline and after 5 PTZ-induced seizures comparing saline and CNO (n=18). d, Sociability for VTA AAV-DIO-hM3D(Gq)-mCherry injected VGluT2Cre mice at baseline and after 10 PTZ-induced seizures (n=16). e, Sociability before (LEFT, n=14[GFP], n=14[Cbln1]) and after (RIGHT, n=16[GFP], n=23[Cbln1]) 5 PTZ-induced seizures, f, seizure severity scores, and g, qRT-PCR validation (n=10/group) of VTA AAV-DIO-Ube3a/AAV-DIO-GFP or AAV-DIO-Ube3a/AAV-DIO-Cbln1 in VTA of VGluT2Cre mice. Mean ± SEM plotted.

Similar articles

Cited by

References

    1. Chen JA, Penagarikano O, Belgard TG, Swarup V, Geschwind DH. The emerging picture of autism spectrum disorder: genetics and pathology. Annual review of pathology. 2015;10:111–144. doi: 10.1146/annurev-pathol-012414-040405. - DOI - PubMed
    1. El Achkar CM, Spence SJ. Clinical characteristics of children and young adults with co-occurring autism spectrum disorder and epilepsy. Epilepsy & behavior : E&B. 2015 doi: 10.1016/j.yebeh.2014.12.022. - DOI - PubMed
    1. Glessner JT, et al. Autism genome-wide copy number variation reveals ubiquitin and neuronal genes. Nature. 2009;459:569–573. doi: 10.1038/nature07953. - DOI - PMC - PubMed
    1. Smith SE, et al. Increased gene dosage of Ube3a results in autism traits and decreased glutamate synaptic transmission in mice. Science translational medicine. 2011;3:103ra197. doi: 10.1126/scitranslmed.3002627. - DOI - PMC - PubMed
    1. Jiang YH, et al. Mutation of the Angelman ubiquitin ligase in mice causes increased cytoplasmic p53 and deficits of contextual learning and long-term potentiation. Neuron. 1998;21:799–811. - PubMed

Publication types

MeSH terms