

Memory effects on epidemic evolution: The susceptible-infected-recovered epidemic model
- PMID: 28297983
- PMCID: PMC7217510
- DOI: 10.1103/PhysRevE.95.022409
Memory effects on epidemic evolution: The susceptible-infected-recovered epidemic model
Abstract
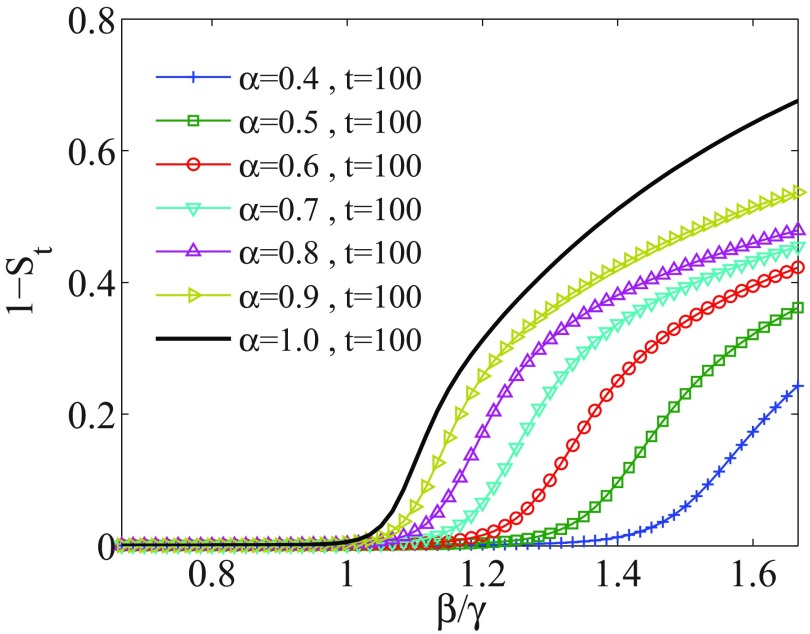
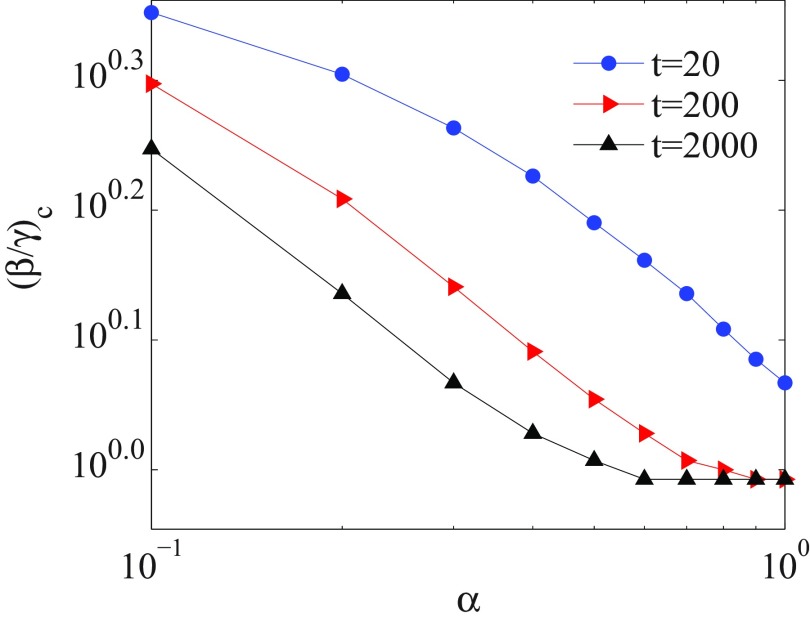
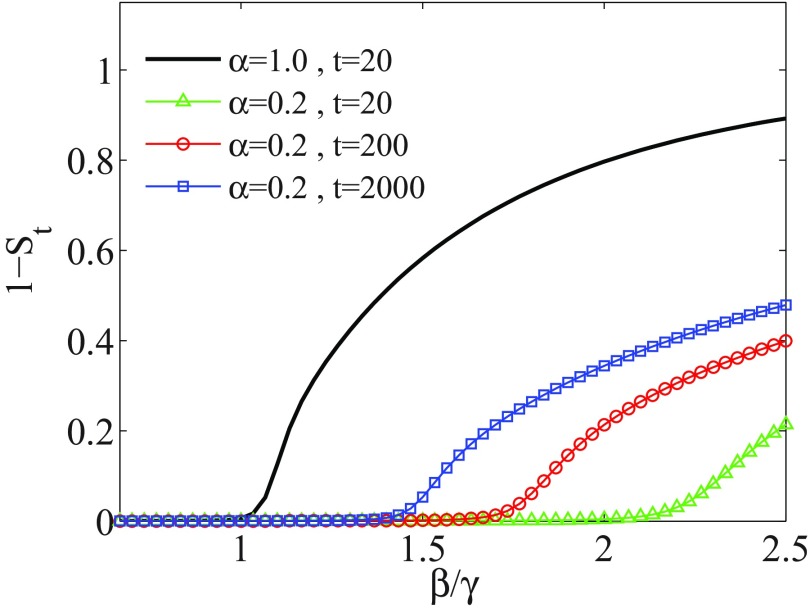
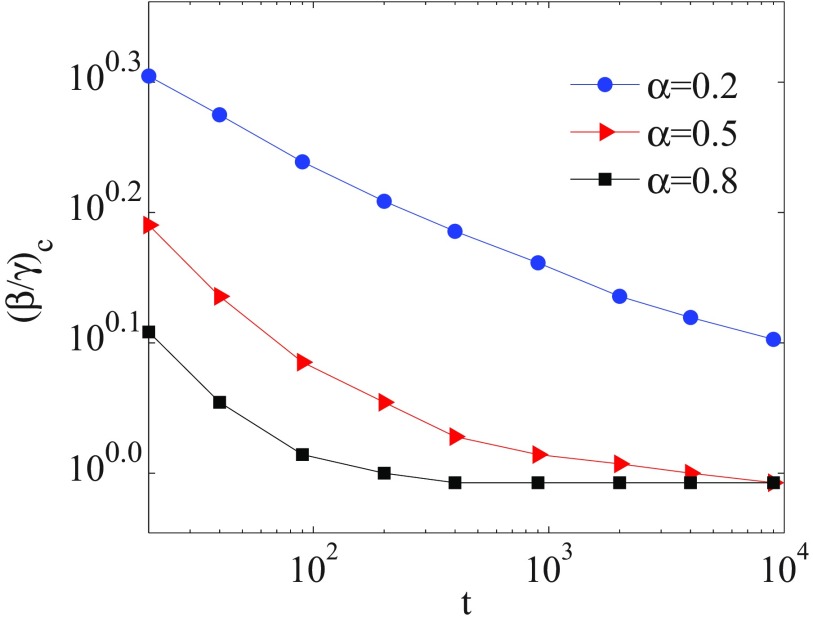
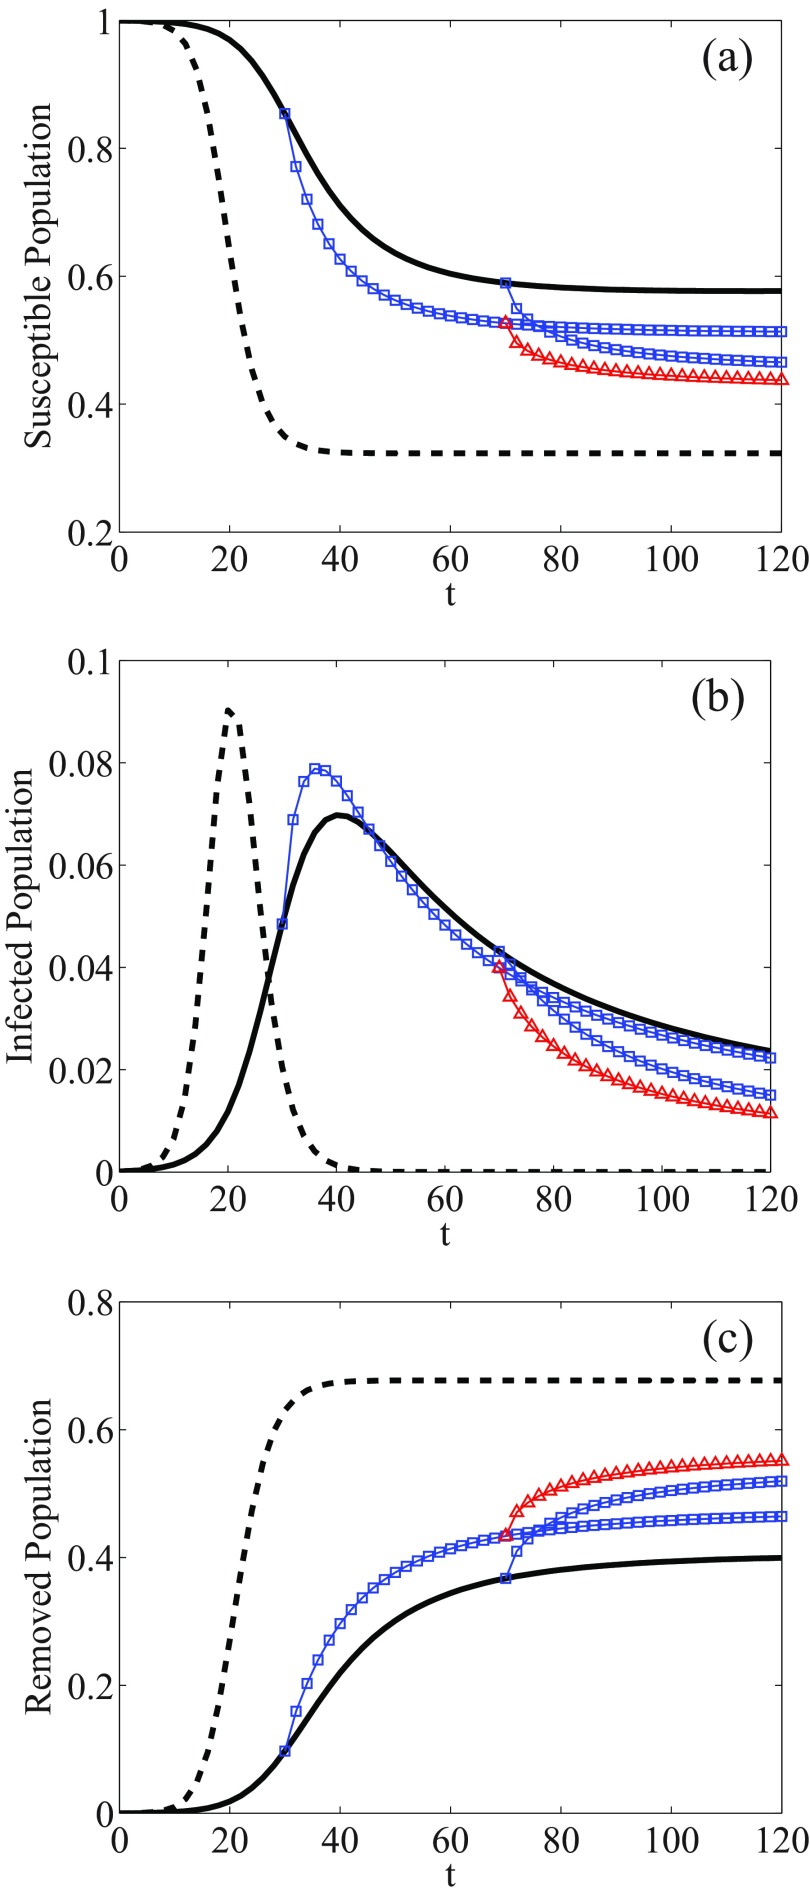
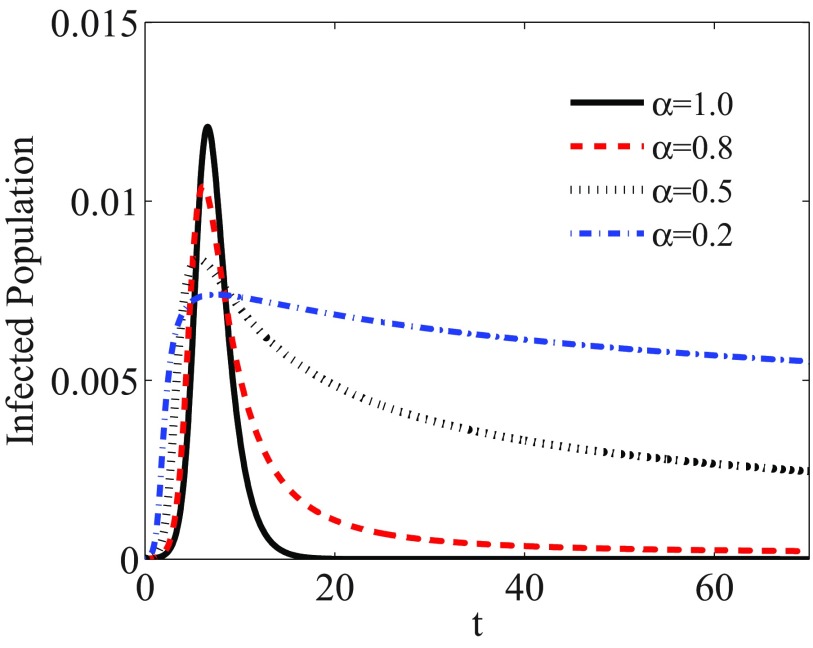
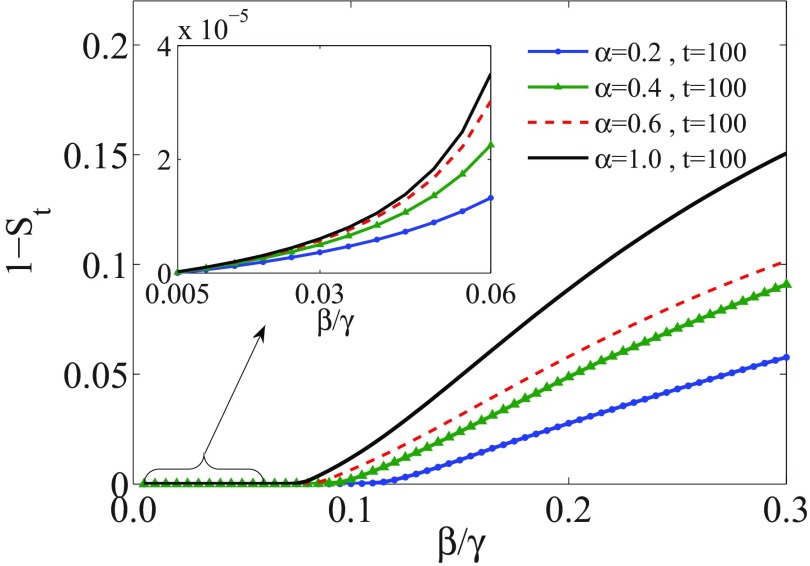
Memory has a great impact on the evolution of every process related to human societies. Among them, the evolution of an epidemic is directly related to the individuals' experiences. Indeed, any real epidemic process is clearly sustained by a non-Markovian dynamics: memory effects play an essential role in the spreading of diseases. Including memory effects in the susceptible-infected-recovered (SIR) epidemic model seems very appropriate for such an investigation. Thus, the memory prone SIR model dynamics is investigated using fractional derivatives. The decay of long-range memory, taken as a power-law function, is directly controlled by the order of the fractional derivatives in the corresponding nonlinear fractional differential evolution equations. Here we assume "fully mixed" approximation and show that the epidemic threshold is shifted to higher values than those for the memoryless system, depending on this memory "length" decay exponent. We also consider the SIR model on structured networks and study the effect of topology on threshold points in a non-Markovian dynamics. Furthermore, the lack of access to the precise information about the initial conditions or the past events plays a very relevant role in the correct estimation or prediction of the epidemic evolution. Such a "constraint" is analyzed and discussed.
Figures
Similar articles
-
Non-Markovian infection spread dramatically alters the susceptible-infected-susceptible epidemic threshold in networks.Phys Rev Lett. 2013 Mar 8;110(10):108701. doi: 10.1103/PhysRevLett.110.108701. Epub 2013 Mar 5. Phys Rev Lett. 2013. PMID: 23521310
-
The large graph limit of a stochastic epidemic model on a dynamic multilayer network.J Biol Dyn. 2018 Dec;12(1):746-788. doi: 10.1080/17513758.2018.1515993. J Biol Dyn. 2018. PMID: 30175687
-
Effects of void nodes on epidemic spreads in networks.Sci Rep. 2022 Mar 10;12(1):3957. doi: 10.1038/s41598-022-07985-9. Sci Rep. 2022. PMID: 35273312 Free PMC article.
-
A Fractional Order Recovery SIR Model from a Stochastic Process.Bull Math Biol. 2016 Mar;78(3):468-99. doi: 10.1007/s11538-016-0151-7. Epub 2016 Mar 3. Bull Math Biol. 2016. PMID: 26940822
-
#stayhome to contain Covid-19: Neuro-SIR - Neurodynamical epidemic modeling of infection patterns in social networks.Expert Syst Appl. 2021 Mar 1;165:113970. doi: 10.1016/j.eswa.2020.113970. Epub 2020 Sep 3. Expert Syst Appl. 2021. PMID: 32908331 Free PMC article.
Cited by
-
Modelling disease spread with spatio-temporal fractional derivative equations and saturated incidence rate.Model Earth Syst Environ. 2023 Apr 8:1-13. doi: 10.1007/s40808-023-01773-8. Online ahead of print. Model Earth Syst Environ. 2023. PMID: 37361702 Free PMC article.
-
Manifesto for a post-pandemic modeling.Physica A. 2020 Dec 1;559:125086. doi: 10.1016/j.physa.2020.125086. Epub 2020 Aug 13. Physica A. 2020. PMID: 32836719 Free PMC article. No abstract available.
-
Qualitative analysis of a fractional-order two-strain epidemic model with vaccination and general non-monotonic incidence rate.Int J Dyn Control. 2022 Nov 22:1-12. doi: 10.1007/s40435-022-01083-4. Online ahead of print. Int J Dyn Control. 2022. PMID: 36465981 Free PMC article.
-
Integer Versus Fractional Order SEIR Deterministic and Stochastic Models of Measles.Int J Environ Res Public Health. 2020 Mar 18;17(6):2014. doi: 10.3390/ijerph17062014. Int J Environ Res Public Health. 2020. PMID: 32197541 Free PMC article.
-
Global analysis of a time fractional order spatio-temporal SIR model.Sci Rep. 2022 Apr 6;12(1):5751. doi: 10.1038/s41598-022-08992-6. Sci Rep. 2022. PMID: 35388030 Free PMC article.
References
-
- R. Pastor-Satorras, C. Castellano, P. Van Mieghem, and A. Vespignani, Rev. Mod. Phys. 87, 925 (2015).RMPHAT10.1103/RevModPhys.87.925 - DOI
-
- F. Brauer and C. Castillo-Chávez, Mathematical Models in Population Biology and Epidemiology, Applied Mathematics Vol. 40 (Springer, New York, 2012).
-
- C. Ash, Science 347, 1213 (2015).10.1126/science.347.6227.1213-j - DOI
-
- N. K. Vitanov and M. R. Ausloos, in Knowledge Epidemics and Population Dynamics Models for Describing Idea Diffusion, Models of Science Dynamics: Encounters Between Complexity Theory and Information Sciences, edited by A. Scharnhorst, K. Boerner, and P. van den Besselaar (Springer Verlag, Berlin/Heidelberg, 2012), Chap. 3, pp. 69–125.
MeSH terms
LinkOut - more resources
Full Text Sources
Other Literature Sources
Medical
Miscellaneous