

Network reconstruction of the mouse secretory pathway applied on CHO cell transcriptome data
- PMID: 28298216
- PMCID: PMC5353859
- DOI: 10.1186/s12918-017-0414-4
Network reconstruction of the mouse secretory pathway applied on CHO cell transcriptome data
Abstract
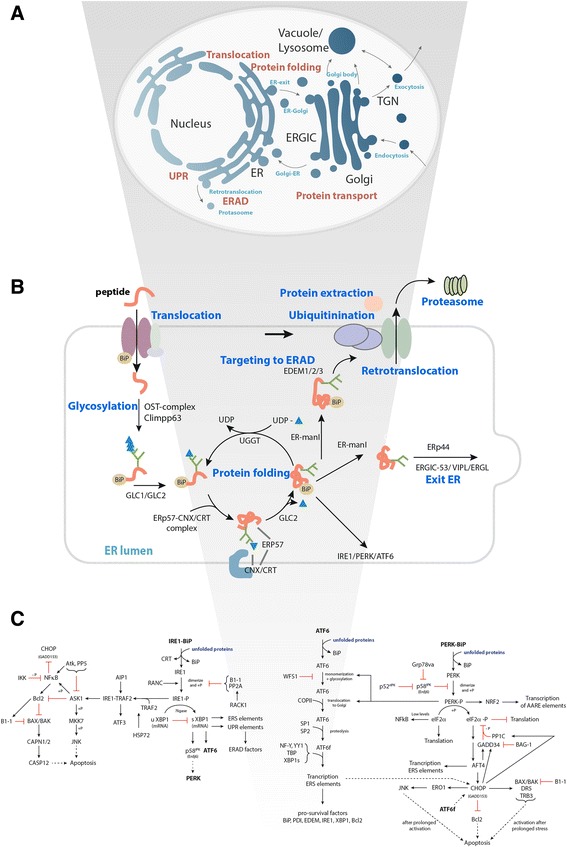
Background: Protein secretion is one of the most important processes in eukaryotes. It is based on a highly complex machinery involving numerous proteins in several cellular compartments. The elucidation of the cell biology of the secretory machinery is of great importance, as it drives protein expression for biopharmaceutical industry, a 140 billion USD global market. However, the complexity of secretory process is difficult to describe using a simple reductionist approach, and therefore a promising avenue is to employ the tools of systems biology.
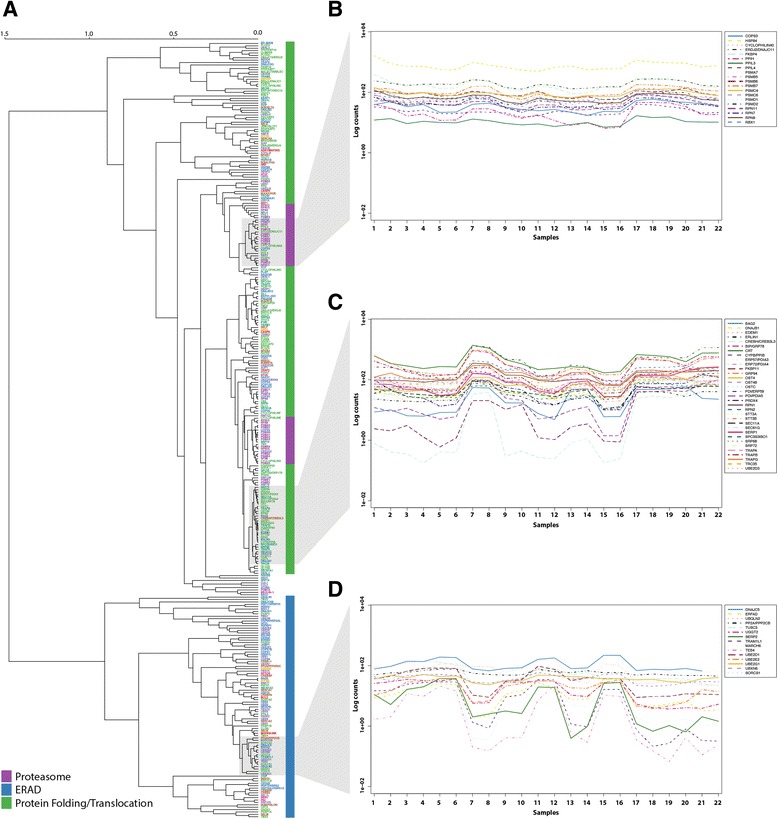
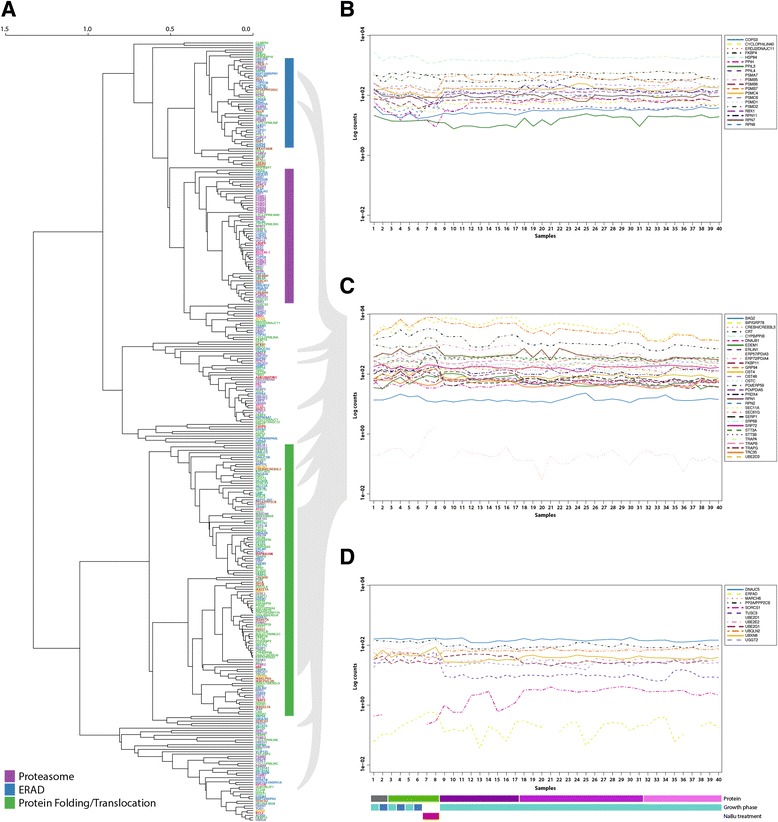
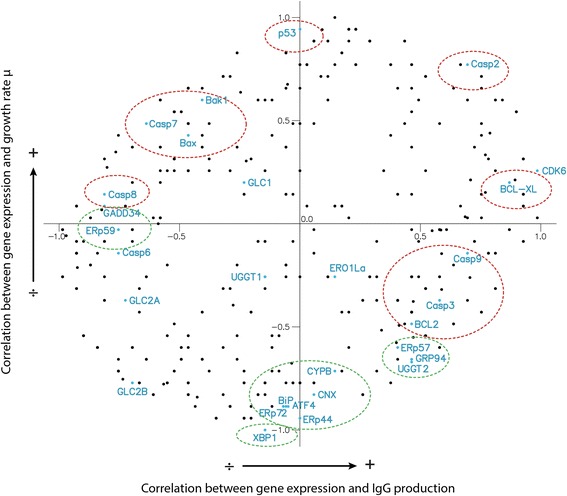
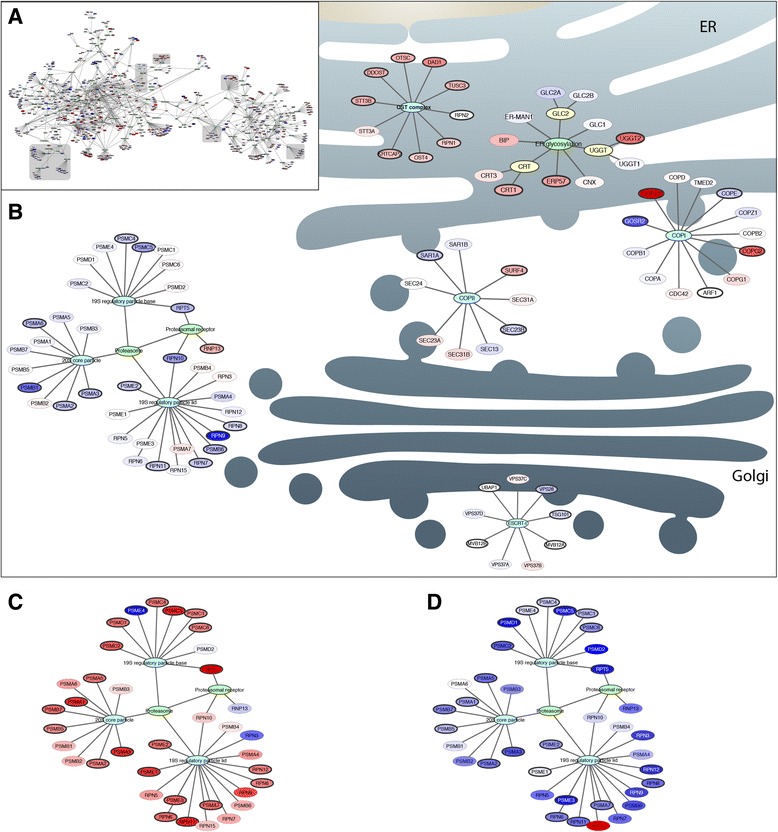
Results: On the basis of manual curation of the literature on the yeast, human, and mouse secretory pathway, we have compiled a comprehensive catalogue of characterized proteins with functional annotation and their interconnectivity. Thus we have established the most elaborate reconstruction (RECON) of the functional secretion pathway network to date, counting 801 different components in mouse. By employing our mouse RECON to the CHO-K1 genome in a comparative genomic approach, we could reconstruct the protein secretory pathway of CHO cells counting 764 CHO components. This RECON furthermore facilitated the development of three alternative methods to study protein secretion through graphical visualizations of omics data. We have demonstrated the use of these methods to identify potential new and known targets for engineering improved growth and IgG production, as well as the general observation that CHO cells seem to have less strict transcriptional regulation of protein secretion than healthy mouse cells.
Conclusions: The RECON of the secretory pathway represents a strong tool for interpretation of data related to protein secretion as illustrated with transcriptomic data of Chinese Hamster Ovary (CHO) cells, the main platform for mammalian protein production.
Keywords: Chinese hamster ovary cells; Pathway reconstruction; Protein secretion; RNA-Seq; Secretion pathway.
Figures
Similar articles
-
Genome-scale reconstructions of the mammalian secretory pathway predict metabolic costs and limitations of protein secretion.Nat Commun. 2020 Jan 2;11(1):68. doi: 10.1038/s41467-019-13867-y. Nat Commun. 2020. PMID: 31896772 Free PMC article.
-
Analysis of intracellular IgG secretion in Chinese hamster ovary cells to improve IgG production.J Biosci Bioeng. 2019 Jan;127(1):107-113. doi: 10.1016/j.jbiosc.2018.06.018. Epub 2018 Jul 13. J Biosci Bioeng. 2019. PMID: 30017708
-
A Bioinformatics Pipeline for the Identification of CHO Cell Differential Gene Expression from RNA-Seq Data.Methods Mol Biol. 2017;1603:169-186. doi: 10.1007/978-1-4939-6972-2_11. Methods Mol Biol. 2017. PMID: 28493130
-
Towards next generation CHO cell biology: Bioinformatics methods for RNA-Seq-based expression profiling.Biotechnol J. 2015 Jul;10(7):950-66. doi: 10.1002/biot.201500107. Epub 2015 Jun 9. Biotechnol J. 2015. PMID: 26058739 Review.
-
The secretory pathway - the key for unlocking the potential of Chinese hamster ovary cell factories for manufacturing therapeutic proteins.Crit Rev Biotechnol. 2023 Jun;43(4):628-645. doi: 10.1080/07388551.2022.2047004. Epub 2022 Apr 24. Crit Rev Biotechnol. 2023. PMID: 35465810 Review.
Cited by
-
Dysregulation of the secretory pathway connects Alzheimer's disease genetics to aggregate formation.Cell Syst. 2021 Sep 22;12(9):873-884.e4. doi: 10.1016/j.cels.2021.06.001. Epub 2021 Jun 24. Cell Syst. 2021. PMID: 34171228 Free PMC article.
-
The emerging role of systems biology for engineering protein production in CHO cells.Curr Opin Biotechnol. 2018 Jun;51:64-69. doi: 10.1016/j.copbio.2017.11.015. Epub 2017 Dec 7. Curr Opin Biotechnol. 2018. PMID: 29223005 Free PMC article. Review.
-
Genome-scale reconstructions of the mammalian secretory pathway predict metabolic costs and limitations of protein secretion.Nat Commun. 2020 Jan 2;11(1):68. doi: 10.1038/s41467-019-13867-y. Nat Commun. 2020. PMID: 31896772 Free PMC article.
-
In situ detection of protein interactions for recombinant therapeutic enzymes.Biotechnol Bioeng. 2021 Feb;118(2):890-904. doi: 10.1002/bit.27621. Epub 2020 Nov 24. Biotechnol Bioeng. 2021. PMID: 33169829 Free PMC article.
-
Recent Advances in Engineering the Unfolded Protein Response in Recombinant Chinese Hamster Ovary Cell Lines.Int J Mol Sci. 2025 Jul 25;26(15):7189. doi: 10.3390/ijms26157189. Int J Mol Sci. 2025. PMID: 40806322 Free PMC article. Review.
References
-
- Ashburner M, Ball CA, Blake JA, Botstein D, Butler H, Cherry JM, Davis AP, Dolinski K, Dwight SS, Eppig JT, Harris MA, Hill DP, Issel-Tarver L, Kasarskis A, Lewis S, Matese JC, Richardson JE, Ringwald M, Rubin GM, Sherlock G. Gene Ontology: tool for the unification of biology. Nat Genet. 2000;25:25–9. doi: 10.1038/75556. - DOI - PMC - PubMed
Publication types
MeSH terms
LinkOut - more resources
Full Text Sources
Other Literature Sources
