

Metabolomics approaches in pancreatic adenocarcinoma: tumor metabolism profiling predicts clinical outcome of patients
- PMID: 28298227
- PMCID: PMC5353864
- DOI: 10.1186/s12916-017-0810-z
Metabolomics approaches in pancreatic adenocarcinoma: tumor metabolism profiling predicts clinical outcome of patients
Abstract
Background: Pancreatic adenocarcinomas (PAs) have very poor prognoses even when surgery is possible. Currently, there are no tissular biomarkers to predict long-term survival in patients with PA. The aims of this study were to (1) describe the metabolome of pancreatic parenchyma (PP) and PA, (2) determine the impact of neoadjuvant chemotherapy on PP and PA, and (3) find tissue metabolic biomarkers associated with long-term survivors, using metabolomics analysis.
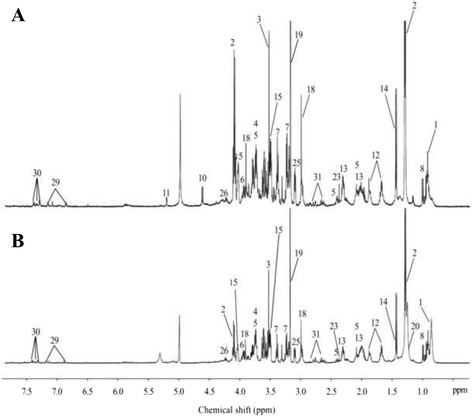
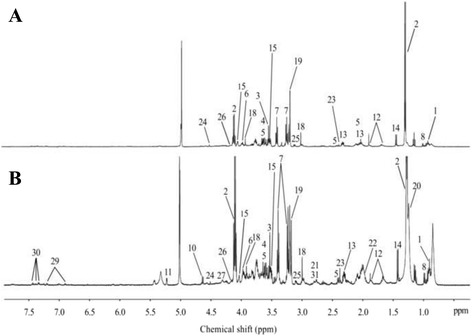
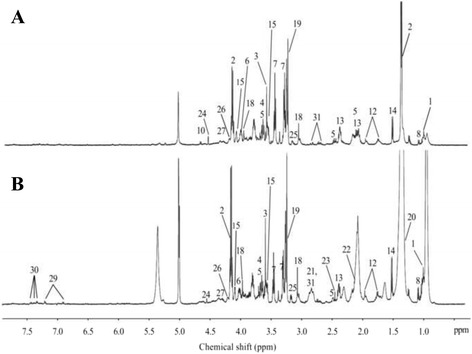
Methods: 1H high-resolution magic angle spinning (HRMAS) nuclear magnetic resonance (NMR) spectroscopy using intact tissues was applied to analyze metabolites in PP tissue samples (n = 17) and intact tumor samples (n = 106), obtained from 106 patients undergoing surgical resection for PA.
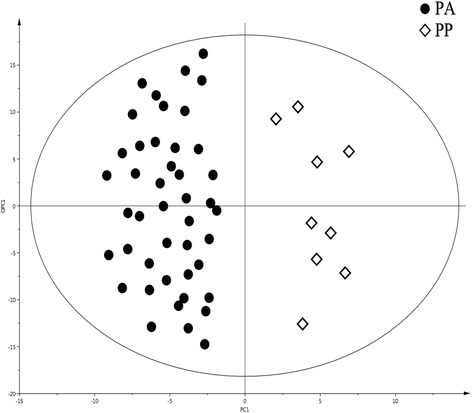
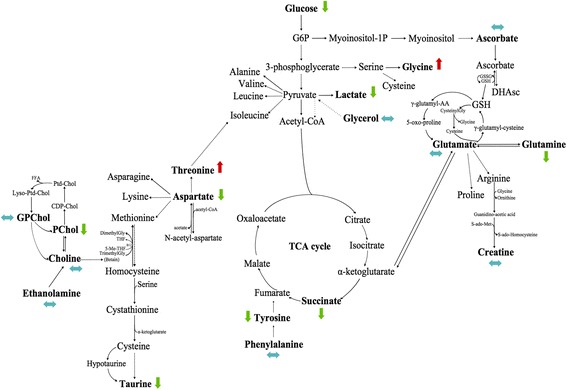
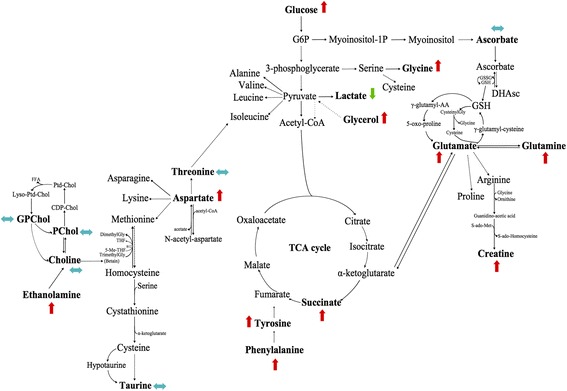
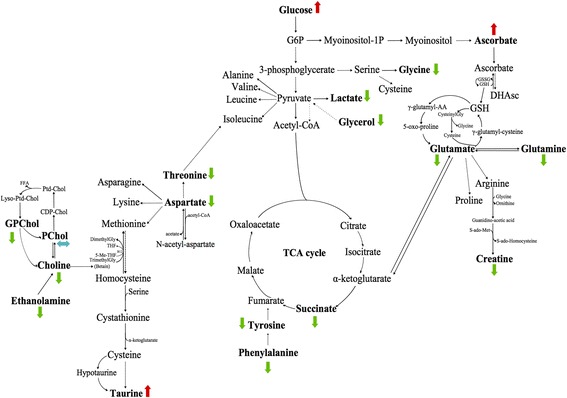
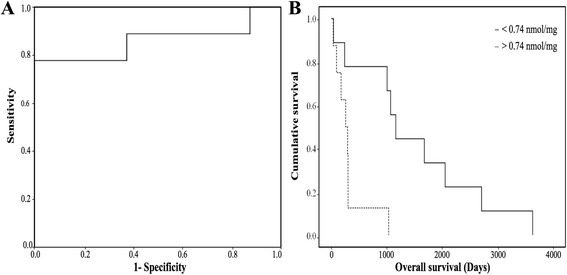
Results: An orthogonal partial least square-discriminant analysis (OPLS-DA) showed a clear distinction between PP and PA. Higher concentrations of myo-inositol and glycerol were shown in PP, whereas higher levels of glucose, ascorbate, ethanolamine, lactate, and taurine were revealed in PA. Among those metabolites, one of them was particularly obvious in the distinction between long-term and short-term survivors. A high ethanolamine level was associated with worse survival. The impact of neoadjuvant chemotherapy was higher on PA than on PP.
Conclusions: This study shows that HRMAS NMR spectroscopy using intact tissue provides important and solid information in the characterization of PA. Metabolomics profiling can also predict long-term survival: the assessment of ethanolamine concentration can be clinically relevant as a single metabolic biomarker. This information can be obtained in 20 min, during surgery, to distinguish long-term from short-term survival.
Keywords: Biomarker; HRMAS; Long-term survival; Metabolomics; NMR; Pancreatic adenocarcinoma.
Figures
Similar articles
-
Pancreatic ductal adenocarcinoma is associated with a distinct urinary metabolomic signature.Ann Surg Oncol. 2013 Dec;20 Suppl 3:S415-23. doi: 10.1245/s10434-012-2686-7. Epub 2012 Oct 25. Ann Surg Oncol. 2013. PMID: 23096698
-
1H HR-MAS NMR spectroscopy of tumor-induced local metabolic "field-effects" enables colorectal cancer staging and prognostication.J Proteome Res. 2013 Feb 1;12(2):959-68. doi: 10.1021/pr3010106. Epub 2013 Jan 16. J Proteome Res. 2013. PMID: 23240862
-
High-Resolution Magic Angle Spinning NMR-Based Metabolomics Revealing Metabolic Changes in Lung of Mice Infected with P. aeruginosa Consistent with the Degree of Disease Severity.J Proteome Res. 2018 Oct 5;17(10):3409-3417. doi: 10.1021/acs.jproteome.8b00306. Epub 2018 Sep 14. J Proteome Res. 2018. PMID: 30129763
-
Metabolomics in pancreatic cancer biomarkers research.Med Oncol. 2016 Dec;33(12):133. doi: 10.1007/s12032-016-0853-6. Epub 2016 Nov 2. Med Oncol. 2016. PMID: 27807722 Review.
-
High-resolution magic angle spinning NMR for intact biological specimen analysis: Initial discovery, recent developments, and future directions.NMR Biomed. 2023 Apr;36(4):e4684. doi: 10.1002/nbm.4684. Epub 2022 Feb 8. NMR Biomed. 2023. PMID: 34962004 Review.
Cited by
-
Characteristics of Cancer Epidemiology Studies That Employ Metabolomics: A Scoping Review.Cancer Epidemiol Biomarkers Prev. 2023 Sep 1;32(9):1130-1145. doi: 10.1158/1055-9965.EPI-23-0045. Cancer Epidemiol Biomarkers Prev. 2023. PMID: 37410086 Free PMC article.
-
Application of Proteomics in Pancreatic Ductal Adenocarcinoma Biomarker Investigations: A Review.Int J Mol Sci. 2022 Feb 14;23(4):2093. doi: 10.3390/ijms23042093. Int J Mol Sci. 2022. PMID: 35216204 Free PMC article. Review.
-
Comprehensive multi-omics profiling identifies novel molecular subtypes of pancreatic ductal adenocarcinoma.Genes Dis. 2023 Oct 14;11(6):101143. doi: 10.1016/j.gendis.2023.101143. eCollection 2024 Nov. Genes Dis. 2023. PMID: 39253579 Free PMC article. Review.
-
Integrated targeted metabolomic and lipidomic analysis: A novel approach to classifying early cystic precursors to invasive pancreatic cancer.Sci Rep. 2019 Jul 15;9(1):10208. doi: 10.1038/s41598-019-46634-6. Sci Rep. 2019. PMID: 31308419 Free PMC article.
-
Current State of "Omics" Biomarkers in Pancreatic Cancer.J Pers Med. 2021 Feb 14;11(2):127. doi: 10.3390/jpm11020127. J Pers Med. 2021. PMID: 33672926 Free PMC article. Review.
References
-
- National Cancer Institute. SEER Cancer Statistics Factsheets: Pancreas Cancer. National Cancer Institute Bethesda, MD. http://seer.cancer.gov/statfacts/html/pancreas.html. Accessed 13 May 2016.
MeSH terms
Substances
LinkOut - more resources
Full Text Sources
Other Literature Sources
Medical
Miscellaneous
