. 2017 Jun 1;117(6):2209-2217.
doi: 10.1152/jn.00031.2017. Epub 2017 Mar 15.

Differential processing of the direction and focus of expansion of optic flow stimuli in areas MST and V3A of the human visual cortex

Affiliations

Differential processing of the direction and focus of expansion of optic flow stimuli in areas MST and V3A of the human visual cortex

Samantha L Strong et al. J Neurophysiol. .

Abstract

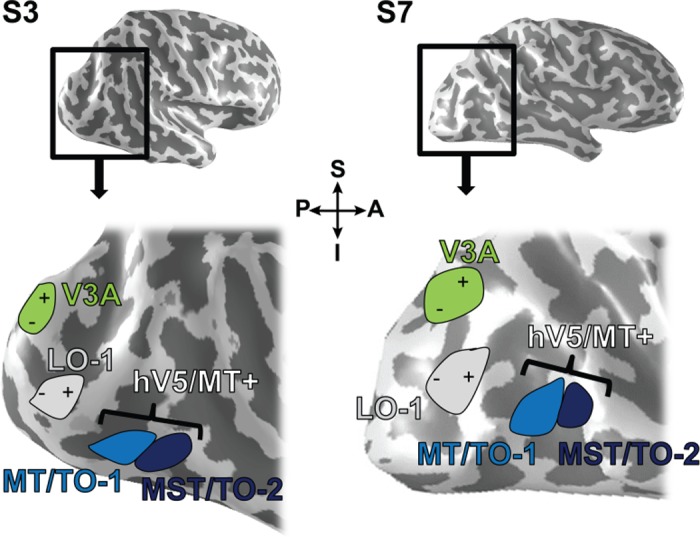
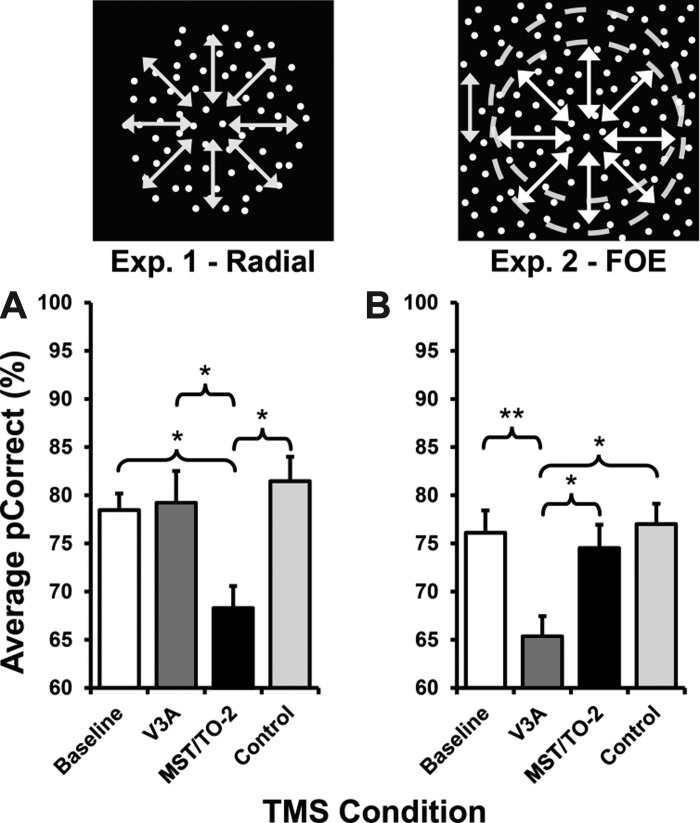
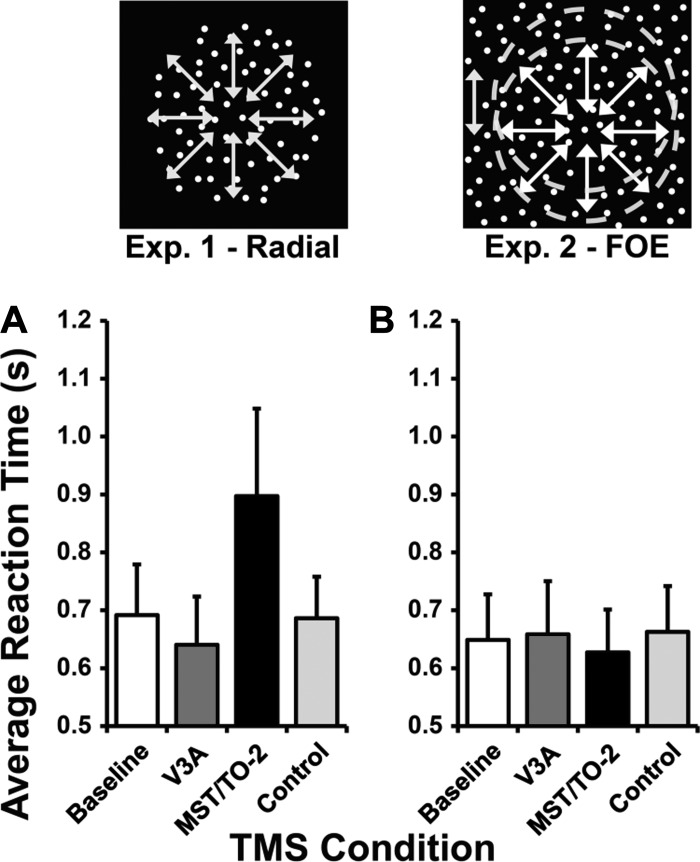
Human neuropsychological and neuroimaging studies have raised the possibility that different attributes of optic flow stimuli, namely radial direction and the position of the focus of expansion (FOE), are processed within separate cortical areas. In the human brain, visual areas V5/MT+ and V3A have been proposed as integral to the analysis of these different attributes of optic flow stimuli. To establish direct causal relationships between neural activity in human (h)V5/MT+ and V3A and the perception of radial motion direction and FOE position, we used transcranial magnetic stimulation (TMS) to disrupt cortical activity in these areas while participants performed behavioral tasks dependent on these different aspects of optic flow stimuli. The cortical regions of interest were identified in seven human participants using standard functional MRI retinotopic mapping techniques and functional localizers. TMS to area V3A was found to disrupt FOE positional judgments but not radial direction discrimination, whereas the application of TMS to an anterior subdivision of hV5/MT+, MST/TO-2 produced the reverse effects, disrupting radial direction discrimination but eliciting no effect on the FOE positional judgment task. This double dissociation demonstrates that FOE position and radial direction of optic flow stimuli are signaled independently by neural activity in areas hV5/MT+ and V3A.NEW & NOTEWORTHY Optic flow constitutes a biologically relevant visual cue as we move through any environment. With the use of neuroimaging and brain-stimulation techniques, this study demonstrates that separate human brain areas are involved in the analysis of the direction of radial motion and the focus of expansion in optic flow. This dissociation reveals the existence of separate processing pathways for the analysis of different attributes of optic flow that are important for the guidance of self-locomotion and object avoidance.

Keywords: V3A; V5/MT+; fMRI; psychophysics; transcranial magnetic stimulation.


Figures

Fig. 1.
Fig. 1.
TMS/behavioral paradigms. Experiment 1: radial motion stimuli (expanding or contracting) were presented in a circular aperture, displaced 15° to the left of a fixation cross. The onset of a repetitive train of 5 TMS pulses was coincident and coextensive with the onset of this stimulus. Following stimulus offset, the participants reported the perceived direction of the motion (in or out) by a key press. Experiment 2: each test sequence began with the onset of a reference stimulus (200 ms) comprising a circular aperture of radially expanding dots embedded in a background of randomly moving noise dots. After a 2,000-ms delay, a test stimulus was presented in which the FOE of the radial motion was displaced either upward or downward. The delivery of the TMS pulse train was coincident with the onset of the test stimulus. Following test offset, participants reported the perceived direction of FOE displacement (up or down) by a key press. ITI, intertrial interval; ISI, interstimulus interval.
Fig. 2.
Fig. 2.
Location of main cortical ROI target sites for TMS. Inflated right hemispheres for 2 subjects (S3 and S7) with overlaid positions of TMS target sites used in experiment 1 and experiment 2. The bottom figure shows a magnified view of the posterior section of the hemisphere. The representation of the visual field in each area is denoted with a symbol (“+” and “−”). +, representation of the superior (S) contralateral visual field; −, inferior (I) contralateral visual field. These markings are absent from the representations of MT/TO-1 and MST/TO-2, as the retinotopic mapping did not produce reliable maps within these regions. A, anterior; P, posterior.
Fig. 3.
Fig. 3.
Average percent correct (pCorrect) data from experiment 1 and experiment 2. Bar charts showing average pCorrect (%) across experiment 1 (A) and experiment 2 (B). Error bars represent SE; *P < 0.05, **P < 0.01 significance.
Fig. 4.
Fig. 4.
Average response time data from experiment 1 and experiment 2. Bar charts showing average response time (s) across experiment 1 (A) and experiment 2 (B). Error bars represent SE.
Fig. 5.
Fig. 5.
Correlational data for percent correct and response time from experiment 1 and experiment 2. A scatter plot showing relationship between percent correct and response time across experiment 1 (Radial) and experiment 2 (FOE).

Similar articles

Cited by

References

    1. Amano K, Wandell BA, Dumoulin SO. Visual field maps, population receptive field sizes, and visual field coverage in the human MT+ complex. J Neurophysiol 102: 2704–2718, 2009. doi:10.1152/jn.00102.2009. - DOI - PMC - PubMed
    1. Anzai A, Chowdhury SA, DeAngelis GC. Coding of stereoscopic depth information in visual areas V3 and V3A. J Neurosci 31: 10270–10282, 2011. doi:10.1523/JNEUROSCI.5956-10.2011. - DOI - PMC - PubMed
    1. Bartels A, Zeki S, Logothetis NK. Natural vision reveals regional specialization to local motion and to contrast-invariant, global flow in the human brain. Cereb Cortex 18: 705–717, 2008. doi:10.1093/cercor/bhm107. - DOI - PubMed
    1. Beardsley SA, Vaina LM. How can a patient blind to radial motion discriminate shifts in the center-of-motion? J Comput Neurosci 18: 55–66, 2005. doi:10.1007/s10827-005-5473-z. - DOI - PubMed
    1. Bradley DC, Maxwell M, Andersen RA, Banks MS, Shenoy KV. Mechanisms of heading perception in primate visual cortex. Science 273: 1544–1547, 1996. doi:10.1126/science.273.5281.1544. - DOI - PubMed