. 2017 Jul 1;118(1):114-120.
doi: 10.1152/jn.00976.2016. Epub 2017 Mar 15.

Ion diffusion may introduce spurious current sources in current-source density (CSD) analysis

Affiliations

Ion diffusion may introduce spurious current sources in current-source density (CSD) analysis

Geir Halnes et al. J Neurophysiol. .

Abstract

Current-source density (CSD) analysis is a well-established method for analyzing recorded local field potentials (LFPs), that is, the low-frequency part of extracellular potentials. Standard CSD theory is based on the assumption that all extracellular currents are purely ohmic, and thus neglects the possible impact from ionic diffusion on recorded potentials. However, it has previously been shown that in physiological conditions with large ion-concentration gradients, diffusive currents can evoke slow shifts in extracellular potentials. Using computer simulations, we here show that diffusion-evoked potential shifts can introduce errors in standard CSD analysis, and can lead to prediction of spurious current sources. Further, we here show that the diffusion-evoked prediction errors can be removed by using an improved CSD estimator which accounts for concentration-dependent effects.NEW & NOTEWORTHY Standard CSD analysis does not account for ionic diffusion. Using biophysically realistic computer simulations, we show that unaccounted-for diffusive currents can lead to the prediction of spurious current sources. This finding may be of strong interest for in vivo electrophysiologists doing extracellular recordings in general, and CSD analysis in particular.

Keywords: current source density; electrodiffusion; extracellular potential; ion diffusion.


Figures

Fig. 1.
Fig. 1.
Model system. A: a one-dimensional piece of tissue subdivided into 15 subvolumes (depth intervals). A population of 10 neurons (only one shown) occupied the interior 13 subvolumes (A1). Ionic output fluxes into all compartments were recorded in an 84 s simulation. A2A5: extracellular concentration gradients at selected time points in the simulation. A6: extracellular potential (V), low-pass filtered by taking the temporal average over the time intervals indicated in the legend. BD: fast temporal dynamics of V in the ECS subvolumes containing the apical dendrites (B), the dendritic trunks (C), and the somata (D). Different columns show snapshots of V taken at different times in the simulation. Solid lines represent simulations with the full electrodiffusive formalism, whereas dashed lines represent simulations where diffusion was not included in the ECS dynamics. The legend in A3 applies to all panels A2A5. The scale bar in B3 and legend in D3 apply to all panels in BD.
Fig. 2.
Fig. 2.
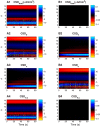
Current-source density. A: CSD at different depth levels (y-axis) as a function of time (x-axis). A1: true CSD. A2: standard CSD estimate based only on the extracellular potential. A3: CSD estimate based only on extracellular ion concentrations. A4: complete CSD estimate based on extracellular potential and ion concentrations. B2B4: error relative to true CSD (ΔCSD = CSDtrue − CSDestimate). B1: the error in the true CSD is by definition zero. In all panels, the CSD was low-pass filtered with a threshold value of 500 Hz, a typical cutoff frequency for local field potentials (Einevoll et al. 2013). Units in all panels are μA/mm3.
Fig. 3.
Fig. 3.
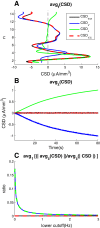
Average current-source density. A: the spatial distribution of the temporally averaged CSD estimates, avgt(CSD). B: the temporal development of the spatially averaged CSD estimates, avgz(CSD). C: temporally averaged net (spurious) current monopole erroneously estimated in system as function of lower cutoff frequency, plotted relative to the absolute values of the CSD, avgt [|avgz(CSD)|/avgz(|CSD|)]. Upper cutoff frequency was 500 Hz in all panels. Lower cutoff frequency was 0 in A and B and varied from 0 to 3 Hz in C.

Similar articles

Cited by

References

    1. Aguilella V, Mafé S, Pellicer J. On the nature of the diffusion potential derived from Nernst-Planck flux equations by using the electroneutrality assumption. Electrochim Acta 32: 483–488, 1987. doi:10.1016/0013-4686(87)85018-1. - DOI
    1. Bédard C, Destexhe A. Macroscopic models of local field potentials and the apparent 1/f noise in brain activity. Biophys J 96: 2589–2603, 2009. doi:10.1016/j.bpj.2008.12.3951. - DOI - PMC - PubMed
    1. Bédard C, Destexhe A. Generalized theory for current-source-density analysis in brain tissue. Phys Rev E Stat Nonlin Soft Matter Phys 84: 041909, 2011. doi:10.1103/PhysRevE.84.041909. - DOI - PubMed
    1. Bédard C, Destexhe A. Generalized cable theory for neurons in complex and heterogeneous media. Phys Rev E Stat Nonlin Soft Matter Phys 88: 022709, 2013. doi:10.1103/PhysRevE.88.022709. - DOI - PubMed
    1. Bédard C, Rodrigues S, Roy N, Contreras D, Destexhe A. Evidence for frequency-dependent extracellular impedance from the transfer function between extracellular and intracellular potentials: intracellular-LFP transfer function. J Comput Neurosci 29: 389–403, 2010. doi:10.1007/s10827-010-0250-7. - DOI - PubMed

Publication types

LinkOut - more resources