

Systematic protein-protein interaction mapping for clinically relevant human GPCRs
- PMID: 28298427
- PMCID: PMC5371730
- DOI: 10.15252/msb.20167430
Systematic protein-protein interaction mapping for clinically relevant human GPCRs
Erratum in
-
Author Correction: Systematic protein-protein interaction mapping for clinically relevant human GPCRs.Mol Syst Biol. 2025 Feb;21(2):208-209. doi: 10.1038/s44320-024-00080-3. Mol Syst Biol. 2025. PMID: 39762653 Free PMC article.
Abstract
G-protein-coupled receptors (GPCRs) are the largest family of integral membrane receptors with key roles in regulating signaling pathways targeted by therapeutics, but are difficult to study using existing proteomics technologies due to their complex biochemical features. To obtain a global view of GPCR-mediated signaling and to identify novel components of their pathways, we used a modified membrane yeast two-hybrid (MYTH) approach and identified interacting partners for 48 selected full-length human ligand-unoccupied GPCRs in their native membrane environment. The resulting GPCR interactome connects 686 proteins by 987 unique interactions, including 299 membrane proteins involved in a diverse range of cellular functions. To demonstrate the biological relevance of the GPCR interactome, we validated novel interactions of the GPR37, serotonin 5-HT4d, and adenosine ADORA2A receptors. Our data represent the first large-scale interactome mapping for human GPCRs and provide a valuable resource for the analysis of signaling pathways involving this druggable family of integral membrane proteins.
Keywords: G‐protein‐coupled receptors; high‐throughput screening; integrative computational biology; interactome; protein–protein interactions; split‐ubiquitin membrane yeast two‐hybrid assay.
© 2017 The Authors. Published under the terms of the CC BY 4.0 license.
Figures
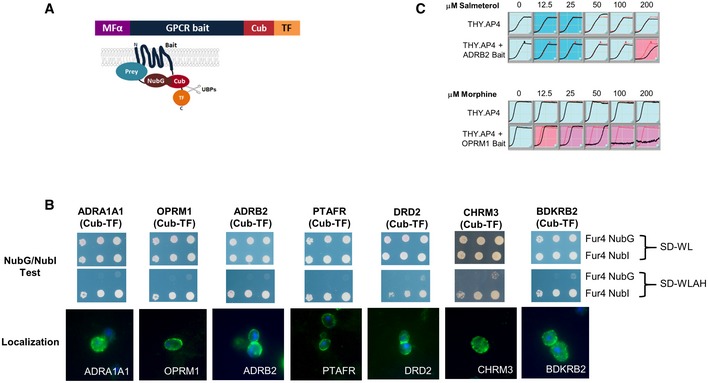
The structure of the GPCR bait proteins used in this study is shown. The signal sequence of yeast α‐mating pheromone precursor (MFα) was fused to the N‐terminus of human GPCR baits, while the C‐terminal fragment of ubiquitin (Cub) followed by an artificial transcription factor (TF) was fused to the C‐terminus of the baits.
Representative sample of functional validation/localization tests performed on all GPCR baits used in this study. The top two panels show proper expression and MYTH function of human GPCR‐Cub‐TF baits demonstrated using the NubG/NubI test. In this test, GPCR‐Cub‐TF bait and a non‐interacting yeast plasma membrane protein (Fur4p), fused to either NubI (Fur4 NubI) or NubG (Fur4 NubG) are co‐expressed in yeast MYTH‐reporter cells. Growth on minimal SD medium lacking Trp and Leu (SD‐WL, top panel) selects only for presence of bait and prey plasmids, while minimal SD medium lacking Trp, Leu, Ade, and His (SD‐WLAH, middle panel) selects for interaction between bait and prey. Co‐expression of GPCR‐Cub‐TF bait with Fur4p fused to NubI leads to activation of the reporter system and consequent growth on SD‐WLAH medium, since the wild‐type NubI leads to reconstitution of ubiquitin independent of a bait–prey interaction, demonstrating that the bait protein is expressed/correctly folded. Co‐expression of GPCR‐Cub‐TF bait and non‐interacting Fur4p fused to NubG (which does not spontaneously associate with Cub) does not lead to activation of the reporter system and growth on SD‐WLAH medium, demonstrating that the bait is not self‐activating. The bottom panel shows localization of human GPCR bait proteins in THY.AP4 yeast reporter strain. Yeast cells expressing given human GPCR baits were fixed by paraformaldehyde and digested by zymolyase. Methanol‐acetone‐treated yeast spheroplasts were detected using an antibody against the transcription factor (rabbit anti‐VP16) and were visualized by Cy3‐conjugated secondary antibodies (shown in green). DAPI‐stained nuclei can be seen as blue fluorescence. Note that similar NubGI test and localization results were obtained for all GPCR baits used in this study.
Growth inhibition of the human ADRB2 and OPRM1 baits expressed in yeast THY.AP4 in response to their corresponding agonist. Growth curves were carried out in triplicate, and curves shown are the average of three independent measurements at each individual time point. The red line shows the control yeast growth in the absence of drug, while the black line shows growth in the presence of drug. Inhibited growth in response to drug indicates GPCR activity.
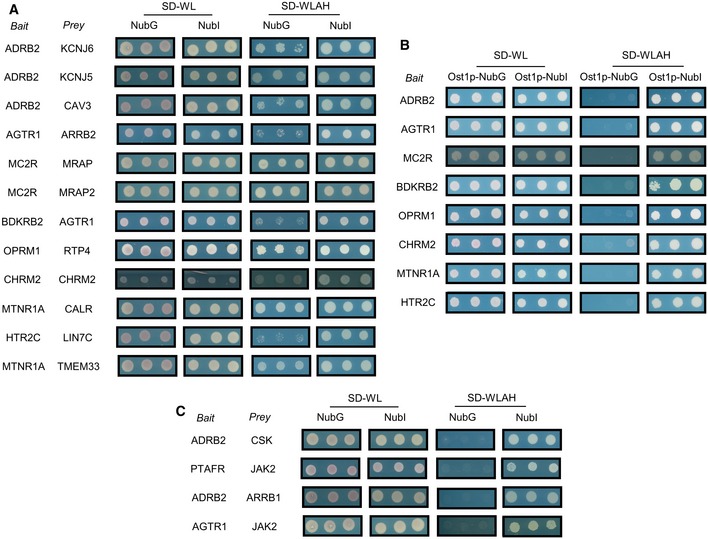
GPCR interactions confirmed by MYTH. Yeast cells were co‐transfected with GPCR bait and selected preys corresponding to previously identified interaction partners. Cells were spotted in triplicate on SD‐WL media (which selects only for presence of bait and prey plasmid) and SD‐WLAH media (which selects for interaction between bait and prey). Growth of cells on SD‐WLAH media using NubI constructs confirmed expression of prey (i.e. since NubI leads to reconstitution of split‐ubiquitin/reporter activation in the absence of a bait–prey interaction).
GPCR baits tested as above but using the non‐interacting control prey Ost1p. The lack of interaction with Ost1p‐NubG on SD‐WLAH media demonstrates the specificity of the bait interactions with preys demonstrated above.
Representative sample of previously identified GPCR interactions tested in MYTH but which could not be confirmed (see Table EV2 for complete list).
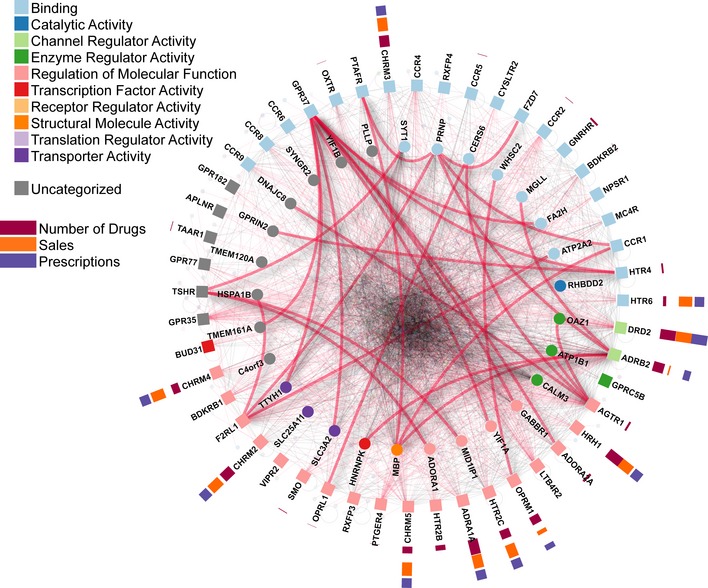
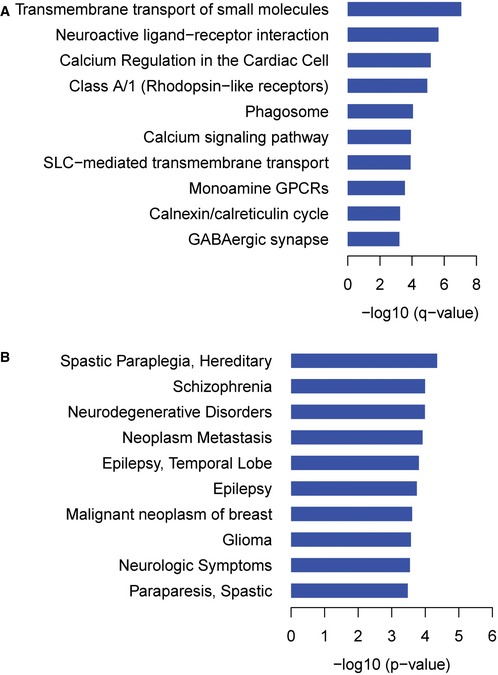
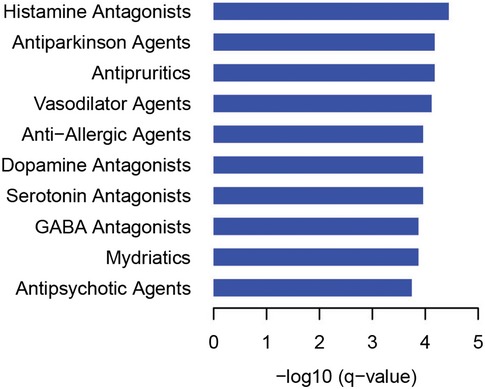
Pathways significantly enriched among baits and preys.
Most highly represented diseases among preys based on unadjusted P‐values.
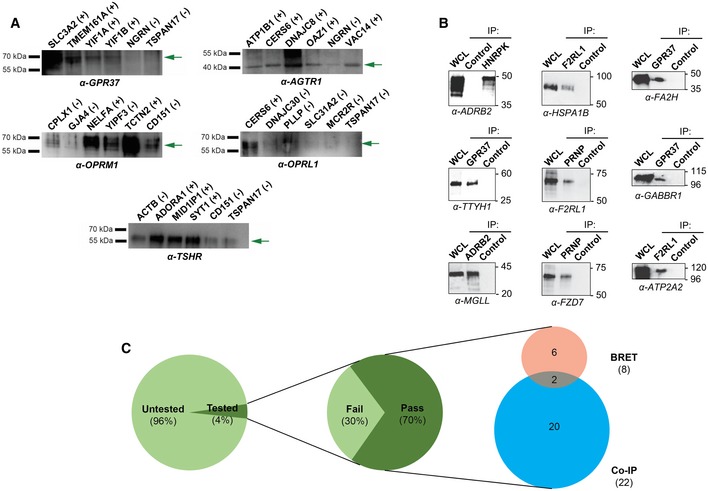
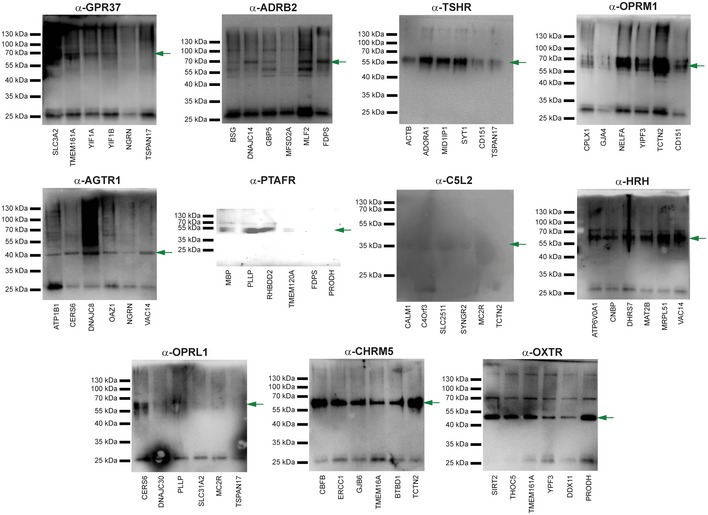
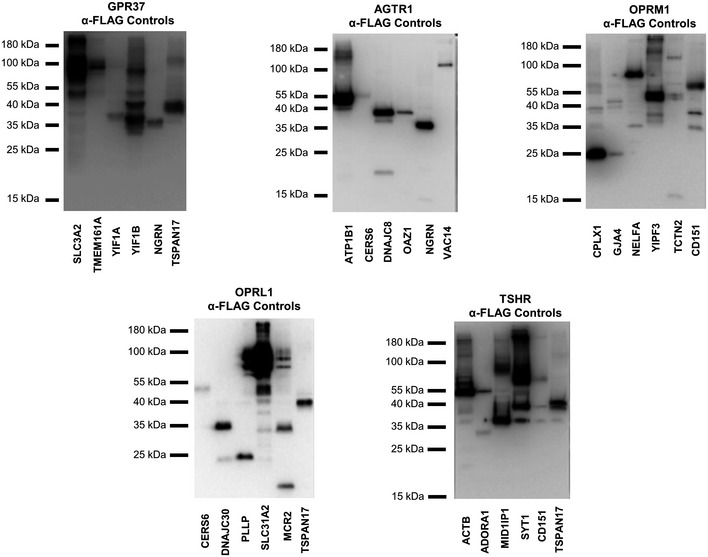
Co‐immunoprecipitations were performed using α‐FLAG antibody directed against overexpressed FLAG‐tagged protein corresponding to either MYTH‐identified interactor (first four lanes) or negative control (last two lanes), followed by Western blotting using antibody directed against the corresponding putative GPCR protein interaction partner (listed below each blot). All blots shown here produced no more than background signal in at least one negative control sample, making them suitable for use in validation of MYTH‐detected interactions. (+) indicates an interaction was detected by co‐IP. (−) indicates no interaction was detected by co‐IP. Green arrows point to the band corresponding to the indicated GPCR.
Co‐immunoprecipitations were performed using native antibody directed against the interaction partner indicated below each blot, followed by Western blotting using native antibody directed against the other member of the interacting pair. All proteins were endogenously expressed. WCL, whole‐cell lysate. Control, pull‐down using beads only.
A total of 40 MYTH‐detected interactions were successfully tested by co‐immunoprecipitation or BRET and 28 were validated, a success rate of 70%. Of the 40 interactions, 34 were tested by co‐immunoprecipitation approaches and 22 of these were validated, a success rate of 64.7%. BRET was used to test eight interactions, including two tested by co‐immunoprecipitation, and all were validated.

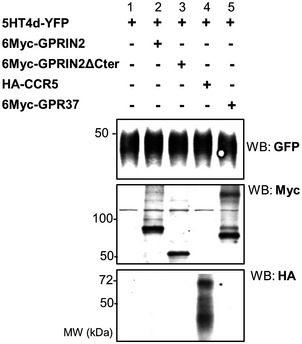
Co‐immunoprecipitation in the presence and absence of 1 μM 5‐HT agonist for 15 min. HEK‐293 cells were transiently transfected with 5‐HT4d‐YFP (lanes 2, 3, 5, 6) and myc‐GPRIN2 (lanes 1–3) or GPR37 (lanes 4–6) and processed for immunoprecipitation using an anti‐GFP antibody. The crude extracts (lysate) and immunoprecipitates (IP) were analyzed by SDS‐PAGE and immunoblotted using a rabbit anti‐GFP or anti‐Myc antibody. Data are representative of at least two independent experiments.
BRET donor saturation curves were performed by co‐transfecting a fixed amount of 5‐HT4d‐Rluc and increasing amounts of 5‐HT4d‐YFP, GPR37‐YFP, and GPRIN2‐YFP in HEK‐293 cells. Data are means of three independent experiments performed in triplicate.
Co‐expression of HeLa cells transfected with 5‐HT4d‐YFP (green) and myc‐GPR37 or myc‐GPRIN2 (red) and analyzed by confocal microscopy. Superimposition of images (merge) reveals co‐distribution in orange and DAPI‐stained nuclei in blue. Scale bar: 15 μm. Data are representative of at least two independent experiments.
ERK1/2 activation in HEK‐293 cells over time in response to 10 μM 5‐HT agonist and the presence of overexpressed 5‐HT4d and GPRIN2, GPR37, or CCR5. CCR5 is used as a negative control. The bottom panel shows ERK1/2 activation over time, in the presence of overexpressed β2‐adrenergic receptor and GPRIN2 or GPR37. Data are means of three independent experiments performed in triplicate.
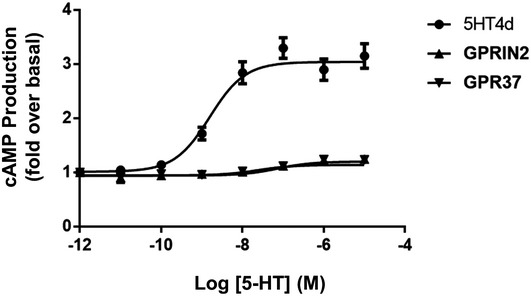
Cyclic AMP levels in HEK‐293 cells, in response to increasing concentrations of serotonin agonist and the presence of overexpressed 5‐HT4d and GPRIN2, GPR37, or CCR5. CCR5 is used as a negative control. The right panel shows cAMP levels in response to increasing isoproterenol concentrations, in the presence of overexpressed β2‐adrenergic receptor and GPRIN2 or GPR37. Data are means of three independent experiments performed in triplicate. Error bars indicate SEM.
- A
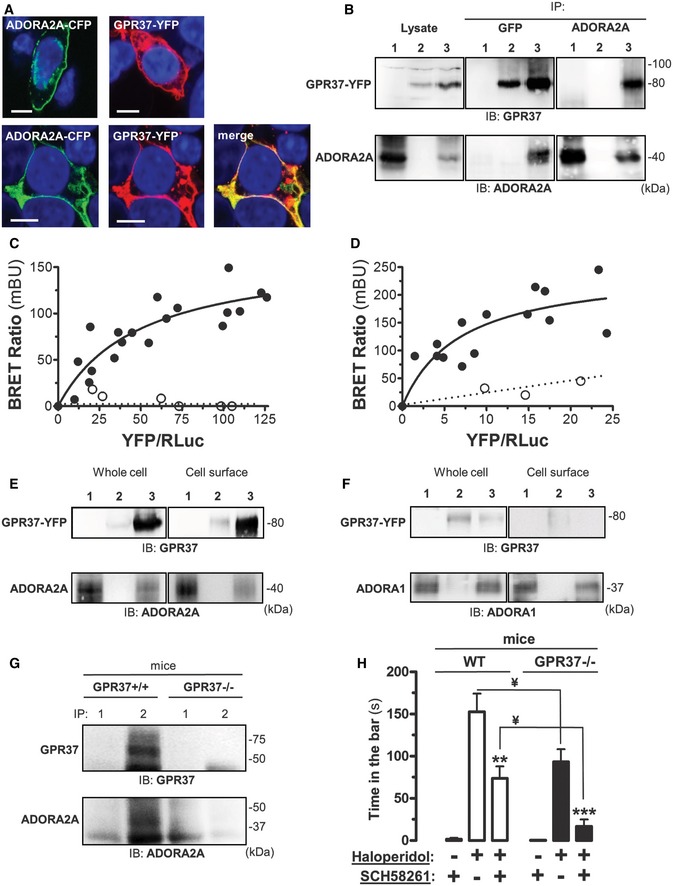
Co‐localization of ADORA2A and GPR37 in HEK‐293 cells transiently transfected with ADORA2A‐CFP, GPR37‐YFP, or ADORA2A‐CFP plus GPR37‐YFP. Transfected cells were analyzed by confocal microscopy. Merged images reveal co‐distribution of ADORA2A‐CFP and GPR37‐YFP (yellow) and DAPI‐stained nuclei (blue). Scale bar: 10 μm.
- B
Co‐immunoprecipitation of ADORA2A and GPR37 from HEK‐293 transiently transfected with ADORA2A (lane 1), GPR37‐YFP (lane 2) or ADORA2A plus GPR37‐YFP (lane 3) using a mouse anti‐GFP antibody (2 μg/ml) or a mouse anti‐A2AR antibody (1 μg/ml). The crude extracts (Lysate) and immunoprecipitates (IP) were analyzed by SDS–PAGE and immunoblotted (IB) using a rabbit anti‐GPR37 (1/2,000) or rabbit anti‐A2AR antibody (1/2,000).
- C, D
BRET saturation experiments between GPR37‐Rluc and ADORA2A‐YFP (black circle) or ADORA1‐YFP (white circle; C), or ADORA2A‐Rluc and GPR37‐YFP (black circle) or CD4R‐YFP control (white circle; D) in transiently transfected HEK‐293. Plotted on the x‐axis is the fluorescence value obtained from the YFP, normalized with the luminescence value of the Rluc constructs 10 min after h‐coelenterazine (5 μM) incubation, and on the y‐axis the corresponding BRET ratio (×1,000). mBU, mBRET units. Data shown are from three independent experiments.
- E
Cell surface expression of HEK‐293 cells transiently transfected with cDNA encoding ADORA2A (lane 1), GPR37‐YFP (lane 2) or ADORA2A plus GPR37‐YFP (lane 3). Cell surface proteins were biotinylated and crude extracts (whole cell) and biotinylated proteins were subsequently analyzed by SDS–PAGE and immunoblotted (IB) using a rabbit anti‐GPR37 antibody (1/2,000) or a rabbit anti‐A2AR antibody (1/2,000).
- F
Cell surface expression of HEK‐293 cells transiently transfected with cDNA encoding ADORA1 (lane 1), GPR37‐YFP (lane 2), or ADORA1 plus GPR37‐YFP (lane 3). Cell surface proteins were biotinylated and crude extracts (whole cell) and biotinylated proteins were subsequently analyzed by SDS‐PAGE and immunoblotted (IB) using a rabbit anti‐GPR37 antibody (1/2,000) or a rabbit anti‐A1R antibody (1/2,000).
- G
Co‐immunoprecipitation of ADORA2A and GPR37 from C57BL/6J wild‐type (GPR37+/+) and mutant (GPR37−/−) mice striatum using a rabbit anti‐FLAG antibody (4 μg/ml; lane 1) or a rabbit anti‐GPR37 antibody (4 μg/ml; lane 2). The immunoprecipitates (IP) were analyzed by SDS‐PAGE and immunoblotted (IB) using a rabbit anti‐GPR37 (1/2,000) or mouse anti‐A2AR antibody (1/2,000).
- H
Involvement of GPR37 in haloperidol‐induced catalepsy. The influence of systemic injection of ADORA2A antagonist SCH 58261 (1 mg/kg, i.p.) on the catalepsy induced by haloperidol (1.5 mg/kg i.p.) was assessed in both WT (GPR37+/+) and mutant (GPR37−/−) mice as described in Materials and Methods. The data indicate the mean ± SEM (n = 6 per group). Asterisks denote data significantly different from the haloperidol‐treated mice: **P < 0.01 and ***P < 0.001 by one‐way ANOVA with Bonferroni multiple comparison post hoc test. In the GPR37−/− mice, the haloperidol plus SCH 58261 group were not significantly different (P > 0.05) from the control (i.e. SCH 58261 alone). ¥ P < 0.01 by two‐way ANOVA with Bonferroni multiple comparison post hoc test for genotype and treatment comparisons.
References
-
- Alexa A, Rahnenfuhrer J (2016) topGO: enrichment analysis for gene ontology. R Package. Version 2.24.0
-
- Ashburner M, Ball CA, Blake JA, Botstein D, Butler H, Cherry JM, Davis AP, Dolinski K, Dwight SS, Eppig JT, Harris MA, Hill DP, Issel‐Tarver L, Kasarskis A, Lewis S, Matese JC, Richardson JE, Rubin GM, Sherlock G (2000) Gene ontology: tool for the unification of biology. Nat Genet 25: 25‐29 - PMC - PubMed
-
- Beninger RJ (1983) The role of dopamine in locomotor activity and learning. Brain Res 287: 173–196 - PubMed
-
- Benleulmi‐Chaachoua A, Chen L, Sokolina K, Wong V, Jurisica I, Emerit MB, Darmon M, Espin A, Stagljar I, Tafelmeyer P, Zamponi GW, Delagrange P, Maurice P, Jockers R (2016) Protein interactome mining defines melatonin MT1 receptors as integral component of presynaptic protein complexes of neurons. J Pineal Res 60: 95–108 - PubMed
Publication types
MeSH terms
Substances
Grants and funding
LinkOut - more resources
Full Text Sources
Other Literature Sources
Molecular Biology Databases
