. 2017 Jun 9;292(23):9840-9854.
doi: 10.1074/jbc.M117.780585. Epub 2017 Mar 15.

Single-cell analysis reveals lineage segregation in early post-implantation mouse embryos

Affiliations

Single-cell analysis reveals lineage segregation in early post-implantation mouse embryos

Jing Wen et al. J Biol Chem. .

Abstract

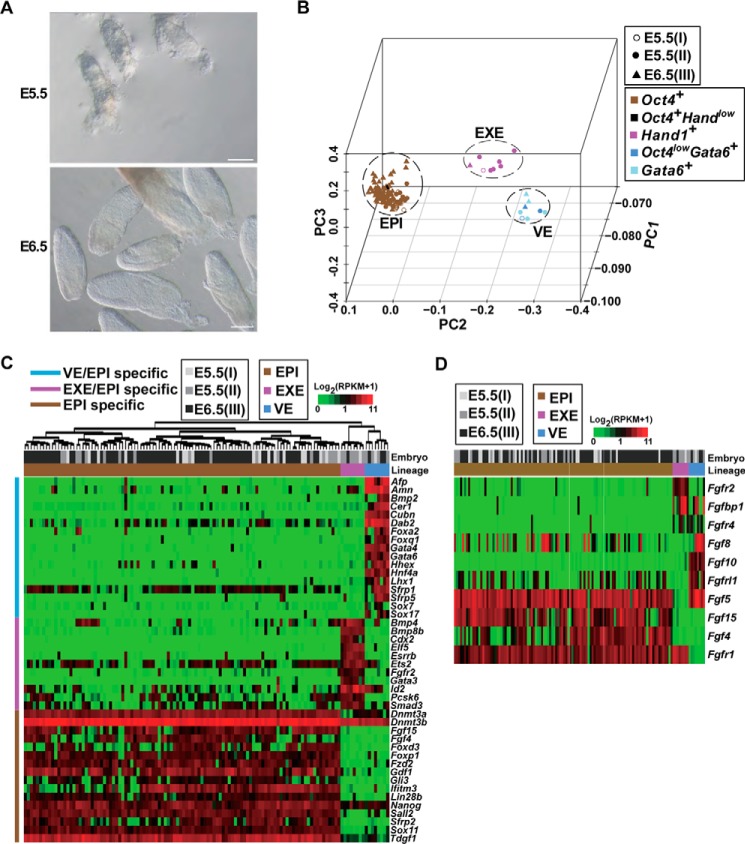
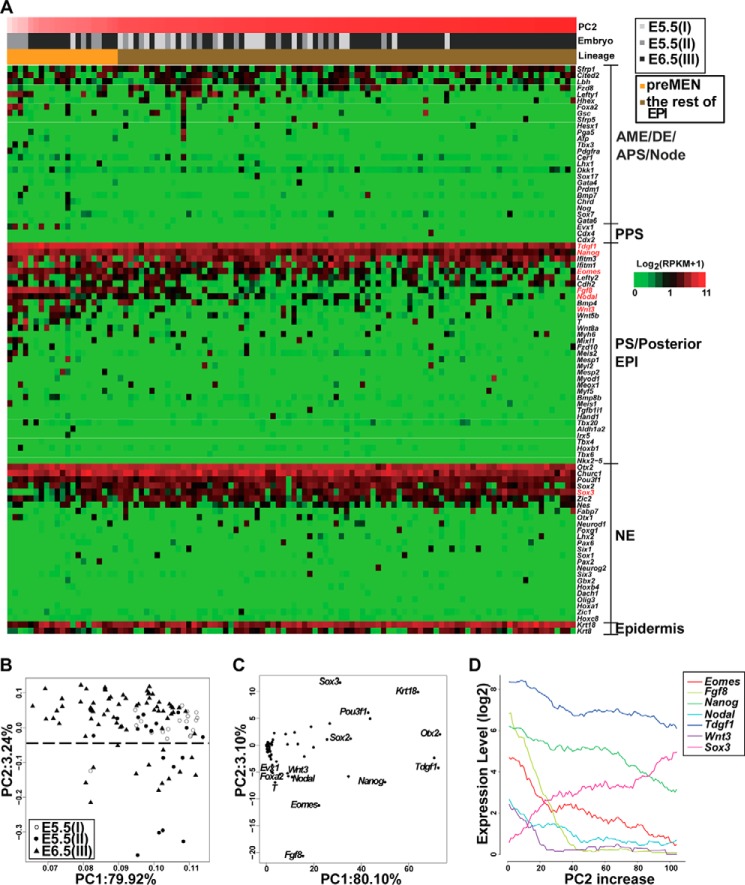
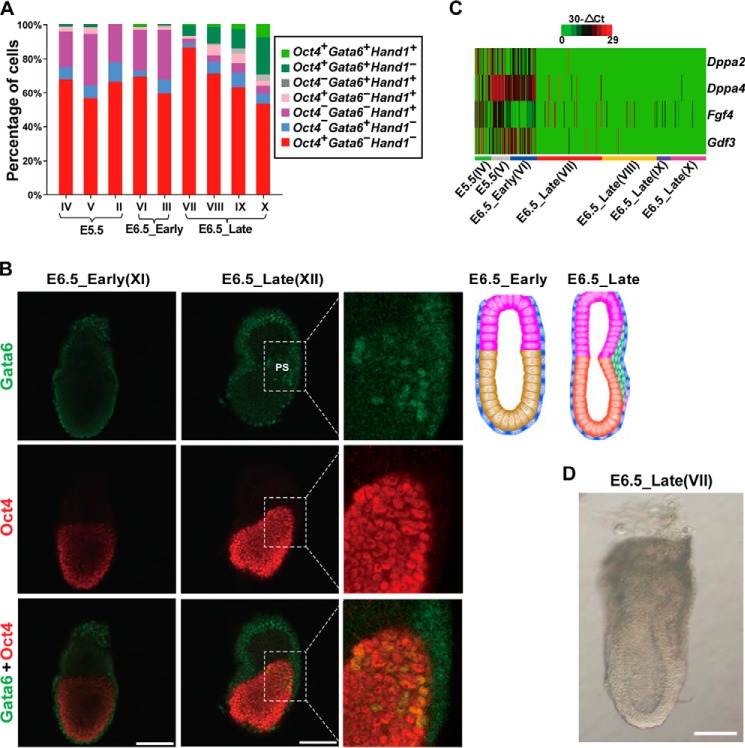
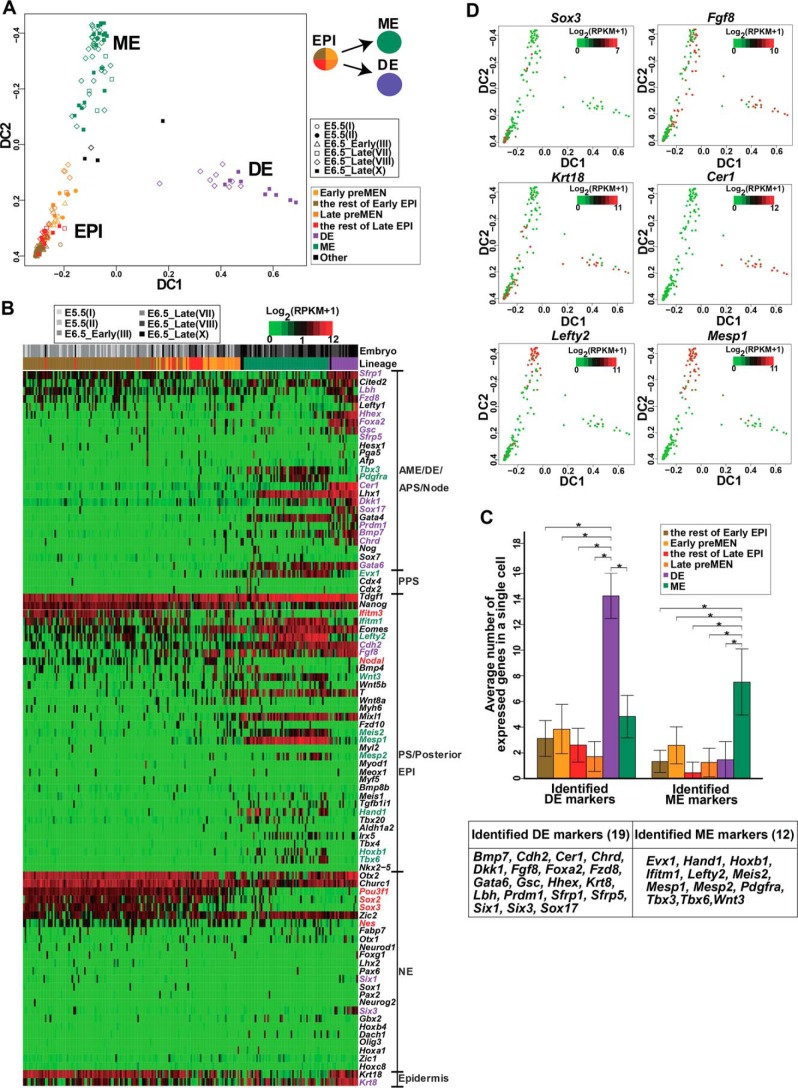
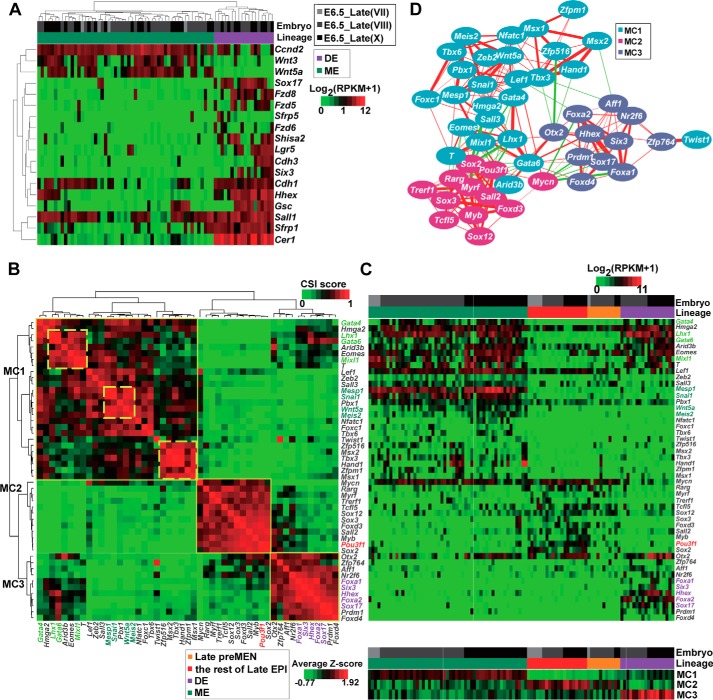
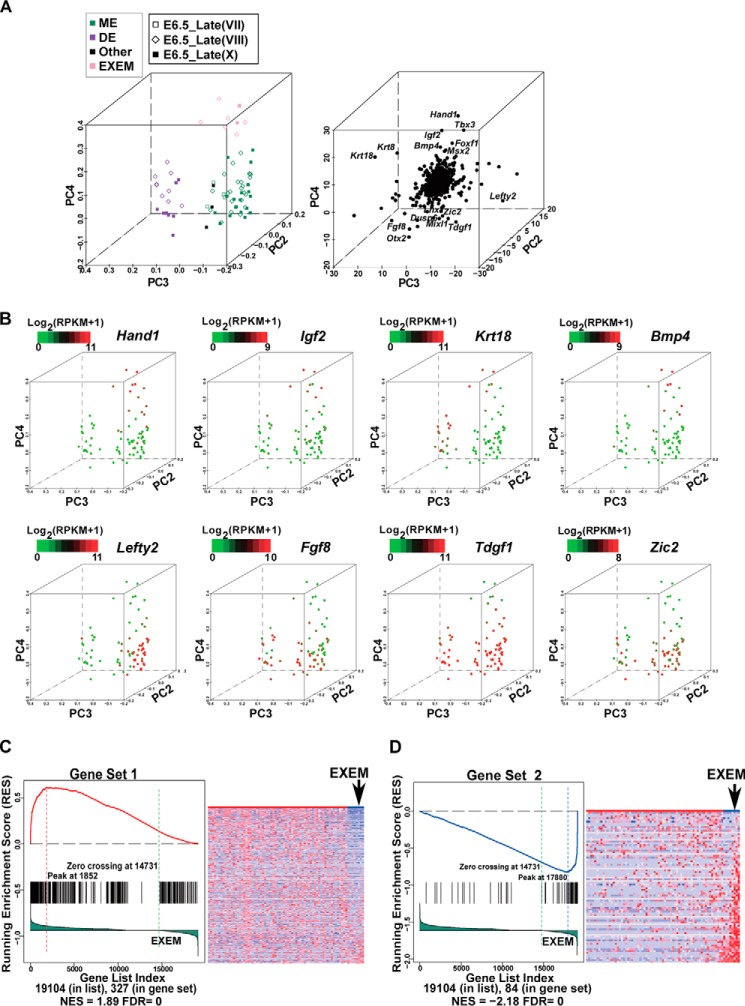
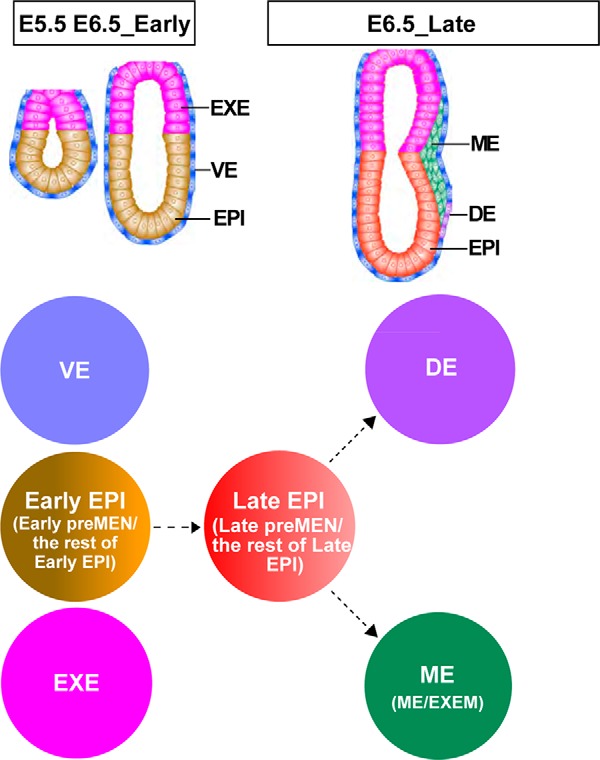
The mammalian post-implantation embryo has been extensively investigated at the tissue level. However, to unravel the molecular basis for the cell-fate plasticity and determination, it is essential to study the characteristics of individual cells. In particular, the individual definitive endoderm (DE) cells have not been characterized in vivo Here, we report gene expression patterns in single cells freshly isolated from mouse embryos on days 5.5 and 6.5. Initial transcriptome data from 124 single cells yielded signature genes for the epiblast, visceral endoderm, and extra-embryonic ectoderm and revealed a unique distribution pattern of fibroblast growth factor (FGF) ligands and receptors. Further analysis indicated that early-stage epiblast cells do not segregate into lineages of the major germ layers. Instead, some cells began to diverge from epiblast cells, displaying molecular features of the premesendoderm by expressing higher levels of mesendoderm markers and lower levels of Sox3 transcripts. Analysis of single-cell high-throughput quantitative RT-PCR data from 441 cells identified a late stage of the day 6.5 embryo in which mesoderm and DE cells emerge, with many of them coexpressing Oct4 and Gata6 Analysis of single-cell RNA-sequence data from 112 cells of the late-stage day 6.5 embryos revealed differentially expressed signaling genes and networks of transcription factors that might underlie the segregation of the mesoderm and DE lineages. Moreover, we discovered a subpopulation of mesoderm cells that possess molecular features of the extraembryonic mesoderm. This study provides fundamental insight into the molecular basis for lineage segregation in post-implantation mouse embryos.

Keywords: definitive endoderm; development; differentiation; embryo; extraembryonic mesoderm; gastrulation; gene regulation; mesoderm; single-cell RNA-Seq; transcriptomics.


Conflict of interest statement

The authors declare that they have no conflicts of interest with the contents of this article

Figures

Figure 1.
Figure 1.
Molecular characterizations of EPI, VE, and EXE cell types in early post-implantation embryos. A, images of E5.5 and E6.5 embryos. Scale bars, 100 μm. B, PC projections of 124 initially sequenced cells collected from embryos I, II, and III with transcriptome data as an input. Different symbols are used to indicate the embryo membership of sequenced cells, and different colors of the symbol are used to present the key molecular feature of the cells in terms of expression of Oct4, Gata6, and Hand1. RPKM >1 was considered expressed. Cells expressing Oct4, Gata6, and Hand1 formed distinct clusters, which were defined as the EPI, VE, and EXE, respectively. Most of the cells expressed only one of the markers (indicated by brown, rose, or light blue colors), except three VE cells that expressed a high level of Gata6 and a low level of Oct4 (indicated by a deep blue color) and one EPI cell that expressed a high level of Oct4 and a low level of Hand1 (indicated by black color). C, the heatmap showing expression patterns of representative specific genes in EPI, VE, and EXE cells. The whole list of genes specific to each cell type is provided in supplemental Table S2. The upper bar indicates the embryo membership of cells, and the lower bar indicates the lineage of cells. The left-hand-side bar indicates different categories of specific genes. Cells were clustered by the euclidian distance and ward linkage. D, differentially expressed FGF ligands and receptors in EPI, VE, and EXE cells, which are arranged in the same order and denoted in the same way as in C.
Figure 2.
Figure 2.
Identification and analysis of the pre-MEN subgroup in EPI cells. A, heatmap showing distribution of 90 germ-layer markers in 108 EPI cells collected from embryos I–III. The markers were classified into five categories as indicated on the right side. The bars above the heatmap indicate PC2 scores, the embryo membership, and lineages of cells, respectively. Cells are arranged according to their PC2 scores (B) so that pre-MEN cells are on the left. Fgf8, Eomes, Nanog, Tdgf1, Wnt3, Nodal, and Sox3 are colored in red. B, the PCA of 108 EPI cells by 90 germ-layer markers. A dashed line was drawn according to the clustering of cells. The cells below the dashed line were named pre-MEN cells. C, PC projections of 90 germ-layer markers. There are mainly MEN markers in the bottom region of PC2 axis, whereas NE marker Sox3 is in the top region of the PC2 axis. D, a negative correlation between Sox3 and MEN markers in sequenced cells. For clarity, only some of the genes at the two ends of the PC2 axis in C are shown. The cells on the x axis were sorted according to their projection scores for the PC2 so that pre-MEN cells below the dashed line in B are on the left, and the other EPI cells are on the right. The traces represent moving averages of the given gene's expression level in overlapping windows of 20 cells.
Figure 3.
Figure 3.
E6.5_Late embryos exhibit distinct molecular characteristics. A, increase in the percentages of Oct4+ Gata6+ cells in E6.5_Late embryos. The levels of Oct4, Gata6, and Hand1 were measured by qRT-PCR. The percentage of cells being single, double, or triple positive for Oct4, Gata6, and Hand1 are shown in different colors. The percentage of Oct4+ Gata6+ cells (including Oct4+Gata6+Hand1 cells and Oct4+Gata6+Hand1+ cells, indicated by deep and light green colors, respectively), increased in cells from E6.5_Late embryos (embryos VII, VIII, IX, and X), compared with cells from E5.5 and E6.5_Early embryos (embryos II, III, IV, V, and VI). Embryo I was an E5.5 embryo, for which the expression of Oct4, Gata6, and Hand1 was only partially analyzed. Thus, cells from the embryo I were not used in the statistical analysis in A. B, coexpression of Gata6 and Oct4 in an E6.5_Late embryo (XII) but not in an E6.5_Early embryo (XI). Whole embryos were double-immunostained with anti-Oct4 and anti-Gata6 antibodies. Confocal images were acquired as z-stacks of xy images. However, only one of the xy images is shown for clarity. Images containing Gata6 staining were processed once by the median filter (at the parameter 3*3) in the Image-Pro Plus software to reduce background noises. Schematic figures of E6.5_Early and E6.5_Late embryos are shown on the right side. Scale bars, 100 μm. C, the heatmap showing the decrease in the expression of some pluripotency markers in E6.5_Late embryos. Only cells being single-positive for Oct4 (Oct4+Gata6Hand1) were included in the analysis. The levels of Fgf4, Dppa2, Dppa4, and Gdf3 were measured by single-cell high-throughput qRT-PCR and normalized to the level of Gapdh. D, an image of the embryo E6.5_Late (VII). Scale bar, 100 μm.
Figure 4.
Figure 4.
Segregation of ME and DE lineages in cells from E6.5_Late embryos. A, diffusion map representation of 214 sequenced cells, including 108 cells from E6.5_Early embryos (I, II, and III) and 106 cells from E6.5_Late_embryos (VII, VIII, and X). The 214 cells were identified to be embryonic cells in supplemental Fig. S4A. The same 90 germ-layer markers used in Fig. 2A were used as the input. The first two diffusion components (DC1 and DC2) are shown. Shapes indicate the embryo membership of cells, and colors indicate the lineages. Clusters are designated as the EPI, DE, and ME according to markers enriched in them. The Early pre-MEN and the rest of Early EPI cells were from E5.5 and E6.5_Early embryos (I, II, and III), defined according to the position of cells on the PCA map (see Fig. 2B). Late pre-MEN and the rest of Late EPI cells were from E6.5_Late embryos (VII, VIII, and X), defined here according to the distance to the branching point of DE and ME cells. Therefore, the EPI cluster contains four subgroups: Early Pre-MEN, the rest of Early EPI, Late pre-MEN, and the rest of Late EPI. B, the heatmap showing expression patterns of 90 germ-layer markers in 214 embryonic cells. The bars above the heatmap indicate the embryo membership and lineages, respectively. Cells are arranged according to their positions on the diffusion map as in A, with EPI cells and ME cells arranged from the bottom to top of the DC2 axis, and DE cells arranged from the left to right of the DC1 axis. Markers are arranged and grouped in the same way as in Fig. 2A. The markers specific for EPI, ME, and DE groups (against the other two groups, Mann-Whitney U test, FDR <0.05) are highlighted in red, green, and purple, respectively. C, statistical analysis revealing coexpressed patterns of DE and ME marker genes in DE and ME cells, respectively. DE and ME markers are highlighted as in B and are listed in the lower panel. The average number of expressed DE and ME markers (RPKM >1) in a single cell of each cell type (Early pre-MEN, the rest of Early EPI, Late pre-MEN, the rest of Late EPI, DE, and ME) was calculated and displayed. Data are represented as mean ± S.D. The number of expressed DE and ME markers significantly increased (Mann-Whitney U test, p < 0.01, denoted by stars) in DE and ME cells, respectively, compared with the other types of cells. D, expression patterns of several genes across the developmental trajectories. The expression levels of individual genes were overlaid onto the diffusion plot.
Figure 5.
Figure 5.
Differential expression of Wnt signaling genes in DE and ME cells and TF regulatory networks in E6.5_Late cells. A, differential expression of Wnt signaling genes in ME and DE cells. B, hierarchical clustering by the CSI of differentially expressed TFs. The genes formed three module cliques (MC1–3). The names of TFs specific for the EPI, DE, and ME (higher than the other two lineages) are highlighted in red, purple, and deep green, respectively. The names of TFs enriched in both DE and ME (compared with EPI) are highlighted in light green. Three submodule cliques (sMC1–3) are also denoted. C, heatmaps display the expression of differentially expressed TFs. The upper panel is a heatmap showing the expression of each TF in each cell. Genes are arranged in the same sequence as in B. The lower panel is a heatmap showing the average expression values (after z-score normalization) of MC1-, MC2-, and MC3-TFs in each cell. The bars above the heatmap denote the embryo membership and lineage. Cells are arranged according to lineages and embryos, not hierarchically clustered. D, coexpression network of TFs based on CSI values (CSI >0.7). MC1, MC2, and MC3 genes are denoted by different colored nodes. Edge weights are proportional to the CSI values of two correlated nodes. Red lines indicate positive correlation, and green lines indicate negative correlation.
Figure 6.
Figure 6.
Identification of EXEM cells in E6. 5_Late embryos. A, the PCA of 75 identified MEN cells by 822 germ-layer markers. The projection components PC2-PC3-PC4 are displayed. The 75 cells were from the DE, ME, and Other clusters shown in Fig. 4A. Expression levels of the 822 germ-layer markers determined by RNA-Seq were used as the input. The left panel is PC projections of cells. Cells clustered at the top end of PC4 are marked by the light rose, denoting putative EXEM cells. The right panel is PC projection of genes. Some genes with extreme PC4 loadings are shown. B, expression patterns of representative genes overlaid on the PCA map. Cells at the top of the PC4 axis in A exhibit distinct gene expression patterns from the rest of MEN cells. C, GSEA reveals similarities between genes down-regulated in E6.5_Late EXEM cells and those down-regulated in E7.0 EXEM cells. Genes down-regulated in E7.0 EXEM cells as compared with the rest of E7.0 ME cells were obtained from the published data (27), designated as “Gene Set 1,” including 330 genes. The cells in A were divided into EXEM cells and the rest of MEN cells. All genes (the total number was 19,104) were ranked according to the correlation with the classification of the two groups. The lower portion of the left figure shows the rank-ordered genes for EXEM cells compared with the rest of MEN cells, with genes being highly down-regulated to the far left and up-regulated genes to the right. Each black line represents a hit from Gene Set 1 in the rank-ordered gene list. The upper part of the left panel shows the running enrichment score (RES), which was calculated by walking down the rank-ordered gene list, and increasing the score when a gene was met in the Gene Set 1 and decreasing it when it is not. The NES and the FDR, which reflect the correlations in GSEA, were calculated and exhibited in the bottom region. The right panel is a heatmap revealing the expression of 330 genes of Gene Set 1 in EXEM cells and the rest of MEN cells. Genes are ordered according to their ranks in the left panel, and cells are ordered according to their PC4 loadings in A. D, GSEA reveals similarities between genes up-regulated in E6.5_Late EXEM cells and those up-regulated in E7.0 EXEM cells. Genes up-regulated in E7.0 EXEM cells as compared with the rest of E7.0 ME cells were obtained from the published data (27), designated as “Gene Set 2,” including 84 genes. All genes (the total number was 19,104) were ranked and arranged in the same way as in C. Each black line represents a hit from the Gene Set 2 in the rank-ordered gene list. The RES, NES, and FDR values are shown. The right panel is a heatmap revealing the expression of 84 genes of Gene Set 2 in EXEM and the rest of MEN cells. Genes are ordered according to their ranks in the left panel, and cells are ordered according to their PC4 loadings in A.
Figure 7.
Figure 7.
Schematic presentation of cell populations analyzed in this study. The distinct lineages are marked by different colors. The Early EPI are EPI cells from E5.5 and E6.5_Early embryos, containing Early pre-MEN and the rest of Early EPI; the Late EPI are EPI cells from E6.5_Late embryos, containing Late pre-MEN and the rest of Late EPI. The ME is also a mixed population, containing the EXEM and ME. Dashed lines are used to denote the putative relationship among different populations.

References

    1. Tam P. P., and Loebel D. A. (2007) Gene function in mouse embryogenesis: get set for gastrulation. Nat. Rev. Genet. 8, 368–381 - PubMed
    1. Guo G., Huss M., Tong G. Q., Wang C., Li Sun L., Clarke N. D., and Robson P. (2010) Resolution of cell fate decisions revealed by single-cell gene expression analysis from zygote to blastocyst. Dev. Cell 18, 675–685 - PubMed
    1. Yan L., Yang M., Guo H., Yang L., Wu J., Li R., Liu P., Lian Y., Zheng X., Yan J., Huang J., Li M., Wu X., Wen L., Lao K., et al. (2013) Single-cell RNA-Seq profiling of human preimplantation embryos and embryonic stem cells. Nat. Struct. Mol. Biol. 20, 1131–1139 - PubMed
    1. Ohnishi Y., Huber W., Tsumura A., Kang M., Xenopoulos P., Kurimoto K., Oleś A. K., Araúzo-Bravo M. J., Saitou M., Hadjantonakis A. K., and Hiiragi T. (2014) Cell-to-cell expression variability followed by signal reinforcement progressively segregates early mouse lineages. Nat. Cell Biol. 16, 27–37 - PMC - PubMed
    1. Boroviak T., Loos R., Lombard P., Okahara J., Behr R., Sasaki E., Nichols J., Smith A., and Bertone P. (2015) Lineage-specific profiling delineates the emergence and progression of naive pluripotency in mammalian embryogenesis. Dev. Cell 35, 366–382 - PMC - PubMed

Publication types

MeSH terms