. 2017 Apr 28;292(17):7115-7130.
doi: 10.1074/jbc.M116.762567. Epub 2017 Mar 15.

The short variant of the mitochondrial dynamin OPA1 maintains mitochondrial energetics and cristae structure

Affiliations

The short variant of the mitochondrial dynamin OPA1 maintains mitochondrial energetics and cristae structure

Hakjoo Lee et al. J Biol Chem. .

Abstract

The protein optic atrophy 1 (OPA1) is a dynamin-related protein associated with the inner mitochondrial membrane and functions in mitochondrial inner membrane fusion and cristae maintenance. Inner membrane-anchored long OPA1 (L-OPA1) undergoes proteolytic cleavage resulting in short OPA1 (S-OPA1). It is often thought that S-OPA1 is a functionally insignificant proteolytic product of L-OPA1 because the accumulation of S-OPA1 due to L-OPA1 cleavage is observed in mitochondrial fragmentation and dysfunction. However, cells contain a mixture of both L- and S-OPA1 in normal conditions, suggesting the functional significance of maintaining both OPA1 forms, but the differential roles of L- and S-OPA1 in mitochondrial fusion and energetics are ill-defined. Here, we examined mitochondrial fusion and energetic activities in cells possessing L-OPA1 alone, S-OPA1 alone, or both L- and S-OPA1. Using a mitochondrial fusion assay, we established that L-OPA1 confers fusion competence, whereas S-OPA1 does not. Remarkably, we found that S-OPA1 alone without L-OPA1 can maintain oxidative phosphorylation function as judged by growth in oxidative phosphorylation-requiring media, respiration measurements, and levels of the respiratory complexes. Most strikingly, S-OPA1 alone maintained normal mitochondrial cristae structure, which has been commonly assumed to be the function of OPA1 oligomers containing both L- and S-OPA1. Furthermore, we found that the GTPase activity of OPA1 is critical for maintaining cristae tightness and thus energetic competency. Our results demonstrate that, contrary to conventional notion, S-OPA1 is fully competent for maintaining mitochondrial energetics and cristae structure.

Keywords: OPA1; bioenergetics; cristae; mitochondria; mitochondrial disease; mitochondrial fusion; mitochondrial metabolism; mitochondrial respiratory chain complex.


Conflict of interest statement

The authors declare that they have no conflicts of interest with the contents of this article

Figures

Figure 1.
Figure 1.
OPA1 variants and MEFs differentially expressing these variants. A, OPA1 proteolytic cleavages occur at S1 and S2 in exons 5 and 5b. CC, coiled-coil domain; MID, middle domain; GED, GTPase effector domain; MPP, mitochondrial processing peptidase. The variant 1 (OPA1-v1) contains the S1 site where partial cleavage occurs, producing both L- and S-OPA1 (L/S-OPA1). OPA1-v1ΔS1 only produces L-OPA1 due to the deletion of the S1 site in OPA1-v1. OPA1-v5 generates S-OPA1 only because of full cleavage at the S1 site. Amino acid numbers are indicated for each construct. B, three OPA1 variants were expressed in OPA1-KO MEFs, and stable clones were isolated. Immunoblots of cell lysates from these cells show exclusive expression of L-OPA1 and S-OPA1 in MEFs expressing OPA1-v1ΔS1 and OPA1-v5, respectively, and the presence of both L- and S-OPA1 in cells expressing OPA1-v1.
Figure 2.
Figure 2.
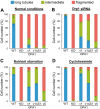
L-OPA1 alone has the capacity to elongate mitochondria in pro-fusion conditions. Mitochondrial tubule formation was assessed in normal conditions (A) and conditions of fission inhibition (B) and SIMH (C and D) in cells expressing different OPA1 variants. Mitochondrial lengths were categorized into long tubules, intermediate, and fragmented. In both fission inhibition and SIMH conditions, OPA1-v1 and v1ΔS1 significantly increased the formation of tubular mitochondria. Mitochondrial tubule formation by OPA1-v5 was minimal. n = 4. Error bars are S.E.
Figure 3.
Figure 3.
Assessments of fusion competency by PEG cell hybrid assays. Mixed cultures of OPA1-KO cells with DsRed-labeled mitochondria and OPA1 variant cells with GFP-labeled mitochondria were treated with PEG, and mixing of red and green fluorescence was evaluated in hybrid cells. A, examples of mitochondrial images from the fusion assay representing no fusion, partial fusion, and complete fusion. Scale bar, 20 μm. B, OPA1-v1 and OPA1-v1ΔS1 are fusion-competent, whereas OPA1-v5 has very little fusion capacity. n = 3. Error bars are S.E.
Figure 4.
Figure 4.
L- or S-OPA1 alone is sufficient to support mitochondrial respiratory function. A, OXPHOS assessment by cell growth in galactose media. All cell lines including OPA1-KO cells grew well in the glycolytic media. In galactose media, OPA1-KO did not grow, whereas WT and OPA1 variant cells grew with no discernible difference in their growth rates. Experiments were done in quadruplicate and repeated three times. Representative data are presented. B and C, oxygen consumption rates (OCR) of OPA1 variant cells show no difference from that of WT, whereas OPA1-KO cells are respiration-deficient. The respiration control ratios of uncoupled maximum respiration (state 3u) to leak respiration under oligomycin (state 4o) were indistinguishable in OPA1 variants and WT. n = 6. Error bars are S.E. ***, p < 0.0001; #, p = 0.0002; **, p = 0.0089 (one-way ANOVA with Tukey's post hoc test). D and E, immunoblotting of WT and OPA1 variant cells in galactose and SIMH conditions. Cells were incubated in 10 mm glucose (Glc) or galactose (Gal) for 24 h (D). For SIMH, cells were incubated in HBSS for 3 h (Strv) or in 10 μm cycloheximide (Chx) for 6 h (E). There are no changes in L- and S-OPA1 in galactose and HBSS incubations. Cycloheximide incubation appears to increase L-OPA1 cleavage in WT and OPA1-v1 cells. Olm, oligomycin; FCCP, carbonyl cyanide p-trifluoromethoxyphenylhydrazone; Con, control.
Figure 5.
Figure 5.
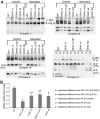
L- and S-OPA1 are indistinguishable in restoring mitochondrial respiratory complexes. BNGE was used to examine respiratory complexes and supercomplexes. A, OPA1-KO cells have significantly decreased levels of respiratory complexes except complex I. Note that supercomplex assembly was not affected by OPA1-KO. OPA1-KO cells accumulate F1 domain of complex V (shown in the long exposure). OPA1-v1, -v1ΔS1, and -v5 restored the levels of complexes III, IV, and V with a minimal recovery of complex II. There is no distinction between OPA1-v1ΔS1 and OPA1-v5 in restoring respiratory complexes. Numbers in parentheses indicate the size of the complexes in kDa. B, quantification of total band density for individual complexes in each cell line. n = 5. Error bars are S.E. (one-way ANOVA with Tukey's post hoc test). IB, immunoblotting.
Figure 6.
Figure 6.
No functional distinction between L- and S-OPA1 in maintaining respiratory complexes and mtDNA. A, respiratory complexes after starvation assessed by BNGE. Starvation does not significantly affect the complex levels except for complex I. Increased complex I levels were seen after starvation across the cell lines. * in the complex IV blot indicates a potential dimer. B, expression of OPA1 variants in OPA1-KO cells restores mtDNA levels. mtDNA and nuclear DNA were quantified using PCR with primer sets for ATP6 and GAPDH, respectively. OPA1-KO cells contain ∼30% of mtDNA copy number compared with WT cells. All three OPA1 variant cells showed ∼60% of the WT level, indicating partial recovery of mtDNA copy numbers. n = 4. Error bars are S.E. (Student's t test (two-tailed)).
Figure 7.
Figure 7.
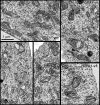
EM images of mitochondria in WT, OPA1-KO, and OPA1 variant cells. No or a few cristae are in OPA1-KO mitochondria. OPA1 variant cells restored cristae structure, showing increased numbers of cristae and tight lamellae similar to those in WT cells. Scale bar, 1 μm.
Figure 8.
Figure 8.
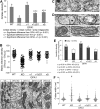
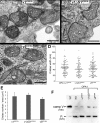
Analyses of cristae structure in OPA1 variant cells. A, quantification of cristae density. The number of cristae was counted for each mitochondrion and divided by the mitochondrial area in megapixels. Six to 16 mitochondria were analyzed in each cell for 11 cells per cell line. n = 111, 82, 83, 91, and 79 for WT, OPA1-KO, -v1, -v1ΔS1, and -v5, respectively. Error bars are S.E. (one-way ANOVA with Tukey's post hoc test). B, matrix electron density is presented by matrix gray value (GV[mat]) after background subtraction (GV[cyt]) in individual mitochondria. Distribution of matrix electron density was plotted with the average gray value (horizontal line) for each cell line along with low magnification EM images. n = 139, 130, 135, 150, and 139 for WT, OPA1-KO, -v1, -v1ΔS1, and -v5, respectively. #, p < 0.0001 (one-way ANOVA with Tukey's post hoc test). Scale bar, 0.5 μm. C, septa (arrowheads) in mitochondria of OPA1-KO cells. Scale bars, 0.5 μm. D, STJ (arrows) in OPA1-KO and OPA1-v5 cells. Scale bars, 0.5 μm. E, quantification of CCJ and STJ. The numbers of CCJ and STJ were separately counted and divided by the mitochondrial area in megapixels. 11 cells were analyzed for each cell line. n = 101, 79, 68, 83, and 69 for WT, OPA1-KO, -v1, -v1ΔS1, and -v5, respectively. Error bars are S.E. (one-way ANOVA with Tukey's post hoc test). F, quantification of cristae width for assessing cristae tightness. Distribution of cristae width in nm was plotted with the median width (horizontal line) for each cell line. n = 146, 171, 177, 125, and 159 for WT, OPA1-KO, -v1, -v1ΔS1, and -v5, respectively. #, p < 0.001 (one-way ANOVA with Tukey's post hoc test).
Figure 9.
Figure 9.
OPA1 GTPase activity is required for mitochondrial fusion and OXPHOS. A, mitochondrial tubule formation was assessed by SIMH using cycloheximide in cells expressing Lys-to-Ala mutant OPA1 variants. In both normal and SIMH conditions, mitochondria in mutant OPA1-expressing cells remained fragmented. n = 4. Error bars are S.E. B, OXPHOS assessment of Lys-to-Ala mutant OPA1 variant cells by cell growth in galactose media. Although all cells grew well in the glycolytic media, Lys-to-Ala mutant-expressing cells grew for 3 days and abruptly died on day 4. Experiments were done in quadruplicate and repeated three times. Representative data are presented.
Figure 10.
Figure 10.
OPA1 GTPase activity is critical for maintaining cristae tightness. A–C, EM images of OPA1 GTPase-defective mutant cells. Cristae are swollen and round. Scale bar, 0.5 μm. D, quantification of cristae width. Distribution of cristae width in nm was plotted with the mean width (horizontal line) for each cell line. n = 103, 94, and 124 for OPA1-v1-K301A, -v1ΔS1-K291A, and -v5-K319A, respectively. E, quantification of cristae density. The number of cristae was counted for each mitochondrion and divided by the mitochondrial area in μm2. Three to 10 mitochondria were analyzed in each cell for 10 cells per cell line. n = 44, 54, and 56 for OPA1-v1-K301A, -v1ΔS1-K291A, and -v5-K319A, respectively. Error bars are S.E. F, immunoblotting of BNGE for complex V. Lys-to-Ala mutant OPA1 variant cells show disrupted complex V assembly, accumulating F1 domain of complex V, identical to OPA1-KO cells. Numbers in parentheses indicate the size in kDa.

Similar articles

Cited by

References

    1. Smirnova E., Griparic L., Shurland D. L., and van der Bliek A. M. (2001) Dynamin-related protein Drp1 is required for mitochondrial division in mammalian cells. Mol. Biol. Cell 12, 2245–2256 - PMC - PubMed
    1. Yoon Y., Pitts K. R., and McNiven M. A. (2001) Mammalian dynamin-like protein DLP1 tubulates membranes. Mol. Biol. Cell 12, 2894–2905 - PMC - PubMed
    1. Chen H., Detmer S. A., Ewald A. J., Griffin E. E., Fraser S. E., and Chan D. C. (2003) Mitofusins Mfn1 and Mfn2 coordinately regulate mitochondrial fusion and are essential for embryonic development. J. Cell Biol. 160, 189–200 - PMC - PubMed
    1. Koshiba T., Detmer S. A., Kaiser J. T., Chen H., McCaffery J. M., and Chan D. C. (2004) Structural basis of mitochondrial tethering by mitofusin complexes. Science 305, 858–862 - PubMed
    1. Cipolat S., Martins de Brito O., Dal Zilio B., and Scorrano L. (2004) OPA1 requires mitofusin 1 to promote mitochondrial fusion. Proc. Natl. Acad. Sci. U.S.A. 101, 15927–15932 - PMC - PubMed

MeSH terms

LinkOut - more resources