. 2017 May 1;28(9):1208-1222.
doi: 10.1091/mbc.E16-11-0774. Epub 2017 Mar 15.

Protein arginine methyltransferases interact with intraflagellar transport particles and change location during flagellar growth and resorption

Affiliations

Protein arginine methyltransferases interact with intraflagellar transport particles and change location during flagellar growth and resorption

Katsutoshi Mizuno et al. Mol Biol Cell. .

Abstract

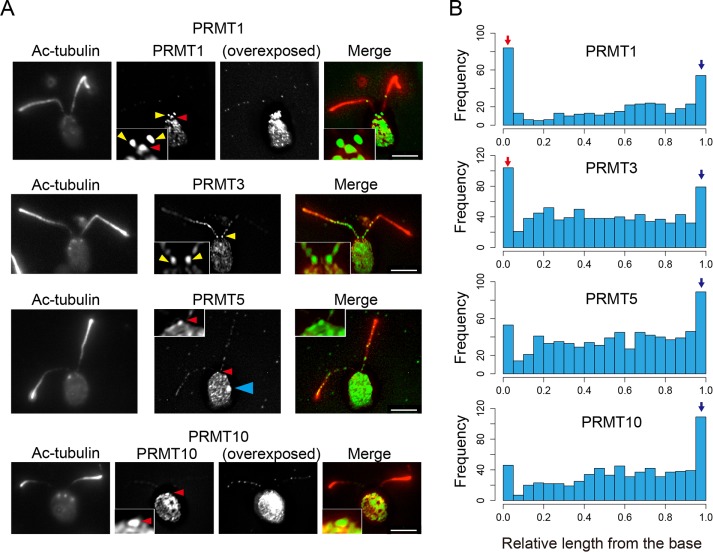
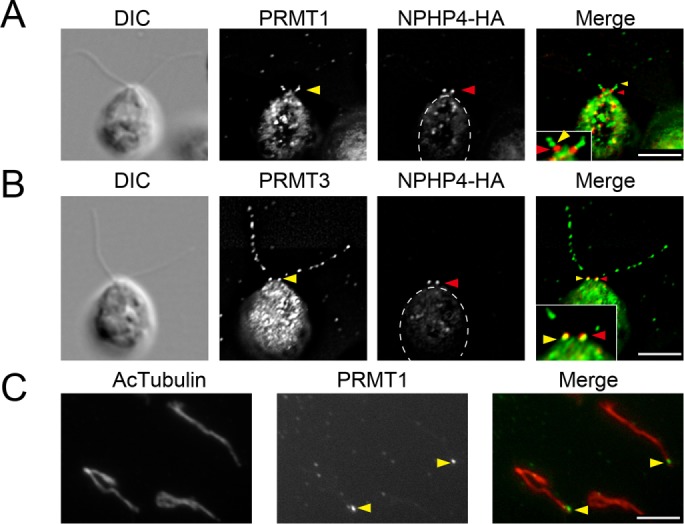
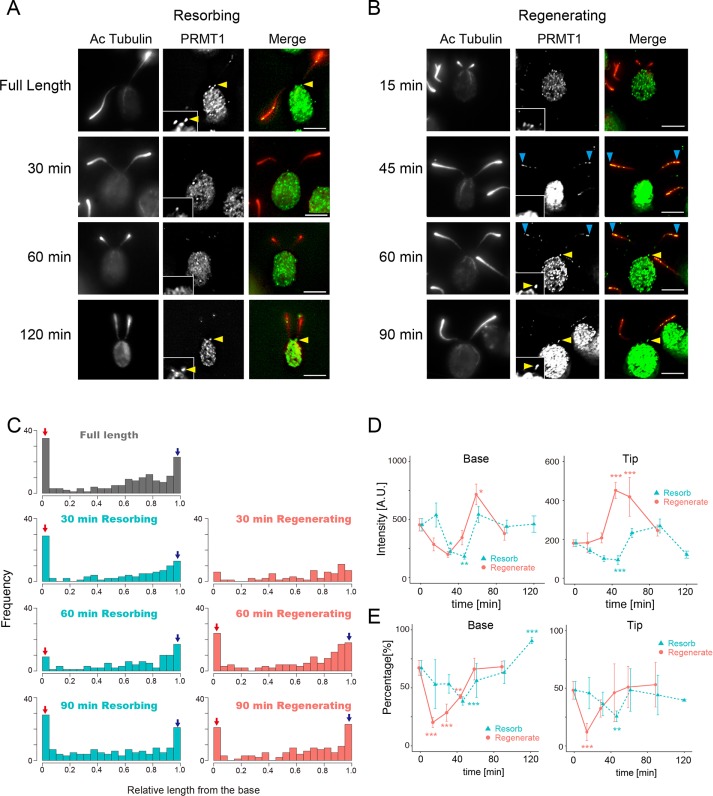
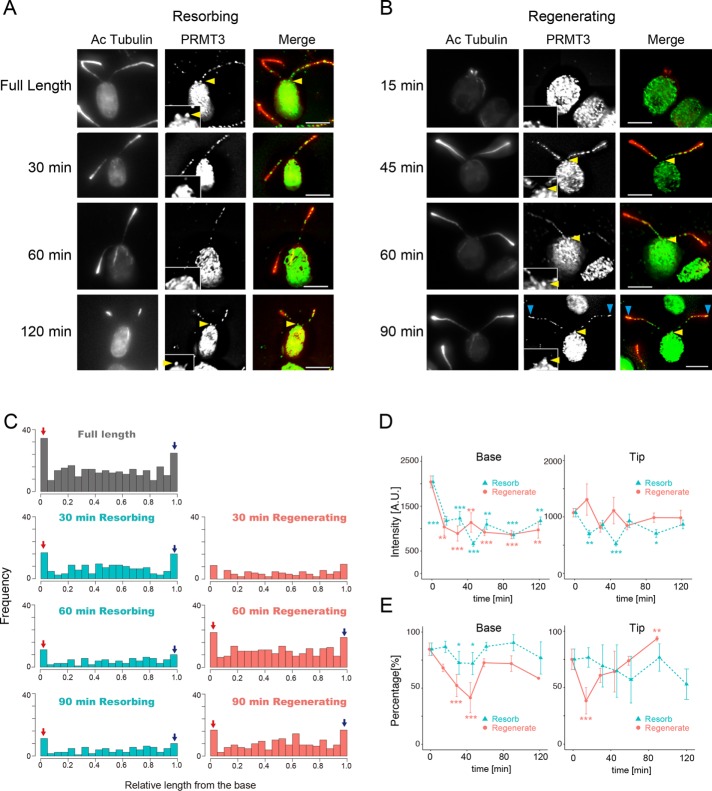
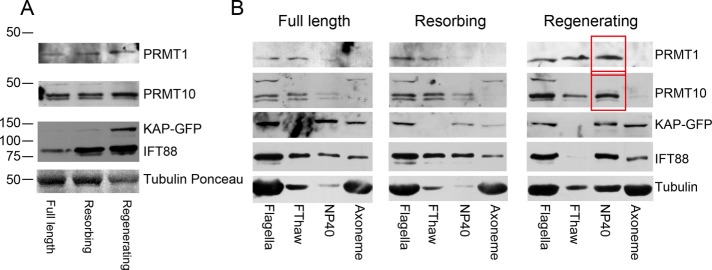
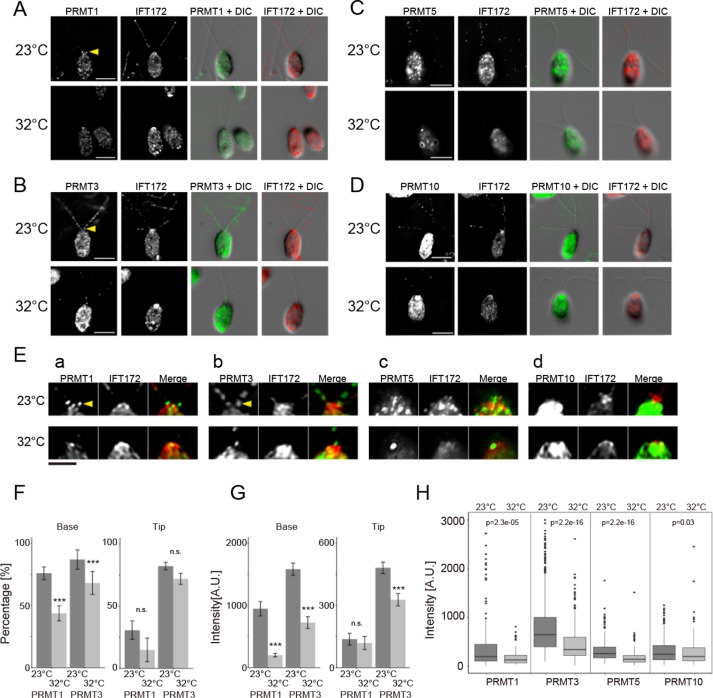
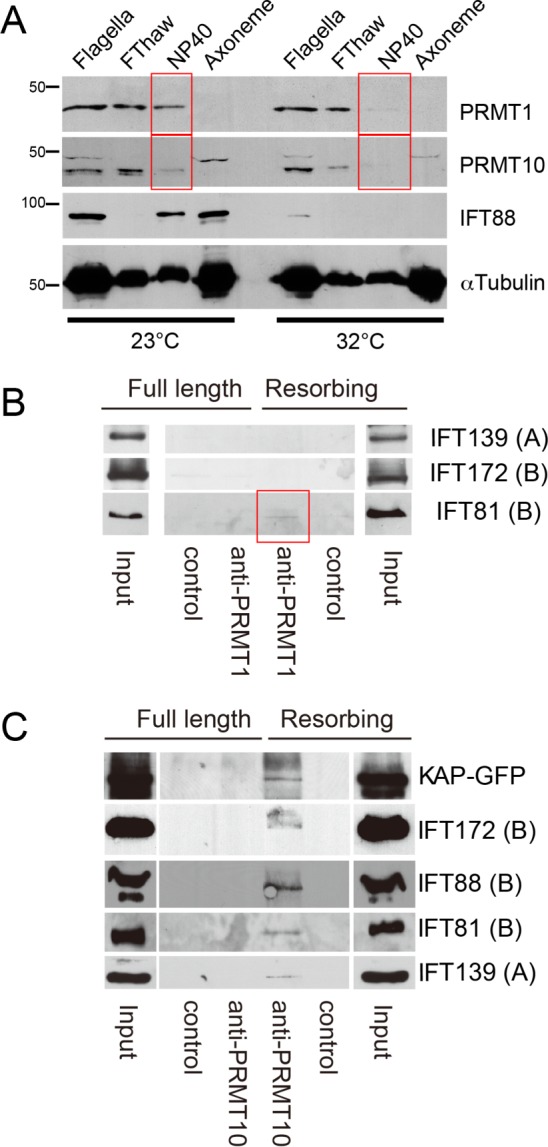
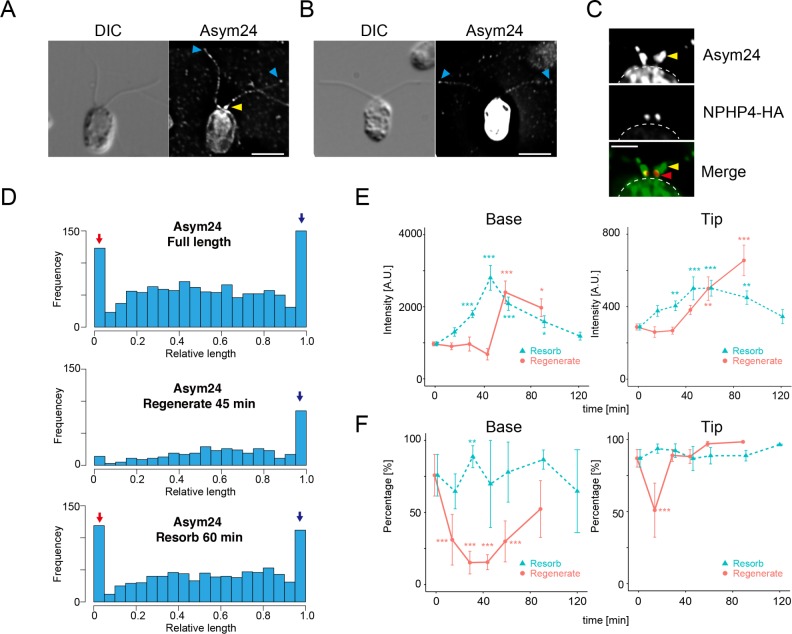
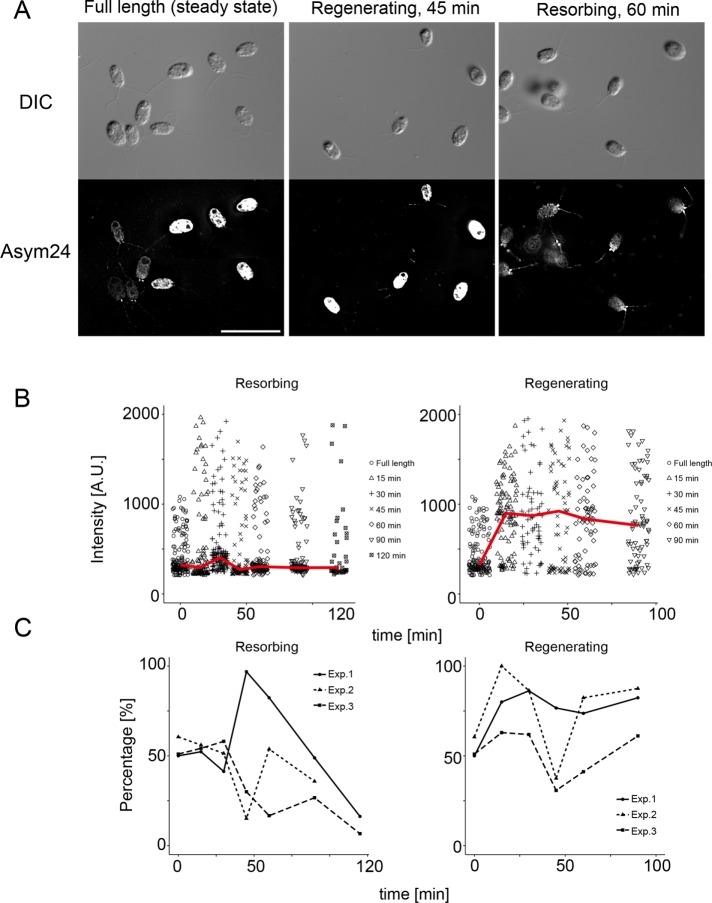
Changes in protein by posttranslational modifications comprise an important mechanism for the control of many cellular processes. Several flagellar proteins are methylated on arginine residues during flagellar resorption; however, the function is not understood. To learn more about the role of protein methylation during flagellar dynamics, we focused on protein arginine methyltransferases (PRMTs) 1, 3, 5, and 10. These PRMTs localize to the tip of flagella and in a punctate pattern along the length, very similar, but not identical, to that of intraflagellar transport (IFT) components. In addition, we found that PRMT 1 and 3 are also highly enriched at the base of the flagella, and the basal localization of these PRMTs changes during flagellar regeneration and resorption. Proteins with methyl arginine residues are also enriched at the tip and base of flagella, and their localization also changes during flagellar assembly and disassembly. PRMTs are lost from the flagella of fla10-1 cells, which carry a temperature-sensitive mutation in the anterograde motor for IFT. The data define the distribution of specific PRMTs and their target proteins in flagella and demonstrate that PRMTs are cargo for translocation within flagella by the process of IFT.


Figures

FIGURE 1:
FIGURE 1:
PRMTs localize in flagella in a punctate pattern and are enriched at the tip; PRMT 1 and 3 are also enriched at the base of flagella. (A) Immunofluorescence microscopy of WT cells using anti–acetylated tubulin antibody (Ac-tubulin; red) and anti-PRMT antibodies (green). PRMT 1, 3, 5, and 10 are present in puncta along the flagella, and PRMT 1 and 3 show a significant enrichment at the flagella base. Yellow arrowheads indicate PRMTs in the proximal region of the flagella. Red arrowheads indicate the apical region of the cell occupied by the basal body. Note also the localization of PRMT 5 to the eyespot (blue arrowhead). Like PRMT 1 and 3, PRMT 5 and 10 localization also occurs where the flagella meet the cell body, that is, the apical region of the cell occupied by the basal bodies. For PRMT 1 and 10, overexposed images are shown in order to make the punctate pattern readily visible. Insets, enlarged images of the flagella base to demonstrate clearly the enrichment of these enzymes at the base. Scale bars, 5 µm. (B) Histogram of PRMT localization along flagella from base to tip. X-axis, relative position of PRMT signals from the base (0) to the tip (1.0; see Materials and Methods for an explanation of this measurement]. Y-axis, number of puncta at each length position. For all PRMTs, the number of puncta detected at the tip (blue arrow) is greater than at other positions along the length. For PRMT 1 and 3, the frequency of basal puncta is remarkable (red arrow). The number of puncta counted for each histogram: PRMT 1, 401 from 137 flagella; PRMT3; 878 from 123 flagella, PRMT 5; 773 from 177 flagella; and PRMT 10, 702 from 153 flagella.
FIGURE 2:
FIGURE 2:
PRMT 1 and 3 localization at the base of flagella. (A, B) Immuno­fluorescence microscopy using cells expressing HA-tagged NPHP4 detected with anti-HA antibody (red). The cells are also labeled (green) with anti-PRMT 1 (A) and anti-PRMT 3 (B). Yellow arrowheads indicate the basal localization of PRMTs. Red arrowheads indicate the location of NPHP-HA. The basal localization of PRMT 1 is more distal than that of NPHP4-HA, a marker of the transition zone. By comparison, a portion of the PRMT 3 signal colocalizes with the NPHP4-HA signal. Insets, expanded images of the flagellar base. (C) Immunofluorescence microscopy of isolated flagella. Flagella are stained with anti–acetylated tubulin (Ac-tubulin; red) and anti-PRMT 1 (green). Localization of PRMT 1 is still detected at the base of the detached flagella, confirming the localization of PRMT 1 at a position distal to the transition zone. Cell bodies are outlined with dashed lines. Scale bars, 5 µm.
FIGURE 3:
FIGURE 3:
PRMT 1 changes localization during flagellar regeneration and resorption. (A) Immunofluorescence microscopy of WT cells with resorbing flagella, using anti–acetylated tubulin (Ac-tubulin, red) and anti-PRMT 1 antibodies (green). PRMT 1 is not often observed at the base of flagella at 30 and 60 min after the initiation of resorption but reappears at the base by 120 min. Insets, enlarged images of the flagellar base. Yellow arrowheads indicate the accumulation of PRMT1 at the proximal end of the flagella. Scale bars, 5 µm. (B) Immunofluorescence microscopy of WT cells with regenerating flagella, using anti–Ac-tubulin (red) and anti-PRMT 1 antibodies (green). PRMT 1 is absent from the base during flagellar regeneration (15–45 min) but reappears at 60–90 min. Insets, enlarged images of the flagellar base. Yellow arrowheads indicate PRMT1 in the proximal end of the flagella. Blue arrowheads indicate localization of PRMT1 at the tip. Scale bars, 5 µm. (C) Histograms of PRMT 1 localization along the length of resorbing (left) and regenerating (right) flagella. Red arrows indicate the relative number of puncta at the base of the flagella, and blue arrows indicate the tip accumulation. (D) Quantification of PRMT 1 intensity at the base (left) and the tip (right) during regeneration (red) or resorption (green). Mean ± SEM from three independent experiments for each time point. For these data, the tip corresponds to the value of 0.95–1.0 in relative flagellar length (the rightmost bin in C). The base corresponds to the value of 0.0–0.05 in relative flagellar length (leftmost bin in C). The number of flagella and puncta analyzed for each time point are listed in Supplemental Table S1. Statistical significance was determined by the Steel–Dwass test. *p < 0.05, **p < 0.01, ***p < 0.001. (E) Comparison of the percentage of flagella with basal PRMT 1 signal (left) and tip PRMT 1 signal (right) during regeneration (red) or resorption (green). Mean ± SEM from three independent experiments. The number of flagella and the number of puncta analyzed are summarized in Supplemental Table S1. Statistical significance was determined by Fisher’s exact test, with correction for multiple comparison using Holm’s method. *p < 0.05, **p < 0.01, ***p < 0.001.
FIGURE 4:
FIGURE 4:
PRMT 3 changes localization during flagellar regeneration and resorption. (A) Immunofluorescence microscopy of WT cells with resorbing flagella, using anti–acetylated tubulin (Ac-tubulin, red) and anti-PRMT 3 antibodies (green). PRMT 3 is not detected at the flagellar base during resorption (30–60 min). PRMT 3 reappears at the base by 120 min but with a lower intensity than with full-length flagella. Insets, enlarged images of the flagellar base. Yellow arrowheads indicate the accumulation of PRMT3 at the proximal end of the flagella. Scale bars, 5 µm. (B) Immunofluorescence microscopy of WT cells regenerating flagella, using anti–Ac-tubulin (red) and anti-PRMT 3 antibodies (green). A strong punctate pattern of PRMT 3 along the flagellar length can be detected early in regeneration. PRMT 3 at the base, although present throughout, is weaker during flagellar regeneration than in mature, full-length flagella. Inset, enlarged images of the flagellar base. Yellow arrowheads indicate the PRMT3 in the proximal end of the flagella. Blue arrowheads indicate localization of PRMT3 at the flagellar tip. Scale bars, 5 µm. (C) Red arrows indicate the relative number of puncta at the base of the flagella and blue arrows indicate the tip accumulation. (D) Quantification of PRMT 3 intensity at the base (left) and the tip (right) during regeneration (red) or resorption (green). Mean ± SEM from three independent experiments for each time point. For these data, the tip corresponds to the value of 0.95–1.0 in relative flagellar length (the rightmost bin in C). The base corresponds to the value of 0.0–0.05 in relative flagellar length (leftmost bin in C). The number of flagella and puncta counted for each time point are listed in Supplemental Table S1. Statistical significance was determined by the Steel–Dwass test. *p < 0.05, **p < 0.01, ***p < 0.001. (E) Comparison of the percentage of flagella with basal PRMT 3 signal (left) and tip PRMT 3 signal (right) during flagellar regeneration (red) or resorption (blue). Mean ± SEM from three independent experiments. The numbers of flagella and the number of puncta analyzed are summarized in Supplemental Table S1. Statistical significance was determined by the Fisher’s exact test, with correction for multiple comparison using Holm’s method. *p < 0.05, **p < 0.01, ***p < 0.001. Scale bar, 5 µm.
FIGURE 5:
FIGURE 5:
PRMT 1 and 10 are enhanced in regenerating and resorbing flagella. (A) Immuno­blots of full-length, resorbing, and regenerating flagella using the antibodies indicated. The concentration of each sample was adjusted to 1 mg/ml, and equal volumes of sample were loaded. Tubulin stained with Ponceau S is shown as a loading control. The PRMT 1 band migrates more slowly in samples of regenerating flagella. PRMT 10 always appears as a doublet, and the upper band becomes more pronounced relative to the lower band in regenerating flagella. The amount of IFT88 is greatly increased in both resorbing and regenerating flagella, whereas the amount of KAP-GFP was only observed to increase in regenerating flagella. This is likely because the KAP-GFP lane has been underexposed so as not to overexpose the signal from IFT88. (B) Samples of full-length, resorbing, and regenerating flagella were fractionated into the freeze-thaw supernatant (FThaw), NP-40 extract (membrane fraction), and axonemes, adjusted to 1 mg/ml, separated by SDS–PAGE, and blotted, and the blot was probed with the indicated antibodies. Changes in band intensities as noted in Results are indicated with red boxes.
FIGURE 6:
FIGURE 6:
PRMT levels are decreased or lost in flagella of fla10-1 cells shifted to the restrictive temperature. (A–D) Immunofluorescence microscopy of fla10-1 at the permissive (23°C) and restrictive (32°C) temperatures. Cells were probed with anti-IFT172 (red) and anti-PRMT 1 (A), anti-PRMT 3 (B), anti-PRMT 5 (C), and anti-PRMT 10 (D) (green). The basal, tip, and punctate localizations of the PRMTs noted at the permissive temperature are all weakened or lost at the restrictive temperature. Scale bar, 5 µm. (E) Expanded images of the flagellar bases from A–D. Scale bar, 2.5 µm. Yellow arrowheads in A and B indicate the accumulation of PRMTs in the proximal region of the flagella. (F) Comparison of the percentage of fla10-1 flagella with basal and tip localizations of PRMT 1 and 3. The percentage of flagella with enhanced PRMT 1 basal localization was significantly decreased at the restrictive temperature; the data for tip localization were not significantly different. Mean ± SEM from three independent experiments. The numbers of flagella and puncta counted along the flagella length are shown in Supplemental Table S2. Statistical significance was determined by the Fisher’s exact test, with correction for multiple comparison using Holm’s method. ***p < 0.001. (G) Comparison of the mean intensity of PRMT 1 and 3 puncta at the flagellar base and tip. Both PRMT 1 and 3 showed a significant decrease in basal intensity at the restrictive temperature. The decrease in tip intensity was significant in PRMT 3 but not in PRMT 1. Mean ± SEM from three independent experiments. The numbers of puncta and flagella counted are shown in Supplemental Table S2. Statistical significance was determined by the Mann–Whitney U test. ***p < 0.001. (H) Comparison of PRMT spot intensities from the base to the tip of flagella for each of PRMT 1, 3, 5, and 10. All PRMTs showed a significant decrease in intensity at the restrictive temperature. Data from three independent experiments. Numbers of puncta and flagella analyzed are shown in Supplemental Table S2. Statistical significance was determined by the Mann–Whitney U test. p values are shown above the data pairs.
FIGURE 7:
FIGURE 7:
PRMT levels in flagella from fla10-1 cells at the permissive and restrictive temperatures. (A) Immunoblots of flagella from fla10-1 cells at the permissive and restrictive temperatures. Flagella were fractionated into freeze-thaw supernatant (FThaw), NP-40 extract, and axonemes. The concentration of each sample was adjusted to 1 mg/ml, and equal volumes of sample were separated by SDS–PAGE and probed with the indicated antibodies. Although the relative amounts of PRMT 1 and 10 in intact flagella did not change at the restrictive temperature, PRMT 1 and 10 were absent from the NP-40 extract at the restrictive temperature (red boxes). (B) Immunoblots of an IP experiment using PRMT 1 antibodies. The starting material for IP was an NP-40 extract (membrane plus matrix fraction) of full-length or resorbing flagella isolated from pf18fla3::KAP-GFP cells. The input and eluate of each IP was probed with the indicated antibodies. Components of IFT complex A are indicated as (A), and components of IFT complex B are indicated as (B). A small amount of IFT81 was precipitated only from resorbing flagella (red box). (C) Immunoblots of samples immunoprecipitated using PRMT 10 antibodies. The starting material was NP-40 extracts (membrane plus matrix fraction) of full-length and resorbing flagella isolated from pf18fla3::KAP-GFP. Both components of IFT complexes A and B, as well as KAP-GFP, were precipitated only from resorbing flagella. Scale bar, 5 µm.
FIGURE 8:
FIGURE 8:
Flagellar proteins modified with aDMA are present at the flagellar base and tip. (A) Immunofluorescence microscopy of a WT cell using Asym24 antibodies that label aDMA-modified proteins. In this image, the cell body is not strongly stained. The flagellar base and tip are labeled with Asym24, and a punctate pattern of stain is observed along the flagella length. (B) In comparison to the cell in A, some cells in the same preparation showed very strong labeling of the cell body. Label at the flagellar tip was also observed, but the enrichment at the flagellar base is not clearly visible in cells with strong cell body staining. Yellow arrowheads indicate accumulation of aDMA in the proximal region of the flagella. Blue arrowheads indicate localization of aDMA at the flagellar tip. Scale bar, 5 µm (A, B). (C) Immuno­fluorescence microscopy of a NPHP4-HA cell using Asym24 and anti-HA antibodies. The signal from Asym24 at the flagellar base was observed at the transition zone and at more distal region near the flagellar base. These images are comparable to that of PRMT 1 and PRMT 3 localization (Figure 2). The border of the cell body is indicated by the dashed line. Yellow arrowheads indicate accumulation of aDMA in the proximal region of the flagella. Red arrowheads indicate the location of NPHP-HA. Scale bar, 2 µm. (D) Histograms of Asym24 signal localization along the flagella in cells with full-length flagella (top), regenerating flagella (45 min regenerating; middle), and resorbing flagella (60 min resorbing; bottom). In cells with full-length flagella, the accumulation of Asym24 signal at the flagellar base (red arrow) and the tip (blue arrow) is clearly visible (top). The basal signal of Asym24 is lost in regenerating flagella. but enrichment at the tip is maintained (blue arrow; middle). In resorbing flagella, strong enrichment at the base and the tip is observed (red and blue arrow, bottom). (E) Comparison of Asym24 intensity during flagellar regeneration (red) or resorption (green). Intensity of the flagellar base (left) or tip (right) is plotted as a function of time after the initiation of flagellar resorption or regeneration. Mean ± SEM from three independent experiments. For these data, the tip corresponds to the value of 0.95–1.0 in relative flagellar length (the rightmost bin in D). The base corresponds to the value of 0.0–0.05 in relative flagellar length (leftmost bin in D). Numbers of flagella and puncta for each time point are summarized in Supplemental Table S3. Statistical significance was determined by the Steel–Dwass test. *p < 0.05, **p < 0.01, ***p < 0.001. (F) Comparison of the percentages of flagella with a basal (left) and tip (right) Asym24 signal plotted as a function of the time after initiation of resorption or regeneration. Mean ± SEM from three independent experiments. The number of flagella and puncta counted are summarized in Supplemental Table S3. Statistical significance is determined by the Fisher’s exact test, with correction for multiple comparison with Holm’s method (**p < 0.01, ***p < 0.001).
FIGURE 9:
FIGURE 9:
aDMA modifications in the cell body of Chlamydomonas. (A) Immunofluorescence microscopy using Asym24 antibodies in WT cells with full-length, regenerating, and resorbing flagella. In cells with full-length flagella, half of the cells had weaker cell body staining with basal localization of aDMA-modified proteins. In cells with regenerating flagella (45 min regenerating), almost all cells had a relatively strong cell body signal. In cells with resorbing flagella (60 min resorbing), almost all cells had a weaker signal in the cell body and a strong basal signal in the flagella. Scale bar, 20 µm. (B) The intensities from cell bodies using Asym24 antibodies plotted as a function of time after the initiation of flagellar resorption (left) and regeneration (right). Each data point indicates the intensity from each cell body stained with Asym24. The median values of intensities at each time point are shown with red lines. At 0 min, about half of the cells showed an intensity with a relative value <300, and the other half of the cells had larger cellular intensities. In resorbing flagella, the staining intensity of cells increased, but still a proportion of cells showed lower intensity values, and the median values did not show large changes. However, in regenerating flagella, almost all cells showed an increase in staining intensity, which remained high throughout the time course of flagellar regeneration. (C) Percentages of cells with strong cellular intensities from labeling with Asym24 antibodies plotted as a function of time during flagellar resorption (left) and regeneration (right). In cells with resorbing flagella, the percentage of cells with strong cell body signals decreased to almost 0% at 120 min. In regenerating flagella, all cells showed a similar pattern of change. The percentage of cells with stronger cellular intensities first increased at 15–30 min and subsequently decreased at 45 min. Finally, staining intensities increased at the completion of flagellar regeneration.

Similar articles

Cited by

References

    1. Abramoff MD, Magalhaes PJ, Ram SJ. Image processing with Image J. Biophoton Int. 2004;11:36–42.
    1. Afzelius BA. Cilia-related diseases. J Pathol. 2004;204:470–477. - PMC - PubMed
    1. Ahmad A, Dong Y, Cao X. Characterization of the PRMT gene family in rice reveals conservation of arginine methylation. PLoS One. 2011;6:e22664. - PMC - PubMed
    1. Awata J, Takada S, Standley C, Lechtreck KF, Bellve KD, Pazour GJ, Fogarty KE, Witman GB. NPHP4 controls ciliary trafficking of membrane proteins and large soluble proteins at the transition zone. J Cell Sci. 2014;127:4714–4727. - PMC - PubMed
    1. Bachand F. Protein arginine methyltransferases: from unicellular eukaryotes to humans. Eukaryot Cell. 2007;6:889–898. - PMC - PubMed

MeSH terms

Substances

LinkOut - more resources