. 2017 Mar;14(128):20170035.
doi: 10.1098/rsif.2017.0035.

Frequency tuning and directional sensitivity of tympanal vibrations in the field cricket Gryllus bimaculatus

Affiliations

Frequency tuning and directional sensitivity of tympanal vibrations in the field cricket Gryllus bimaculatus

Martin J Lankheet et al. J R Soc Interface. 2017 Mar.

Abstract

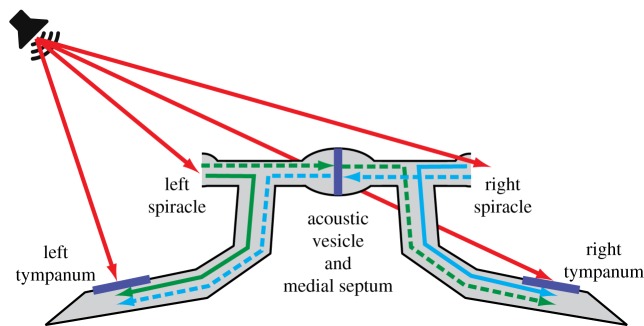
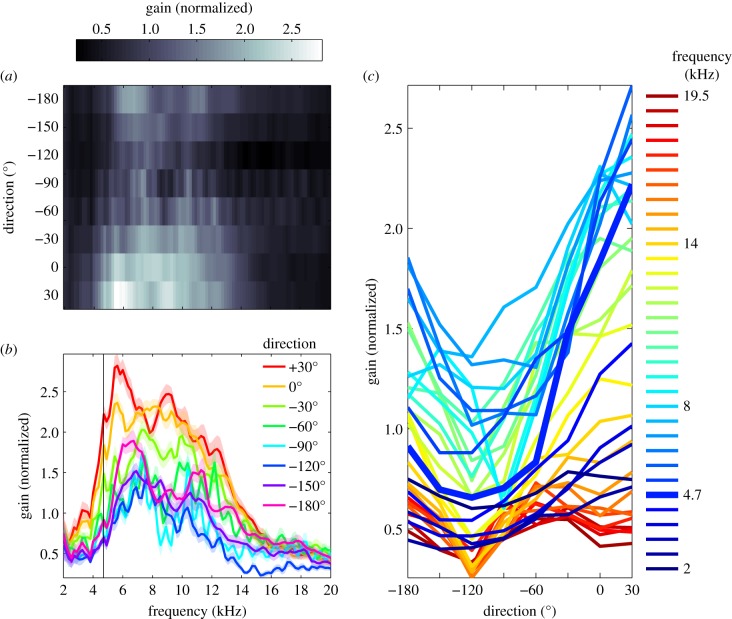
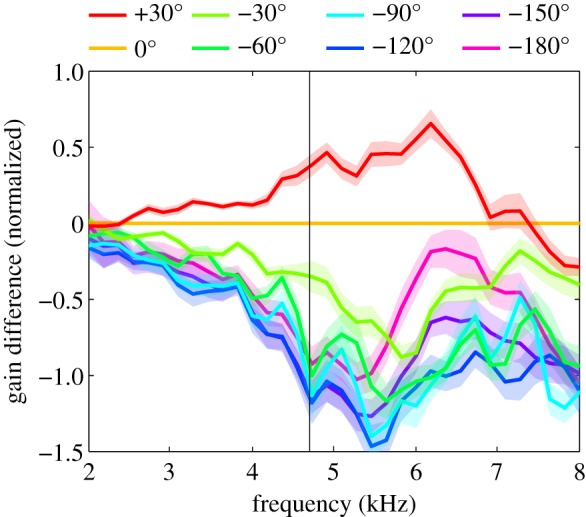
Female field crickets use phonotaxis to locate males by their calling song. Male song production and female behavioural sensitivity form a pair of matched frequency filters, which in Gryllus bimaculatus are tuned to a frequency of about 4.7 kHz. Directional sensitivity is supported by an elaborate system of acoustic tracheae, which make the ears function as pressure difference receivers. As a result, phase differences between left and right sound inputs are transformed into vibration amplitude differences. Here we critically tested the hypothesis that acoustic properties of internal transmissions play a major role in tuning directional sensitivity to the calling song frequency, by measuring tympanal vibrations as a function of sound direction and frequency. Rather than sharp frequency tuning of directional sensitivity corresponding to the calling song, we found broad frequency tuning, with optima shifted to higher frequencies. These findings agree with predictions from a vector summation model for combining external and internal sounds. We show that the model provides robust directional sensitivity that is, however, broadly tuned with an optimum well above the calling song frequency. We therefore advocate that additional filtering, e.g. at a higher (neuronal) level, significantly contributes to frequency tuning of directional sensitivity.

Keywords: directional hearing; laser Doppler vibrometer; phase shift; phonotaxis; pressure difference receiver.


Figures

Figure 1.
Figure 1.
Sound interactions in the cricket auditory system. The tympana are located on the tibia of the prothoracic legs. Sound from different inputs may propagate through air-filled tracheae and act on the interior tympanum surface by linear superposition. Red arrows indicate direct, external sounds at the four inputs. Internal transmissions from spiracles to ipsi- and contralateral tympana are given in green and blue; solid lines for ipsilateral transmissions and dashed lines for contralateral transmissions. Internal propagation from the contralateral tympanum is presumably negligible [23] and omitted in the diagram. Contralateral transmissions include the action of the medial septum, located centrally in the transverse acoustic vesicle.
Figure 2.
Figure 2.
Laser Doppler vibrometer (LDV) and microphone measurements. (a) Schematic of the experimental set-up: the LDV measured vibrations of the right posterior tympanum, for sounds varying from +30° to −180° relative to straight ahead (0°). Sound pressure amplitudes were recorded with a microphone located 25 mm above the centre of the pronotum. (b) Example of the recorded stimulus, LDV and microphone responses. Amplitudes are given in arbitrary units; we were merely interested in normalized gains, measured in the linear range (see electronic supplementary material, figure S1). Because the order of stimuli was randomized, reflections from preceding stimuli (e.g. below the label ‘microphone’) hardly affected the measurements. (Online version in colour.)
Figure 3.
Figure 3.
Model results for the effects of internal phase shifts on directional sensitivity. Panels (a,b) show examples of the vector sum (black arrows) of direct, external sounds at the tympanum (lt and rt: left and right tympanum, respectively), and the internally transmitted sounds from the two spiracles (rs and ls: right and left spiracle, respectively). Grey arrows indicate vector summation. The examples show results for ipsilateral (a) and contralateral (b) sounds of 4.7 kHz with the loudspeaker located at +60° and −60°. Panels (c,d) show the amplitudes of the vector sum for all possible (0–360°, in steps of 15°) combinations of ipsilateral and contralateral, internal phase shifts. Optimal directional sensitivity requires high amplitude for ipsilateral sounds (star in panel (c)), and low amplitude for contralateral sounds (star in panel (d)). Panels (e,f) show directional sensitivity, quantified either as a difference (e) or as a ratio (f) for ipsi- and contralateral vibration amplitudes. All scaling is relative to the amplitude of external sounds at the rt, which was defined as unity (see Methods).
Figure 4.
Figure 4.
Frequency tuning curves for 20 crickets, for sound directions of +30°, 0° and −30°. Gains express amplitudes of displacement vibrations divided by sound pressure amplitudes, normalized to the mean value across directions and frequencies for each cricket. Each curve shows the mean for 20 repetitions. Thick, black lines correspond to the mean value for all animals. Panels (b,d,f) show the results for frequencies ranging from 3 to 7 kHz in more detail. Vertical, black lines indicate the 4.7 kHz calling song frequency. A horizontal grid line at a gain of 2 is added for visual guidance.
Figure 5.
Figure 5.
Average gains of tympanum displacements as a function of sound direction and sound frequency. Gains quantify displacement amplitudes divided by sound pressure amplitudes, normalized to the mean value for each cricket, and averaged for 20 individuals. (a) Average gains as a function of sound frequency and sound direction. (b) Average gains as a function of frequency for different sound directions (as indicated in the legend). Confidence intervals represent standard errors of the means for 20 crickets. (c) Same gain data as in (a) and (b), plotted as a function of sound direction, with frequency in kHz indicated in the legend. The calling song frequency is about 4.7 kHz, corresponding to the bold, blue line.
Figure 6.
Figure 6.
Directional sensitivity. Differences in gain of vibration amplitudes relative to the straight-ahead direction (0°) are plotted as a function of sound frequency. Confidence intervals represent ± 1 s.e.m. for 20 individuals.

References

    1. Bennet-Clark HC. 1999. Resonators in insect sound production: how insects produce loud pure-tone songs. J. Exp. Biol. 202, 3347–3357. - PubMed
    1. Montealegre ZF, Jonsson T, Robert D. 2011. Sound radiation and wing mechanics in stridulating field crickets (Orthoptera: Gryllidae). J. Exp. Biol. 214, 2105–2117. (10.1242/jeb.056283) - DOI - PubMed
    1. Murphey RK, Zaretsky MD. 1972. Orientation to calling song by female crickets, Scapsipedus marginatus (Gryllidae). J. Exp. Biol. 56, 335–352. - PubMed
    1. Hedwig B, Poulet JFA. 2004. Complex auditory behaviour emerges from simple reactive steering. Nature 430, 781–785. (10.1038/nature02723.1) - DOI - PubMed
    1. Hedwig B, Poulet JFA. 2005. Mechanisms underlying phonotactic steering in the cricket Gryllus bimaculatus revealed with a fast trackball system. J. Exp. Biol. 208, 915–927. (10.1242/jeb.01452) - DOI - PubMed